Electromotive Force and Measurement in Several Systems Part 10 ppt
Bạn đang xem bản rút gọn của tài liệu. Xem và tải ngay bản đầy đủ của tài liệu tại đây (530.77 KB, 15 trang )
Electromotive Force and Measurement in Several Systems
124
OECD/NEA Handbool. (2007). Handbook on Lead-bismuth Eutectic Alloy and Lead Properties,
Materials Compatibility, Thermal-hydraulics and Technologies
(2007), pp. 151-165, ISBN
978-92-64-99002-9
Sakata, M.; Kimura, T. & Goto, T. (2007). Microstructures and Electrical Properties of Ru-C
Nano-composite Films by PECVD.
Materials Transactions, Vol. 48 (January 2007),
pp. 58-63, ISSN 1345-9678
Schroer, C. et al. (2011). Design and Testing of Electochemical Oxygen Sensors for Service in
Liquid Lead Alloys.
Journal of Nuclear Materials,Vol. 415 (August 2011), pp.338-347,
ISSN 0022-3115
Shmatko, B. A. & Rusanov, A. E. (2000). Oxide Protection of Materials in Melts of Lead and
Bismuth.
Materials Science, Vol. 36, No. 5 (May 2000), pp. 689-700, ISSN 1068-820X
7
Electromotive Force Measurements in
High-Temperature Systems
Dominika Jendrzejczyk-Handzlik and Krzysztof Fitzner
AGH University of Science and Technology, Laboratory of Physical Chemistry and
Electrochemistry, Faculty of Non-Ferrous Metals, Krakow,
Poland
1. Introduction
Stability of phases existing in chemical systems is determined by its Gibbs free energy
designated as G. The relative position of Gibbs free energy surfaces in the G–T–X
(composition) space determines stability ranges of respective phases yielding a map called
the phase diagram. Since the knowledge of phase equilibria is essential in designing new
materials, determination of Gibbs free energy for respective phases is being continued on
both theoretical as well as experimental ways. While in principle chemical potentials of pure
substances are needed to derive Gibbs free energy of formation of the stoichiometric phases,
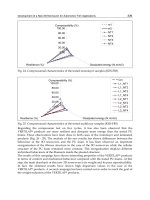
it is not the case for the phase ( solid or liquid) with variable composition. As an example, in
Fig 1, G
m
for three different systems is shown. Fig.1a shows free energy of formation of the
intermetallic, stoichiometric Mg
2
Si phase recalculated per one mole of atoms (Turkdogan,
1980). Fig1b illustrates Gibbs energy of formation of one mole of liquid In-Pb solution
(Hultgren, 1973). Finally, Fig.1c demonstrates Gibbs energy of formation of the solid phase,
wustite ( ‘FeO’) (Spencer & Kubaschewski, 1978).
Fig. 1. Gibbs free energy of formation of a) stoichiometric Mg
2
O phase, b) liquid In-Pb
solution, c) solid phase ‘FeO’ wustite.
In the last two cases experimental information about chemical potentials of both
components in the solution (partial Gibbs energies) was necessary to obtain G
m
vs.
composition dependencies at fixed temperature.
a)
b)
c)
X
O
Electromotive Force and Measurement in Several Systems
126
In general, there are four experimental methods, namely calorimetry, vapour pressure,
electrochemical and phase equilibration, one can use to obtain thermodynamic functions,
which describe properties of respective phases, solid or liquid. Calorimetry is an
indispensable tool to measure enthalpy changes , but its weakness consists in the fact that a
number of calorimetric measurements must be combined in order to obtain Gibbs energy
changes. Vapour pressure methods (both static and dynamic) cover wide range of vapour
pressures from which standard free energy change as well as activities (chemical potentials)
of components in the solution can be obtained. The most powerful modification of this
technique is effusion method combined with mass spectrometry, which identifies and gives
the partial pressure of all species present in the gas phase. Another advantage is the
temperature of experiments, which cannot be matched by any other method. Partial Gibbs
energy can also be derived from the investigation of equilibrium between different phases.
In most cases the success of this method relies heavily on the accuracy of chemical analysis
of phases involved in chemical equilibrium. Finally, an electrochemical method (so-called
e.m.f. method) which is based on properly designed electrochemical cell can supply
information about chemical potential of the components in any phase: gaseous, liquid or
solid. Though, undoubtedly calorimetry is the most precise and direct method to measure
heat effects of chemical changes i.e. enthalpy changes, chemical potential is needed to derive
Gibbs free energy change. Both, e.m.f. and vapour pressure methods can yield chemical
potential of the component through its activity measurements, but this approach has one
weakness. Usually, we can measure activity for only one component in the solution. In
good, old days Gibbs-Duhem equation was used to solve this problem and to derive
activities for other components. In the age of modeling and computers this problem is
solved much faster and the desired expression:
G
m
= X
A
A
+ X
B
B
+ … (1)
(where X
i
denotes mole fraction and
i
denotes chemical potential)
for Gibbs free energy of one mole of the either solid or liquid phase can be easily obtained.
As far as the determination of the partial Gibbs energy of the components is concerned, in
our opinion the electrochemical method may be considered as the most accurate one,
though not without many traps. Ben Alcock used to say that e.m.f. method is the best
method to derive activity of the component in the solution if…….works. This humorous and
even a little spiteful comment is perhaps a good reason to discuss the principles and the
range of applicability of this method.
2. Principles
When an electronic conductor (metal, semiconductor, polymer) is brought into equilibrium
with ionic conductor (liquid electrolyte solution, molten salt, solid electrolyte, etc.) an
interface between these two phases is created. Then, due to the charge separation between
these two phases, the interface is charged and an electric potential difference across the
interface builds up. Such a two-phase system one may call the electrode (half-cell) and it can
be schematically shown in Fig.2.
The change between the properties of the electronic and ionic conductors must take place
over the certain distance (however small). Thus, instead of razor-sharp interface, it is better
to think about an interphase region, which is a region of changing properties between
Electromotive Force Measurements in High-Temperature Systems
127
phases. In fact, this region decides about the charge transfer process between the two
phases. This charge transfer process is the electrode reaction, and generally it takes place
between oxidized and reduced species:
Ox + ze = Red (2)
which in case of a metal M in contact with the solution containing its ions M
+
can be written
as:
M
+
+ e = M (3)
From this electrode reaction results the potential buildup
M+/M
at the interface.
It is
assumed that this reaction is reversible (transfer of charge takes place with the same rate in
both directions) and the Laws of thermodynamics can be applied to it. Leaving classification
of various electrodes to electrochemists, let’s see how this potential can be determined.
Fig. 2. Scheme of the electrode – electrolyte interface.
The answer to this problem is simple: we need another electrode which must serve as a
reference. The single potential cannot be measured, but we can always measure its
difference between two half-cells. Thus, the proper construction based on two electrodes
yields the source of electric potential difference called electromotive force E (e.m.f.). Such a
construction, which is schematically shown in Fig. 3, is called an electrochemical cell.
Electromotive Force and Measurement in Several Systems
128
Fig. 3. General scheme of an electrochemical cell.
If this cell is not connected to the external circuit, its internal chemical processes are at
equilibrium and do not cause any net flow of charge. Electrochemical energy can be stored.
However, if it is connected, then under potential difference the charge must pass from the
region of the lower to higher potential. Consequently, to force the charge to flow, work must
be done. For any chemical process occurring under constant p and T, the maximum work
that can be done by the system is equal to the decrease in its Gibbs free energy:
work W = -G (4)
If this work is electrical one, it equals to the product of charge passed Q = zF and voltage E.
For balanced cell reaction, which brought about the transfer of z moles of electrons, this
work is given by:
W = zFE = -G (5)
where E is cell’s electromotive force. From this relationship, the change in Gibbs free energy
for the reversible well defined chemical reaction which takes place inside the cell, can be
determined as:
G = -zFE (6)
where z is number of moles of electrons involved in the process and F is Faraday constant
( i.e. the charge of one mole of electrons). Using well-known relations between G, H and
S one can express corresponding enthalpy and entropy changes through E vs. T
dependence as:
S = zF(jE/jT )
p
(7)
and
p
HzFEzFTE/T (8)
Thus, from measured E vs.T dependence, all thermodynamic functions of the well-defined
chemical process taking place inside the cell can be derived.
Electromotive Force Measurements in High-Temperature Systems
129
Under the assumption of chemical equilibrium , eq.6 can be also applied to the electrode
reaction. Using the relationship between G and an equilibrium constant K, which is:
G = G
0
+ RT ln K (9)
and combining equations (6) and (9), one can arrive at Nernst’s equation:
Ox/Red
=
0
Ox/Red
– ( RT/zF) ln K (10)
in which K is an equilibrium constant written for any electrode reaction in the state of
equilibrium (in fact dynamic one). In eq.10,
Ox/Red
is an electrode potential,
0
Ox/Red
is
standard electrode potential (all species taking part in the reaction are at unit activity) and z
in a number of moles of electrons taking part in a charge transfer.
Having established all necessary dependencies for electrode potential one can ask how two
half-cells can be combined to construct electrochemical cell, and how electromotive force E
can be obtained in each case. The general scheme of the cell’s classification is shown in Fig.4
Fig. 4. Classification of the electrochemical cells.
This scheme is based on two characteristic features:
the nature of the chemical process responsible for the electromotive force production,
the manner in which the cell is assembled ( i.e. where two half-cells are combined into
one whole with or without the junction).
Following several simple rules, which say that:
positive electrode is placed always on the right-hand side of each cell’s scheme,
electrode reactions are always written as reduction reactions,
electromotive force E for each type of the cell is calculated as the difference of the
electrode potentials:
E =
right
–
left
(11)
one can analyze each type of the cell construction to see how E is developed, and what kind
of thermodynamic information can it deliver.
Electromotive Force and Measurement in Several Systems
130
3. Cells construction
3.1 Chemical cell without transference
We start our considerations from the chemical cells. Schematic representation of this kind of
a cell is shown in Fig.5.
Fig. 5. Scheme of a chemical cell without transference.
Left-hand side electrode consists of the pure metal or alloy, which is immersed into the
solution containing its cations (e.g. molten salt). Potential of this electrode written for the
reduction reaction :
M
z+
+ ze = M (12)
is
0
ΦΦ(RT /zF)ln(a / a )
zz Mz
M/M M/M M
(13)
On the right-hand electrode gas X
2
remines in contact with the liquid ionic phase fixing
chemical equilibrium of the reaction:
(z/2)X ze zX
2
(14)
and establishing the potential :
z/2
0z
ΦΦ(RT / zF)ln(a /p )
-
X
X/X X/X X
2
22
(15)
Consequently, according to the rule mentioned above, the electromotive force of the cell is:
Electromotive Force Measurements in High-Temperature Systems
131
z/2
0z
E Φ E(RT/zF)ln(ap /a a)
-Mz-
X
XMX
2
z
M
(16)
Fixing X
2
pressure at the electrode (e.g.
2
X
p
= 1bar), and assuming that
z
aaa
z
MX X
M
z
, we have :
0
E E (RT/zF)ln(a /a )
M
MX
z
(17)
It is clear that this type of the cell can be used to measure activities of the components either
in metallic or in ionic solution. It is also clear that overall cell reaction is:
M + (z/2) X
2
= MX
z
(18)
and a decrease of Gibbs free energy of this reaction is responsible for the e.m.f. production.
The characteristic feature of this cell construction is
the same liquid electrolyte solution in
contact with both electrodes.
3.2 Chemical cell with transference
Another type of chemical cell is so-called Daniell-type cell, in which two dissimilar metals
are immersed into two different liquid electrolytes forming two half-cells. To prevent these
electrolytes from mixing and consequently, irreversible exchange reaction in the solution,
they are separated by the barrier, which however must assure electric contact between both
half-cells. The scheme of this cell is shown in Fig.6
Fig. 6. Scheme of a chemical cell with transference.
The barrier called a junction can be liquid or solid (salt bridge, permeable diaphragm, ion-
selective membrane) and can connect the half-cells in a number of different ways . Writing
the reduction reaction at the electrodes as:
A
n+
+ ne = A (19)
Φ‘
Φ’’
Electromotive Force and Measurement in Several Systems
132
B
m+
+ me = B (20)
and assuming that metals used in electrodes are pure, one can write the expression for
electrode potentials:
0
ΦΦ(RT/nF)ln(1/a )
nn n
A/A A/A A
(21)
0
ΦΦ(RT/mF)ln(1/a )
mm m
B/B B/B B
(22)
The e.m.f. of this cell produced by the exchange reaction:
mA + nB
m+
= nB + mA
n+
(23)
is
0mn
E E (RT/zF)ln(a /a )
nm
AB
(24)
where z = nm, activity of metals is equal to one, and expression under logarithm represents
equilibrium constant K of the reaction (23). Thus, this cell may provide information about
Gibbs free energy change of the exchange reaction at constant temperature, entropy and
enthalpy changes can be also obtained if temperature dependence of the e.m.f. is measured.
It is not very convenient for high temperature measurements, but can be used successfully
while working with aqueous solutions, especially when one half-cell is set as the reference
electrode. The characteristic feature of this type of cell is the separation of
two different
electrolytes with the junction assuring electrical contact, but preventing solutions from
mixing. Consequently, since two more interfaces in contact with the solution appeared in
the cell, there is a hidden potential drop across the junction
E
junction
= ” - ’ in measured E which not always can be precisely determined. Thus,
measurements based on cells with transference may not give as accurate data as chemical
cells.
3.3 Concentration cells without transference
If in the same electrolyte solution pure metal and its alloy are submerged, galvanic cell is
created. Its scheme is shown in Fig. 7
Two electrode reactions can be written as:
M
z+
+ ze = M (25)
on the l.h.s , and
M
z+
+ ze = M (26)
on the right, which is more positive.
Corresponding electrode potentials are:
0
ΦΦ(RT/zF)ln(1/a )
zz z
M/M M/M M
(27)
and
Electromotive Force Measurements in High-Temperature Systems
133
0
ΦΦ(RT /zF)ln(a /a )
zz Mz
M/M M/M M
(28)
Fig. 7. Scheme of a concentration cell without transference.
The net cell reaction in this case is:
M = M (29)
and E of this cell is generated by the concentration (chemical potential) difference, and has
the final form:
E = – (RT/zF) ln a
M
(30)
since activity of metal cations is fixed and standard electrode potentials for both electrodes
are the same (E
0
= 0). From equations (30) and (6) after rearrangement one may obtain:
RT ln a
M
= -zFE = G
m
(31)
Thus, the free energy change of the transfer process from pure state into the solution can be
derived directly from measured E. It is probably the most convenient way to obtain partial
function of the alloy component. If the E vs.T dependencies are linear ( i.e. E = a+bT ),
partial entropy and partial enthalpy for the process (29) can be obtained directly for a given
composition of the alloy from eqs. (7) and (8):
S
M
= zFb (32)
H
M
= -zFa (33)
Again, characteristic feature of this cell is
the same electrolyte with fixed concentration of
M
z+
ions for both electrodes and the missing junction.
3.4 Concentration cells with transference
The last type of cell is based on the junction which is selectively conducting with one type of
an ion. Two versions of this type of cell are schematically shown in Fig. 8. Let’s consider the
Electromotive Force and Measurement in Several Systems
134
construction given in Fig.8a. Two identical metals (in Fig.8b two identical gaseous species)
which are shown are in contact with two electrolyte solutions of two different compositions.
These two half-cells are connected through the cation (anion) conducting membrane.
Fig. 8. Scheme of a concentration cell with transference: a) cation conductivity membrane, b)
anion conductivity membrane.
If concentration of cations is such that on l.h.s it is higher (a’ > a’’) than on the right side,
diffusion of cations will proceed and it sets up electric potential difference across the
membrane. This potential gradient eventually will stop diffusion and equilibrium is
reached. Due to cations migration to the right side, this electrode is more positive. Writing
reduction reactions on both electrodes as:
( MX)’ + e = M + X
-
(34)
and
(MX)’’ + e = M + X
-
(35)
one can express electrode potentials as:
'0'
ΦΦ (RT/F)ln(a /a )
'
XMX
(36)
"0"
ΦΦ (RT/F)ln(a /a )
"
XMX
(37)
Again, since both standard potentials are identical and activity of X
-
will not change due to
the action of ion- selective membrane which stops their transfer, e.m.f. of this cell ( similar
reasoning can be given for the cell shown in Fig.8b) is:
E(RT/F)ln(a /a )
"'
MX MX
(38)
If on left side of the cell there is pure MX, then e.m.f. gives directly activity of MX in the
solution. However, one must remember that measured E has again an internal contribution
from the voltage drop across the junction. Having described principles of cells operation
and construction, let’s have a brief look at the beginning of the story.
Electromotive Force Measurements in High-Temperature Systems
135
3.4.1 The road to solid electrolytes
Probably, the first-ever type of cells employed to e.m.f. measurements in molten salts was
Daniell – type cell employed by Sackur (1918). Relatively easy to construct while working
with aqueous solutions, it faced difficulty when temperature of the cell operation was
raised. At high temperatures it was used to study molten salts. Concentration cells without
transference appeared to be more convenient to study metallic systems. Consequently, this
kind of research was initiated by Taylor (1923) and Seltz (1935). Working with cells with
transference the main problem connected with this construction was a junction between
half-cells and generated junction potential. To avoid interactions between different solutions
a number of coupling was tried to assure the electrical contact between the half-cells. While
in aqueous solutions the salt bridge was (and still is) the best solution, at high temperature
this particular connection brought about same problems. Examples of different half-cell
connections tried in the past are shown in Fig.9.
(a) (b) (c)
Fig. 9. Different construction of a bridge joining half cells: a) capillary bridge after Lorenz &
Michael (1928), b) density difference after Holub et al (1935), c) MgO soaked in molten salt
after Flood et al (1952).
In this Figure junctions employed by Lorenz & Michael (1928), Holub et al in 1935 and
Flood et al in 1952 are shown. The main problem was to estimate E
junction
in each case.
In approximately the same time Salstrom (1933) and next Salstrom and Hildebrandt (1930)
initiated a series of investigations of molten salts using chemical cells. It was soon realized
that proper combination of two chemical cells e.g. M
1
/M
1
X/X
2
and M
2
/M
2
X/X
2
should in
principle yield the result equivalent to the result of an exchange reaction completed in the
concentration cell M
1
/M
1
X//M
2
/M
2
X . These findings stimulated both: development of
chemical cells which became a source of thermodynamic data for pure substances as well as
their solutions, and also employment of concentration cells to provide not only the data for
systems for which chemical cells could not be assembled, but also to study the junction
potential itself. Its value apparently varied depending on a junction’s construction. It
appeared to be small for the liquid junction, but as shown by Tamman (1924) who used the
cell Ag,AgCl/ glass /PbCl
2
,Pb, it could be quite significant. Thus, the nature of the junction :
liquid or solid, mechanical (frit, gel) or ion-conducting (glass) apparently played significant
role in the generated potential drop across the junction. Though experiments with solid
substances which played part of electrolytes were already under way, the theory was
needed to explain observed discrepancies.
Electromotive Force and Measurement in Several Systems
136
Carl Wagner (1933, 1936) derived the expression for the steady - state ,open – circuit voltage
across the scale of solid inorganic compound. Being Walter Schottky’s student ,Wagner with
his characteristic brightness realized the importance of the defect structure of the solids and
its influence on the conductivity. He put forward the theory which gave foundations of the
knowledge necessary to design materials, today called solid electrolytes. However, he had
to wait almost 25 years to demonstrate applicability of this concept in thermodynamic
measurements. In the pioneering work with Kiukkola (1957) they demonstrated that
zirconium oxide doped with CaO can be used as the solid electrolyte conducting with
oxygen ions. His theory in the simplified version can be explained today in the framework
of non-equilibrium thermodynamics.
Let’s suppose that through the layer of an inorganic material three species: cations C, anions
X and electrons e can migrate. According to Onsager’s theory in 1931 their fluxes can be
described by the equations:
J
C
= L
CC
grad
C
+ L
CX
grad
X
+ L
Ce
grad (39)
J
X
= L
XC
grad
C
+ L
XX
grad
X
+ L
Xe
grad (40)
I
e
= L
eC
grad µ
C
+ L
eX
grad µ
X
+ L
ee
grad (41)
where gradients of chemical potential and electric field play the role of forces responsible for
the flow of species and charge through the layer. In the linear regime the matrix of linear
coefficients is symmetric i.e. L
ij
= L
ji
. For the open circuit electric current is zero i.e. I
e
=0,
and from eq.41 one can obtain:
- grad = ( L
eC
/L
ee
) grad
C
+ ( L
eX
/L
ee
) grad
X
(42)
In turn, if there is no gradient of chemical potentials in the system, and the charge flow is
caused by the gradient of electric field, taking the ratio of total current and ion fluxes one
can arrive at the expressions:
J
C
/ I
e
= (L
Ce
/ L
ee
) and J
X
/ I
e
= (L
Xe
/ L
ee
) (43)
Introducing transference numbers defined as I
C
/ I
e
= t
C
= z
C
F J
C
/ I
e
and I
X
/ I
e
= t
X
= z
X
F
J
X
/ I
e
, and taking into account reciprocal relations L
ij
= L
ji
, one can rewrite the equation (42)
in the following form:
- grad = ( t
C
/ z
C
F) grad
C
+ (t
X
/ z
X
F ) grad
X
(44)
If inorganic material is conducting only with anions, transference numbers do not depend
on chemical potential, and t
X
= 1 – t
e
, then eq.44 can be integrated across the inorganic layer
to yield:
’’ – ’ = E = - {(1- t
e
)/ z
X
F} d
X
(45)
In the absence of electronic conductivity in the material ( t
e
= 0 ), and for gaseous species X
2
for which
0
μμRTlnp
X
XX
2
, one can arrive at the general formula:
"'
E(RT/zF)lnp /p
XXX
22
(46)
Electromotive Force Measurements in High-Temperature Systems
137
Using equation (44) it is also easy to show how liquid junction potential ( E
junction
) is
generated. Let’s assume that instead of the inorganic solid layer, there is the liquid
interphase layer between two solutions. In this liquid phase dissociating electrolyte CX
yields ions C
z+
and X
z-
, which may move independently through the liquid. Then, from
(44) one obtains:
E
junction
= - RT/F ( t
+
/z
+
) dln a
+
- RT/F ( t
-
/z
-
) dlna
-
(47)
Having z
+
= 1 and z
-
= -1, and assuming for the aqueous solution a
+
= a
-
= c
CX
, equation (47)
can be rearranged and integrated along the layer to yield:
E
junction
= -( RT/F) ( t
+
- t
-
) ln { c
2
/ c
1
} (48)
It is clear that for equal transference numbers ( i.e. mobility) the potential drop across the
junction is nil.
Since the time of Wagner’s paper a number of excellent elaborations was devoted to the
solid electrolytes field (Alcock, 1968; Rapp & Shores, 1970; Goto & Pluschkell, 1972;
Subbarao, 1980), and we are not going to compete with them. Instead, we’d like to present
those areas of research in which, using solid electrolytes, we were able to obtain new data
and to small extend we contributed to the extension of the knowledge about
thermodynamic properties of high temperature systems.
3.4.2 Oxygen in dilute liquid solutions
To describe the solute element behavior over dilute solution range, free energy interaction
coefficients were introduced. However, experimental evidence gathered so far is mainly
limited to copper and iron alloys. Working on the review which summarized up to 1988 the
data on the solubility of oxygen in liquid metals and alloys (Chang et al, 1988) we found out
that there is virtually no information about solute-oxygen interaction in the liquids from
which A
III
B
V
semiconducting crystals are grown. The problem is not trival since electrical
and optical properties of so–called III-V compounds are influenced by oxygen or water
vapor in the growth environment. Oxygen incorporated into crystal brings about a decrease
in carrier concentration, photoluminescence efficiency and deterioration of surface
morphology. Thus, severe requirements regarding purity of crystals grown from the liquid
phase stimulate the need for the data on thermodynamics of solutions containing oxygen
dissolved in III-V alloys.
The application of the coulometric titration method to the study of oxygen solubility in
liquid metals was first initiated by Alcock and Belford in 1964, and further developed by
Ramanarayanan and Rapp in 1972. Our experimental method and the procedure can be
described briefly in the following way. Using the electrochemical cell of the type:
W, A – B – O / O
2-
/ air, Pt I
titrations were carried out in the chosen temperature range, which depended on the system
studied. In this cell A denotes In and Ga, while B denotes As and P. AB alloys of the chosen
composition were prepared in evacuated and sealed silica capsules by melting oxygen free
metals with respective MX compounds. Samples were kept at constant temperature for 24 h
and then quenched. The tube of the solid electrolyte contained between 2 and 3 g of metallic
alloy. A tungsten wire acted as an electric contact with a metal electrode. The outer part of
the solid electrolyte tube coated with platinum paste worked as an air reference electrode
Electromotive Force and Measurement in Several Systems
138
and was connected to the electric circuit with a platinum wire. The electric circuit contained
a potentiostat with a charge meter and digital voltmeter. Purified argon was allowed
through the cell just above the surface of the liquid metal. The schematic cell I arrangement
is shown in Fig. 10.
Fig. 10. Scheme of electrochemical cell with air reference electrode by Wypartowicz &
Fitzner (1987).
After the equilibrium electromotive force of the cell E
1
had been recorded, the preselected
additional potential E was applied by the potentiostat. The resulting current passed
through the cell in such a direction that oxygen was pumped out of the alloy. The decrease
in oxygen concentration resulted in an increase of the e.m.f. of the cell and a decay of the
electric current. The final e.m.f. value E
2
and the electric charge passed Q were recorded.
The experimental run was repeated several times at the same temperature, then the
temperature was changed.
Activity coefficients of oxygen in liquid alloys were calculated from:
1/2
fp /C
0
O(1)
O
2
(49)
where p
O2
is directly related to the initial e.m.f. through the equation:
1/2
E (RT/2F)ln(0.21/p )
1
O
2
(50)
and the oxygen concentration C
O(1)
can be obtained from two equations: