Features of Liquid Crystal Display Materials and Processes Part 11 potx
Bạn đang xem bản rút gọn của tài liệu. Xem và tải ngay bản đầy đủ của tài liệu tại đây (898.47 KB, 20 trang )
189
Portable LCD Image Quality: Effects of Surround Luminance
MTF(u)
sin nu
nu
sin c nu
(8)
where denotes the Fourier transform of the argument.
Viewing flare can be defined as the additional luminance due to surface reflections off the
front of a display caused by ambient illumination. It boosts the PSF by a constant offset level
as illustrated in Fig. 5 (b); thus, the zero frequency response (or dc component) is increased
only and other frequency responses remain the same if the signal is transformed into Fourier
domain. When the MTF is normalised at the maximum, MTF(0) = 1 and MTF(u>0) is
multiplied by a weighting factor α for u > 0 as shown in eq. (9).
MTFi (u) MTF0 (u)
sin c nu
(9)
where i represents the amount of viewing flare. For instance of this, MTF0 shows the MTF
for dark viewing condition so MTFi is the MTF for a viewing condition where the amount of
viewing flare is i cd/m2. The weighting factor α refers to the ratio of zero frequency response
between MTF0(u) and MTFi(u) as given in Eq. (10). Practically, mean value of the PSF can be
simply used instead of calculating zero frequency response of the MTF in Fourier domain
therefore α values should be identical to the relative Michelson contrast to the dark viewing
condition as can be expected (See Table 1).
MTF0 (0) LMax ,0 LMin ,0 / 2
MTFi (0) LMax , i LMin ,i / 2
(10)
The estimated MTF of the LCD monitor used in this study is presented in Fig. 6 (See the
solid line). Single-pixel size of the LCD is set to be 0.00474° in visual angle unit. The
estimated MTFs for the higher illumination levels are shown in Fig. 6 as well represented by
dashed and dotted lines.
1.0
0.9
0.8
Dark
Overcast
Bright
MTF
0.7
0.6
0.5
0.4
0.3
0.2
0.1
0.0
0 5 10 15 20 25 30 35 40 45 50 55 60 65 70
Spatial Frequency (cycles per degree)
Fig. 6. MTF of the LCD used in this study and the approximated MTFs under two different
levels of viewing flare. Single-pixel size of the LCD is set to be 0.00474° in visual angle unit.
The compensation factors (α) for viewing flare for the three viewing conditions are listed in
Table 3.
190
Features of Liquid Crystal Display Materials and Processes
Dark
Overcast
Bright
1
0.534
0.191
φ
Table 3. The surround luminance effect function (φ)
2.3.4 Estimating CSF by compensating for MTF
As given in eqs. (1) through 2 in Introduction section, CSFs for the three viewing conditions
can be estimated by dividing ψ measured in Experiment 1 by the corresponding MTFs as
illustrated in Fig. 7. Data points for dark are linearly interpolated and represented by solid
lines and dashed lines for overcast and dotted lines for bright. As can be seen, they show
band-pass characteristics and the peak contrast sensitivity for dark is observed at 5 cpd but
it moves to 4 cpd for overcast and bright. The peak-shift appears more obvious compared to
Fig. 4. However, it is not quite easy to yield significance of the shift on the sampling
frequency of 1 cpd. A large amount of reduction in contrast sensitivity at middle frequency
area (4 < u <13) can be observed; however, little reduction in contrast sensitivity is found for
lower frequencies (u < 4). Because the MTF converges to zero at near the maximum spatial
frequency we sampled (68 cpd) so contrast sensitivity at 65 cpd is not investigated in the
current section due to the limited display resolution.
Dark
Overcast
Bright
1.0
0.9
0.8
CSF
0.7
0.6
0.5
0.4
0.3
0.2
0.1
0.0
0
5
10
15
20
25
Spatial Frequency (cycles per degree)
Fig. 7. Estimated CSF data points under 3 different surround luminance levels with linear
interpolation. The all three plots show band-pass characteristics and the peak spatial
frequency for dark is 5 cpd but moves to 4 cpd for overcast and bright. A large amount of
reduction in contrast sensitivity at middle frequency area (4 < u <13) can be observed;
however, little reduction in contrast sensitivity is found for lower frequencies (u < 4).
Figure 8 illustrates the ratio of the area covered by the three linearly interpolated plots
previously shown in Fig. 7. The area of a function or a filter correlates to the power of a
filtered image. Area of each plot is normalised at the magnitude of the area for dark viewing
condition. As can be seen, about 7 and 15 % of the loss in power was occurred under
overcast and bright, respectively due to the increase of surround luminance. The amount of
power loss caused by the reduction in contrast sensitivity can be analogous to that of
Michelson contrast reduction. As given in Table 1, Michelson contrast decrease reaches up
to approximately 10 and 18 % respectively for overcast and bright. It yields to the fact that
the amount of physical contrast reduction is larger than that of power loss in CSF. In order
191
Normalized Area (Power of Filtered)
Portable LCD Image Quality: Effects of Surround Luminance
1.0
0.9
0.8
0.7
0.6
0.5
Dark
Overcast
Bright
Surround Luminance
Fig. 8. Ratio of area of psi functions given in Figs. 4 (a) through (c). The area of a function or
a filter correlates to the power of a filtered image. As can be seen, about 15 and 23% of the
loss in power was occurred under overcast and bright, respectively due to the increase of
ambient illumination.
to statistically verify the surround luminance and spatial frequency effects on the shape in
CSF, two-way analysis of variance (ANOVA) was performed with surround luminance and
spatial frequency as independent variables and contrast sensitivity as the dependent
variable. Significant effects could be found for both surround luminance and spatial
frequency. Their P values were less than 0.0001. A value of P < 0.05 was considered to be
statistically significant in this study.
Generally, effect of surround luminance on the luminance CSF appears the same to that of
mean luminance as previously discussed in Fig. 1. Because CSF response correlates to the
filtered light in the ocular media, smaller CSF responses across the spatial frequency domain
result in less power of the filtered image; thus, less amount of light can be perceived by the
visual system. Therefore, the stimulus should appear darker under a higher surround
luminance which can be verified through another set of experiments. The subsequent
section discusses the results from Experiment 2.
2.3.5 Change in brightness caused by surround luminance
The mean perceived brightness magnitudes of the nine neutral colours for the 5 observers are
drawn in Fig. 9. The abscissa shows measured luminance of the neutral patches shown on an
LCD. The ordinate represents their corresponding perceived brightness magnitudes. The filled
circles indicate dark, empty circles for overcast and crosses for bright. Data points are linearly
interpolated. As can be seen, the all data points for overcast and bright are underneath data
points for dark which means that their perceived brightness is decreased in general, as the
ambient illumination and surround luminance increase in spite of the additional luminance
increase by viewing flare. Similar results of brightness reduction between the surround and
focal area can also be found in other works. (Wallach, 1948; Heinemann, 1955) Since brightness
estimates are known for their subject variability, the individual data are also illustrated along
with their mean for each viewing condition in Fig. 10. Filled circles show mean of the 5
observers and error bars show 95% confidential interval. As the all observations were accepted
by the three observer variability tests in Table 2, the all brightness estimates follow the same
trends. No particular outliers can be observed.
192
Features of Liquid Crystal Display Materials and Processes
Dark
Overcast
Bright
100
90
80
Brightness
70
60
50
40
30
20
10
0
0
20
40
60
80
100 120 140 160
2
Luminance (cd/m )
Fig. 9. Luminance vs. brightness under varied ambient illumination levels. The all data
points for overcast and bright are underneath data points for dark which means that their
perceived brightness is decreased in general, as the ambient illumination and surround
luminance increase in spite of the additional luminance increase by viewing flare.
Mean
Obs1
Obs2
Obs3
Obs4
Obs5
Brightness
80
Mean
Obs1
Obs2
Obs3
Obs4
Obs5
100
80
Brightness
100
60
40
20
60
40
20
0
0
0
20
40
60
80
100
120
140
0
20
2
40
60
80
100
120
140
160
2
Luminance (cd/m )
Luminance (cd/m )
(a) Dark
(b) Overcast
Mean
Obs1
Obs2
Obs3
Obs4
Obs5
100
Brightness
80
60
40
20
0
0
20
40
60
80
100
120
140
160
2
Luminance (cd/m )
(c) Bright
Fig. 10. Individual brightness estimates for (a) dark (b) overcast and (c) bright. Brightness
estimates are known for their subject variability but the all brightness estimates follow the
same trends. No particular outliers can be observed. Error bars show standard error.
The precise relation between perceived brightness and stimulus luminance has been
extensively studied using reflective colour samples. Traditionally, there are two most
Portable LCD Image Quality: Effects of Surround Luminance
193
frequently cited explanations. (Jameson & Hurvich, 1961) One of them is called law of retinal
stimulus. It is intuitively expected that, if the amount of light falling on a given stimulus is
increased, the intensity of the retinal light image could be increased and the HVS could
perceive its increased brightness. All of the stimuli should appear lighter with the aid of
increased luminance from ambient illumination. The other most frequently cited
explanation for the relation between perceived brightness and stimulus luminance is law of
brightness constancy (Wallach, 1948; Woodworth & Schlosberg, 1954; Jameson & Hurvich,
1959, 1961). This phenomenon is based on neural processing after light rays pass through
ocular media in the HVS. There are some examples that apparent brightness of visually
perceived objects is relatively constant in real world: white snow always appears bright but
black coal looks very dark regardless a range of illuminance. Specifically, although the coal
in the high illumination may actually reflect more intensity of light to the eye than does the
snow at the low illumination. According to this theory, the relative brightness between with
and without ambient illumination should be constant. However, our experimental results
showed reduction in perceived brightness under ambient illumination and neither of the
two traditional phenomena could predict this situation. One of the possible reasons for this
is that the lighter surround makes the focal area appears darker and this phenomenon is
referred to as simultaneous lightness contrast. (Palmer, 1999) The neural contrast
mechanism that makes the low-luminance areas appear darker in bright environments more
than compensates for the reduced physical contrast caused by intraocular scatter. (Stiehl et
al., 1983; Wetheimer & Liang, 1995)
2.4 Summary
This section examined the variation in shape of spatial luminance CSF under different
surround luminance levels and reduction in brightness of uniform neutral patches shown on a
computer controlled display screen is also assessed to explain change of CSF shape. In specific,
Experiment 1 was conducted to measure the compound results of contrast threshold
perception and physical contrast decrease of a display resulted from the increase of ambient
illumination. The former is found to be attributed by simultaneous lightness contrast (Palmer,
1999) between stimuli on a display and surround luminance so yields to cause the change in
CSF shape. The latter is usually decreased by the surface light reflections off the front of the
monitor screen referred to as viewing flare. Through a set of brightness magnitude estimations
in Experiment 2 the surround luminance effects on the CSF and brightness reduction
assumption could be justified. The viewing flare and display terms were successfully deducted
by using MTF. Consequently, a large amount of reduction in contrast sensitivity at middle
frequency area (4 < u <13) can be observed; however, little reduction in contrast sensitivity is
found for lower frequencies (u < 4). They show band-pass characteristics and the spatial
frequency where the maximum contrast sensitivity occurs moves from 5 to 4 cpd when
surround luminance increases from dark to overcast to bright. However, it is not quite easy to
yield significance of the shift on the sampling frequency of 1 cpd. Generally, effect of surround
luminance on the luminance CSF appears the same to that of mean luminance. Because CSF
response can correlate to the filtered light in the ocular media, smaller CSF responses across
the spatial frequency domain result in less power of the filtered image; thus, less amount of
light can be perceived by the visual system. Therefore, the stimulus should appear dimmer
under a higher surround luminance. The power loss in CSF reaches up to 7 and 15 %
respectively for overcast and bright. Analogously, the Michelson contrast decrease was 10 and
18 % for overcast and bright. It yields to the fact that the amount of physical contrast reduction
194
Features of Liquid Crystal Display Materials and Processes
is larger than that of power loss in CSF. The statistical significance of the surround luminance
and spatial frequency effects on the shape in CSF, two-way ANOVA was performed and
significant effects could be found for both parameters.
The results, which can be obtained from Experiments 1 and 2, are applicable to various
purposes. Since CSFs have been widely used for evaluating image quality by predicting the
perceptible differences between a pair of images (Barten, 1990; Daly, 1993; Zhang & Wandell,
1996; Wang & Bovik, 1996) surround luminance effects on CSF can be very useful for this
application. Furthermore, the results can also be applied to simulate the appearance of a scene
(Peli, 1996, 2001) and evaluate the visual performance of the eye. (Yoon & Williams, 2002)
3. Evaluating image quality
This section intends to quantify the effects of the surround luminance and noise of a given
stimulus on the shape of spatial luminance CSF and to propose an adaptive image quality
evaluation method. The proposed method extends a model called square-root integral
(SQRI). The non-linear behaviour of the human visual system was taken into account by
using CSF. This model can be defined as the square root integration of multiplication
between display modulation transfer function and CSF. The CSF term in the original SQRI
was replaced by the surround adaptive CSF quantified in this study and it is divided by the
Fourier transform of a given stimulus for compensating for the noise adaptation.
3.1 Backgrounds
3.1.1 Adaptation to spatial frequency of the stimulus
On spatial frequency adaptation, (Fairchild & Johnson, 2007) proposed adjusting twodimensional CSF based on the degree of a given image’s blurness. (Goldstein, 2007)
demonstrates spatial frequency adaptation effect as shown in Fig. 11. The left pair consists of
patterns having different spatial frequency. Spatial frequency of the upper pattern shows
lower than that of the lower pattern. However, the other pair on the right-handed side has
two patterns showing the identical spatial frequency. After staring at the bar on the left pair
of patterns for a while, the other pair on the right handed side appear to shift in spatial
frequency in directions opposite the adapting stimuli (the left pair).
More precisely, a half of the foveal area of the viewer is adapted to the lower frequency of
the upper pattern, while the other half of the foveal area is adapted to the higher frequency
of the lower pattern. After adapting to the spatial frequency of those stimuli, although the
two identical patterns were assessed, the upper right and lower right patterns should
appear to show higher and lower spatial frequencies, respectively. Consequently, the
adapted contrast sensitivity of the HVS can be related to the reciprocal of the adapting
stimulus’ spatial frequency as given by (Fairchild & Johnson, 2007)
CSFa u
CSF u
img u 1
(11)
where img(u) is Fourier transform of a given image.
3.1.2 Square-root integral
The SQRI method (Barten, 2006) can be defined as the square root integration of
multiplication between display MTF, i.e., MTF(u) and CSF, the reciprocal of contrast
threshold function Mt(u) as
Portable LCD Image Quality: Effects of Surround Luminance
SQRI
1 umax
ln 2 0
MTF(u) du
Mt ( u ) u
195
(12)
where umax is the maximum spatial frequency to be displayed.
Fig. 11. Demonstration of spatial frequency adaptation
3.2 Modelling the effects of surround luminance
The surround luminance effects on CSF are quantified in this section. In order to
compensate for the effects, a weighting function φ was multiplied to the adapting luminance
that is denoted as L in (Barten, 1990). Precisely, as previously mentioned in Background
section, brightness of a stimulus can be affected by surround luminance increase so a
function φ should be multiplied to L. For each surround, the following optimisation process
was carried out.
Step 1. A CSF curve is predicted using Barten’s model under a given surround condition.
The adapting luminance can be obtained by measuring the mean luminance between black
and white patches of the display.
Step 2. The predicted CSF curve is adjusted by changing the value of φ so that its maximum
contrast sensitivity value can match that of the measured CSF data in (Kim & Kim, 2010)
under the given surround condition. Note: in case the surround is dark, φ should equal to
one.
Consequently, the maximum contrast sensitivity value of the adjusted CSF curve for
overcast could match that of the measured CSF data points when φ equals to 0.534. In the
case of bright, φ is found to be 0.339. Table 3 lists the obtained optimum φ values for the
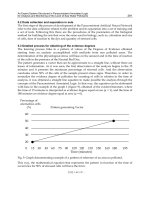
three surrounds along with their measured surround luminance levels. The relation
between φ against the corresponding surround luminance (LS) can be modelled by an
exponential decay fit as given in eq. (13) and also illustrated in Fig. 12. Its exponential
decaying shape appears similar to that of the image colour-quality model (Kim et al., 2007)
that predicts the overall colour-quality of an image under various outdoor surround
conditions. In addition, the change in “clearness,” which is one of the psychophysical image
quality attributes, caused by the illumination increase could also be modelled by an
exponential decay function as well. (Kim et al., 2008)
0.17 0.83 e 10
4
LS 0.18
(13)
196
Features of Liquid Crystal Display Materials and Processes
Measured Data
Exponential Decay Fit
1.0
0.9
0.8
0.7
0.6
0.5
0.4
0.3
0.2
0.1
0.0
0.0
0.1
0.2
0.3
0.4
0.5
0.6
0.7
2
0.8
4
Surround Luminance (cd/m ) / 10
Fig. 12. Relation between the surround luminance factor (φ) and the normalised surround
luminance (LS /104)
3.3 Proposed method: Adaptive SQRI
The proposed method - adaptive SQRI (SQRIa) - can be expressed as eq. (14). The Mt(u) in
the original SQRI (see eq. (12)) is replaced by Mta(u) which represents the inverse of the
adaptive CSF denoted as CSFa(u).
SQRI a
1 umax
ln 2 0
MTF(u) du
Mta (u) u
(14)
where u denotes the spatial frequency and 1/Mta(u) is
au exp( bu) (1 c exp(bu))
1
CSFa (u)
Mta (u)
( k img(u) 1)
The numerator of CSFa shows the surround luminance adaptive CSF; a, b, and c are
0.2
a
540 1 0.7 L
12
1
2
w 2 u 3
b 0.3 1 100 L
0.15
c 0.06
where the adapting luminance L is the mean luminance between white and black on the
display under a given surround luminance and φ is a weighting function for the surround
luminance effect as previously given in eq. (13).
As (Fairchild & Johnson, 2007) found the reciprocal relation between the adapted contrast
sensitivity of the HVS and the adapting stimulus’ spatial frequency, as shown in eq. (11),
CSFa is divided by Fourier transform of the given image. The denominator of the CSFa
shows amplitude of the Fourier transformed image information, img(u). A constant k is
multiplied to the magnitude of img(u) for normalisation as
Portable LCD Image Quality: Effects of Surround Luminance
k 10 4
1
max( img(u) )
197
(15)
Since the denominator of SQRIa is Fourier transform of a given image, the model prediction
can be proportional to the inverse of the image’s spatial frequency. In order to attenuate any
unwanted spatial frequency dependency of the image, the model prediction should be
normalised by that of a certain degraded image expressed as
nSQRI a
SQRI a Original
SQRI a Degraded
(16)
where nSQRIa denotes a normalised SQRIa prediction and SQRIa (Original) and SQRIa
(Degraded) respectively represent SQRIa predictions for a given original image and its
degraded version.
The degraded image can be defined as an image of which its pixel resolution is manipulated
to a considerably lower level, i.e., 80 pixels per inc. (ppi), while the original resolution was
200 ppi., and luminance of each pixel is reduced to 25 % of its original. The normalisation
method makes SQRIa to predict the quality score of a given image regardless the level of
adapting spatial frequency. Since the overall dynamic range of nSQRIa in eq. (16) may be
changed due to the normalisation process, it was re-scaled to a 9-category subjective scale
(Sun & Fairchild, 2004) using a least-square method for each surround luminance condition.
The rescaling process can be written as
J ' pJ q
(17)
where J’ represents a re-scaled 9-category value of J, i.e., nSQRIa of an image. The scaling
factors are denoted as p (slope) and q (offset) and the optimum scaling factors can be
determined through the subsequently discussed psychophysical test.
3.4 Subjective experimental setup
In total, five test images were selected for image quality evaluation in this study. They
contained sky, grass, water, facial skin (Caucasian, Black, and Oriental) and fruit scenes, as
shown in Fig 13. Those images were displayed on a 22.2-inc. Eizo ColorEdge221 LCD. The
maximum luminance producible is approximately 140 cd/m2 in a dark room and the black
level elevates up to 1 cd/m2 due to the inherent leakage light problem of typical LCDs. The
display was illuminated by using an EVL Lighting Colourchanger 250 light source in a
diagonal direction. More details about the experimental setting are described in the previous
section. The surround luminance and the viewing conditions are summarised in Table 1.
Each image was manipulated in terms of the three attributes, blurrness, brightness and
noisiness. For adjusting those attributes, resolution, luminance and noise level of the images
were controlled. Specifically, the five images were manipulated by changing their resolution
from 200 (original) to 80 ppi with steps of 40 ppi (original + 3 resolution degradations),
luminance from 100 (original) to 25% with steps of 25% (original + 3 luminance reductions)
and adding the Gaussian noise by changing the variance of the Gaussian function from 0
(original) to 0.006 with steps of 0.002 (original + 3 noise additions).
In total, for each test image, 64 images (4 resolution × 4 luminance × 4 noise) were produced
by the image rendition when simultaneous variations are included. However, the
198
Features of Liquid Crystal Display Materials and Processes
(a)
(b)
(c)
(d)
(e)
Fig. 13. Test images (a) Skytower, (b) Picnic, (c) Grass, (d) Ladies, and (e) Fruits
combinations between lower levels of the rendition-parameters resulted in considerably low
quality images, which can be rarely seen in real world so were excluded. Figure 14 shows
the sampled 22 images out of 64 in an image rendering cube. Each axis represents each of
the three rendered parameters: resolution, luminance and noise. The coordinates (0, 0, 0) is
the original image and larger numbers represent lower levels of each parameter.
4
3
2
1
4
3
2
1
1
Noise
2
3
4
Luminance
Resolution
Fig. 14. Sampled images
Among 110 images for 5 distinct test images, only 35 images were randomly selected and
used. Those selected images are listed in Table 4, where FR is for ‘Fruits’, GR for ‘Grass’, LD
for ‘Ladies’, PC for ‘Picnic’, SK for ‘Skytower’. The four rendition levels for each of the three
image parameters (Resolution; R, Luminance; L and Noise; N) are indicated as numbers
from 0 to 3, where 0 is the original. The images were processed by the proposed algorithm
for the three different surround levels: dark, overcast and bright. A panel of 9 observers
with normal colour vision (5 females and 4 males; 26~38 years old) were asked to judge the
quality of the rendered images on the mobile LCD from the distance of 25 centimetres
(accommodation limit), using a 9-point scale (1 to 9). This subjective image quality judgment
procedure was repeated under the three different surround conditions. Therefore, the total
number of psychophysical assessments can be 845 (35 images × 9 observers × 3 viewing
conditions). The collected subjective data were averaged for each image. This is a ITU-R
BT.500-11 method for analysing the category judgment data. (ITU-R, 2002)
199
Portable LCD Image Quality: Effects of Surround Luminance
FR
GR
R
L
N
FR1
0
0
3
FR2
0
1
FR3
0
1
FR4
0
FR5
0
FR6
LD
R
L
N
GR1
0
0
2
0
GR2
0
0
2
GR3
0
1
2
0
GR4
0
3
0
GR5
1
1
0
2
GR6
FR7
1
2
0
GR7
FR8
2
1
PC
R
L
N
LD1
0
1
0
3
LD2
0
1
1
LD3
0
2
3
0
LD4
1
1
0
LD5
1
1
2
0
LD6
2
0
3
0
0
SK
R
L
N
R
L
N
PC1
0
0
0
1
PC2
SK1
0
0
0
1
SK2
0
1
1
PC3
0
2
0
0
2
1
SK3
0
0
3
0
1
PC4
1
1
1
PC5
1
0
2
SK4
0
3
0
2
0
SK5
1
1
0
0
0
PC6
3
0
0
SK6
2
0
0
SK7
2
1
0
SK8
2
1
1
Table 4. The Randomly Selected Test Images
3.5 Results
3.5.1 Observer variation
The mean CV of the all observers participated in this experiment ranged from 20 to 39, and
the grand mean CV across the observers and the 5 test stimuli for dark surround condition
was 26, which is thought of as acceptable. (Note that CV value of 26 means 26% error of
individual from the arithmetic mean.) The mean observer accuracy was found to be 32 for
overcast and 30 for bright which are also within the acceptable CV boundary. The results
also indicate that there was not much variation in terms of CV values between different
experimental phases and image contents. One of the observers showed a relatively higher
CV (39) than the other observations, but its impact to the grand mean (29) was not large thus
was included for further analysis and modelling procedures.
3.5.2 Prediction accuracy of the proposed algorithm
Figure 15 presents box plots for comparing subjective image quality scores between the 3
surround conditions including dark, overcast and bright. Box is drawn between the lower
and upper quartiles and a line across each box represents the median. Whiskers are
extended to smallest and largest observations or 1.5 times length of box. In general, the
range of subjective data could be decreased as the surround luminance increases. For
example, MOS is 5.4 under dark, 4.7 under overcast and 3.5 under bright. It can be seen
from the box plots that MOS difference between the viewing conditions is significant.
Scaling factors in eq. (13) optimised for the three viewing conditions are listed in Table 5.
Magnitude of them is systematically changed from dark to overcast to bright and could be
modelled by an exponential decay fit of surround luminance (see eqs. (18) and (19)). The
predicted curves are compared with the computed scaling factors as illustrated in Fig 16.
4
LS /0.35
(18)
4
LS /0.29
(19)
p 1.16 2.36 e 10
q 0.35 5.38e 10
where LS is the surround luminance level.
200
Features of Liquid Crystal Display Materials and Processes
9
8
Subjective IQ
7
6
5
4
3
2
1
Dark
Overcast
Bright
Surround Condition
Fig. 15. Box plots for comparing subjective image quality scores between the 3 surround
conditions including dark, overcast and bright. Box is drawn between the lower and upper
quartiles and a line across each box represents the median. Whiskers are extended to
smallest and largest observations or 1.5 times length of box. In general, the range of
subjective data could be decreased as the surround luminance increases.
Dark
Overcast
Bright
Slope
3.93
2.69
1.47
Offset
-6.71
-2.89
-0.11
Table 5. Scaling factors (slope and offset) for the three viewing conditions
Measured Data Points
Exponential Decay Fit
3.5
Measured Data Points
Exponential Decay Fit
1
0
3.0
-1
p
2.5
q
-2
-3
2.0
-4
1.5
-5
0.0
0.1
0.2
0.3
0.4
0.5
0.6
Surround Luminance/10
(a)
0.7
4
0.8
0.0
0.1
0.2
0.3
0.4
0.5
0.6
Surround Luminance/10
0.7
0.8
4
(b)
Fig. 16. Scaling factors as a function of surround luminance (a) Slope p (b) Offset q
In Fig 17, the abscissa shows nSQRIa prediction values, which are re-scaled by the scaling
factors listed in Table 5, and the ordinate shows the corresponding MOS. (Note that a 45°
line is given for illustrating the data spread.) Different shaped symbols represent different
test images. For instance, the filled squares are for “Fruits (FR)”, circles for “Grass (GR)”,
triangles for “Ladies (LD)”, crosses for “Picnic (PC)” and diamonds for “Skytower (SK)”.
The model accuracy for the overall data sets can also be predicted by calculating a CV value
between the two axes and it was 15 which is smaller than the mean observer accuracy (29)
across the three surround conditions. Specifically, the CV between the two data sets was 18
for dark, 13 for overcast and 9 for bright and all are less than the corresponding mean
201
Portable LCD Image Quality: Effects of Surround Luminance
FR
GR
LD
PC
SK
9
8
7
MOS
6
5
4
3
2
1
1
2
3
4
5
6
7
8
9
nSQRIa
Fig. 17. Comparison between nSQRIa and their corresponding MOS across the three
surround conditions
observer accuracy. Note that the mean observer accuracy was 26 for dark, 32 for overcast
and 30 for bright. Consequently, no significant image dependency of the model prediction
was observed due to the spatial frequency normalisation procedure.
3.6 Summary
The current research intends to quantify the surround luminance effects on the shape of
spatial luminance CSF and to propose an image quality evaluation method that is adaptive
to both surround luminance and spatial frequency of a given stimulus. The proposed image
quality method extends to a model called SQRI. (Barten, 1990) The non-linear behaviour of
the HVS was taken into account by using CSF. This model can be defined as the square root
integration of multiplication between display MTF and CSF. It is assumed that image
quality can be determined by considering the MTF of the imaging system and the CSF of
human observers. The CSF term in the original SQRI model was replaced by the surround
adaptive CSF quantified in this study and it is divided by the Fourier transform of a given
stimulus. The former relies upon the surround factor function (φ) shown in eq. (13) and the
latter requires a normalization procedure. The model prediction for a certain image is
divided by that of its degraded image of which its pixel resolution is manipulated to be 80
ppi and luminance of each pixel is reduced to be 25% of its original. The model accuracy and
observer accuracy are comparable in terms of CV. The mean model accuracy is a CV value
of 15 and observer accuracy is 29. Consequently, the model accuracy outperformed the
observer accuracy and no significant image dependency could be observed for the model
performance.
A few limitations of the current work should be addressed and revised in the future study.
First, the model parameters should be revised for larger sized images. A 2-inch mobile LCD
is used to display images in this study so any image size effect on the model prediction
should be verified in the future work. Second, more accurate model predictions may be
achievable when the actual display MTF is measured and used instead of the approximation
shown in eq. (9). Last but not least, a further improvement to the model prediction accuracy
can be made when chromatic contrast loss of the HVS is taken into account.
4. Enhancing image quality
The loss in contrast discrimination ability of the human visual system was estimated under
a variety of ambient illumination levels first. Then it was modelled as a non-linear
202
Features of Liquid Crystal Display Materials and Processes
weighting function defined in spatial frequency domain to determine which of parts of the
image, whatever their spatial frequency, will appear under a given surround luminance
level. The weighting function was adopted as a filter for developing an image enhancement
algorithm adaptive to surround luminance. The algorithm aims to improve the image
contrast under various surround levels especially for small-sized mobile phone displays
through gain control of a 2D contrast sensitivity function.
4.1 Proposed surround luminance adaptive image enhancement
4.1.1 Contrast sensitivity reduction of the HVS
As shown in the earlier section, Fig. 12 illustrates the relation between surround luminance
level (cd/m2) and the surround effect function (φ). The shape of the function is similar to
that of the image colour-quality decay function (Kim et al., 2007) that predicts the overall
colour-quality of an image based upon measurable image-properties under various outdoor
surround conditions. In addition, the change in ‘clearness’ caused by the illumination
increase could also be modelled as an exponential decay function as well. (Kim et al., 2008)
CSFs for the three surrounds in total – dark (0 lx), overcast (6100 lx) and bright (32000 lx) –
are computed using eqs. 13 and 14 and also plotted in Fig. 18 while other variables such as
viewing distance and adapting luminance of a stimulus remain the same. The spatial
frequency where the maximum contrast sensitivity occurred was moved toward a lower
frequency from dark (4.4 cpd) to bright (3.8 cpd). As a result, the surround luminance
increase resulted in approximately 7 and 15% loss in contrast sensitivity of the human visual
system for overcast and bright, respectively. (Kim & Kim, 2010)
Dark
Overcast
Bright
1.0
Contrast Sensitivity
0.9
0.8
0.7
0.6
0.5
0.4
0.3
0.2
0.1
0.0
0
5
10
15
20
Spatial Frequency (cycles per degree)
Fig. 18. Comparison of CSFs under dark and ambient illuminations
In order to compensate for the loss in image contrast caused by surround luminance
increase and enhance the image quality, an adaptive enhancement gain control algorithm to
the surround luminance was developed using an adaptive weighting filter. This filter
correlates to the normalised contrast sensitivity difference between the reference (dark) and
a target surround luminance level. The contrast sensitivity difference, D(u,v), between the
reference (dark), CSFR(u,v), and a given target surround, CSFT(u,v), represents the loss in
image contrast caused by increase of the surround luminance which can be expressed as
D u , v CSFR u , v CSFT u , v
where u and v are frequency variables.
(20)
203
Portable LCD Image Quality: Effects of Surround Luminance
Since the image enhancement can be achieved, when an enhancement gain greater than 1 is
multiplied to the amplitude of a given image, the offset of these weighting filters should be
increased up to greater than 1 and a constant value of 1 was added to D(u,v). In addition, the
maximum value of D(u,v) is also added to the offset so the adaptive weighting filter can be
defined as
H u, v D u, v 1 C
(21)
where C = max(D(u,v)).
The maximum value of D(u,v) implies the change in brightness and the threshold level to be
enhanced under a given surround luminance level. Since various spatial frequency levels
are mixed in a complex image, the masking phenomenon (Wandell, 1995; Kim et al., 2007)
can occur and there might be some contrast loss detectable in unexpected frequencies. The
masking commonly occurs in multi-resolution representations and there are cases when two
spatial patterns S and S + ΔS cannot be discriminated, while ΔS seen alone, can be visible.
Therefore, all frequency regions should be enhanced globally by a certain level of
enhancement gain threshold and such significant regions should be enhanced with higher
weights. However, the enhancement threshold level was arbitrarily chosen as the maximum
value of D(u,v) in this study and more investigations are required in future study.
Figure 19 shows estimates of the adaptive weighting filter for the three surround levels:
dark, overcast and bright, when a field size was 5 degrees and the display’s adapting (mean)
luminance was 89.17 cd/m2. Since the loss in image contrast becomes larger, as the ambient
illumination increases, the weighting filter response for bright surround shows the highest
filter response and overcast surround follows. In case of dark surround, the amplitude of
original image can be preserved as being multiplied by an enhancement gain of 1 across the
all spatial frequencies. The enhancement threshold level is 0 for dark, 0.15 for overcast and
0.31 for bright. Since CSFs are known as smoothly varied band-pass filters, the enhancement
gain can also be smoothly changed. The adaptive image enhancement filter can be defined
as a weighting function to determine which of parts of the image, whatever their spatial
frequency, should have a higher enhancement gain.
Dark
Overcast
Bright
2.0
1.8
Filter Response
1.6
1.4
1.2
1.0
0.8
0.6
0.4
0.2
0.0
0
5 10 15 20 25 30 35 40 45 50 55 60 65
Spatial Frequency (cycles per degree)
Fig. 19. The adaptive weighting filter estimates
4.2 Results
Figure 20 presents a test image and their enhanced images for the two surround conditions
and their histograms of luminance of the composite channel (Luminosity). The input RGB
204
Features of Liquid Crystal Display Materials and Processes
(a) Original
(b) Overcast
(c) Bright
Fig. 20. Example of enhanced images and their luminosity histogram
values were converted into CIECAM02 (CIE, 2004) perceptual colour attributes such as Jab
and J was then transformed into the recently updated J’. (Luo et al., 2006) Only lightness J’
went into the enhancement procedure while chrominance properties a and b were
preserved. The horizontal axis of each histogram represents the intensity values, or levels,
from the darkest (0) at the far left to brightest (255) at the far right; the vertical axis
represents the number of pixels with a given value. Moreover, the statistical information
about the intensity values of the pixels appears below the histogram: mean, standard
deviation (Std Dev), median, the number of pixels in the image and so forth.
As can be seen in Fig. 20, tonal variance in those histograms yields quite spread and both
mean and standard deviation were increased as surround luminance increases. The mean
was 113.65 for original, 129.76 for overcast and 137.37 for bright. The standard deviation was
51.47 for original, 56.76 for overcast and 59.10 for bright. Consequently, the overcall
brightness and contrast of the image were increased. The resultant enhanced images may
appear overexposed especially for the enhanced one for bright. However, if those images are
seen with the surround luminance levels, they are supposed to show the similar degree of
205
Portable LCD Image Quality: Effects of Surround Luminance
image quality as the original seen under the reference (dark) viewing condition (as if
reduced appetite leads to stronger taste of food).
Figures 21 (a) through (b) illustrate the comparison between enhanced and original images
in terms of image quality scores judged by the nine observers. The abscissa represents
subjective image quality score of the original images under a certain surround condition and
the ordinate shows that of their enhanced images. For example, if most of the data points are
upper the 45-degree line (red line), the enhanced images were judged as higher image
quality. In general, majority of the data points were upper the 45-degree line for all of the
surround conditions and it can be said that the enhanced images are rated by higher
category values than their original images. When the proposed algorithm was applied for
overcast condition data set, 74% (26 out of 35 images) subjective values of the enhanced
images were higher than that of the original images (Fig. 21 (a)). In addition, its performance
was more or less the same as the original images judged under dark viewing condition. In
Fig. 7 (b), the images processed by the proposed algorithm for bright condition were
compared with their corresponding original images. As well as overcast, the proposed
algorithm produced better quality images than their original images seen under the same
condition, 85% (30 out of 35 images). Subjective image quality score of the enhanced images
was similar to that of original images judged under overcast surround condition. The 15%
reduction caused in image quality could be due to the impairment in chromatic channels.
Chromatic contrast should also be decreased under bright surrounds and the chromatic
contrast loss effects will be left for the future work.
9
8
8
Enhanced - Bright
Enhanced - Overcast
9
7
6
5
4
3
2
1
7
6
5
4
3
2
1
2
3
4
5
6
7
Original - Overcast
(a)
8
9
1
1
2
3
4
5
6
7
8
9
Original - Bright
(b)
Fig. 21. Comparison between the original and enhanced image for each surround condition
One of possible artefacts that can be caused by the proposed algorithm is out boundary
colours (OBC). Since a gain value larger than one is multiplied to a given image, some
colours may lie outside colour gamut of the display. Those colours can be referred to as
OBCs and more details can be found in Ref. 22. In this study, OBCs were clipped at the
maximum value (255). However, the OBC effect may be overwhelmed by the contrast and
brightness compensation so the artefact was not significantly perceptible during the
psychophysical evaluations.
4.3 Summary
In this section, an adaptive image enhancement algorithm was proposed and their
performance was observed through a set of subjective assessments. The contrast
206
Features of Liquid Crystal Display Materials and Processes
discrimination ability of human observers under ambient illumination was quantified as a
weighting function to determine which of parts of the image, whatever their spatial
frequency, will appear under a certain surround luminance level. The weighting function
was adopted as the image enhancement filter in spatial frequency domain. Most of the
enhanced images were rated as higher image quality scores than their original images
through a set of subjective validation experiment. The quality of images under bright
surround was enhanced up to that of images seen under overcast. Similarly, the quality of
images under overcast was reached that of image seen under dark. Further improvement of
image contrast can be achieved when chromatic contrast loss is compensated that could be
one of the afterthoughts.
5. Acknowledgment
This work is part of the author’s PhD thesis at University of Leeds in England. Currently, he
is with Samsung Electronics Company in Korea.
6. References
Arend, L. E. and Spehar, B. (1993). Lightness, brightness and brightness contrast: I.
Illumination variation. Perception & Psychophysics, Vol. 54, No. 4, (February 1933),
pp. 446-456, ISSN 0031-5117
Arend, L. E. and Spehar, B. (1993). Lightness, brightness and brightness contrast: II.
Reflectance variation. Perception & Psychophysics, Vol. 54, No. 4, (October 1993), pp.
457-468, ISSN 0031-5117
Barten , G. J. (1991). Resolution of liquid-crystal displays. SID Digest, ISSN 0003-966X
Barten, P. G. (1990). Evaluation of subjective image quality with the square-root integral
method. Journal of the Optical Society of America A, Vol. 7, No. 10, (October 1990), pp.
2024-2031, ISSN 1084-2529
Barten, P. G. J. (1999). Contrast Sensitivity of The Human Eye and Its Effects on Image Quality.
SPIE Press, ISBN 978-0819434968,Washington
Bartleson , J. (1984). Optical Radiation Measurements, Bartleson, C. J. & Grum, F. (Eds.),
Academic Press, ISBN 978-0123049049, NY
Blakeslee, B., Reetz, D. and McCourt, M. E. (2008). Comping to terms with lightness and
brightness: Effects of stimulus configuration and instructions on brightness and
lightness judgments. Journal of Vision, Vol. 8, No. 11, (August 2008), pp. 1-14, ISSN
1534-7362
Braddick, O., Campbell, F. W. and Atkinson , J., (1978). Channels in vision: basic aspects, In :
Handbook of Sensory Physiology, Held, R., Leibowitz H. W. and Teuber, H. –L. (Eds.),
Springer-Verlag, ISBN 0-387-05146-5, New York
Burton, K. B., Owsley, C. and Sloane, M. E. (1993). Aging and neural spatial contrast
sensitivity: photopic vision. Vision Research, Vol. 33, No. 7, (May 1993), pp. 939-946,
ISSN 0042-6989
Campbell, F. W. and Green, D. G. (1965). Optical and retinal factors affecting visual
resolution. Journal of Physiology, Vol. 181, No. 3 (December 1965), pp. 576-593, ISSN
0022-3751
Portable LCD Image Quality: Effects of Surround Luminance
207
Campbell, F.W. and Robson, J.G. (1968). Application of Fourier analysis to the visibility of
gratings. Journal of Physiology, Vol. 197, No. 3, (August 1968), pp. 551-566, ISSN
0022-3751
Choi , S.Y., Luo, M.R. and Pointer, M.R., (2007). The Influence of the relative luminance of
the surround on the perceived quality of an image on a large display, Proceedings of
15th Color Imaging Conference, ISBN 978-0-89208-294-0, Albuquerque, New Mexico,
November 2007
CIE Publication 15.2, Colorimetry, 2nd Ed., Commission Internationale de l’Eclairage,
Vienna, 1986.
CIE publication 159-2004, A colour appearance model for colour management systems:
CIECAM02, Vienna, 2004.
Cox, M. J., Norma, J. H. and Norman, P. (1999). The effect of surround luminance on
measurements of contrast sensitivity. Ophthalmic and Physiological Optics, Vol. 19,
No. 5, (September 1999), pp. 401-414, ISSN 0275-5408
Dacey, D. M. and Lee, B. B. (1994). The blue-on opponent pathway in the primate retina
originates from a distinct bistratified ganglion cell. Nature, Vol. 367, No. 6465,
(February 1994), pp. 731-735, ISSN 0028-0836
Daly, S. (1993). The Visible Differences Predictor: An Algorithm for the Assessment of Image
Fidelity, In: Digital Images and Human Vision, Watson A. B. (Ed.), MIT press, ISBN
978-0262231718, Cambridge, Massachusetts
DeValois, R.L., Morgan, H. and Snodderly, D.M. (1974). Psychophysical studies of monkey
vision – III. Spatial luminance contrast sensitivity tests of macaque and human
observers. Vision Research, Vol. 14, No. 1, (January 1974), pp. 75-81, ISSN 0042-6989
Enroth-Cugell, C. and Robson, J. G. (1966). The contrast sensitivity of retinal ganglion cells
of the cat. Journal of Physiology, Vol. 187, No. 3, (December 1966), pp. 517-552, ISSN
0022-3751
Fairchild, M. D. and Johnson, G. M. (2007). Measurement and modelling of adaptation to
noise in image. Journal of the Society for Information Display, Vol. 15, No. 9,
(September 2007), pp. 639-647, ISSN 1071-0922
Fairchild, M. D. and Reniff, L. (1995). Time-course of chromatic adaptation for colorappearance judgements. Journal of the Optical Society of America A Vol. 12, No. 5,
(May 1995), pp. 824–833, ISSN 1084-2529
Goldstein , E. B. (2007). Sensation and Perception, Thomson Wadsworth, ISBN 978-0-495-274797, CA
Graham, N. (1980) Spatial-frequency channels in human vision: detecting edges without
edge-detectors, In: Visual Coding and Adaptability, Harris, C. S. (Ed.), Erlbaum, ISBN
978098590166, Hillsdale, New Jersey
Heinemann, E. G. (1955). Simultaneous brightness induction as a function of inducing and
test-field luminances. Journal of Experimental Psychology, Vol. 50, No. 2, (August
1955), pp. 89-96, ISSN 0096-3445
Higgins, K. E., Jaffe, M. J., Caruso, R. C. and deMonasterio, F. (1988). Spatial contrast
sensitivity: effects of age, test-retest, and psychophysical method. Journal of the
Optical Society of America A, Vol. 5, No. 12, (December 1988), pp. 2173-2180, ISSN
1084-2529
ITU-R Rec. BT. 500-10, Methodology for the subjective assessment of the quality of television
pictures, Geneva, 2002.
208
Features of Liquid Crystal Display Materials and Processes
Jameson, D. and Hurvich, L. M. (1959). Perceived color and its dependence on focal,
surrounding, and preceding stimulus variables. Journal of the Optical Society of
America, Vol. 49, No. 9, (September 1959), pp. 890-898, ISSN 108-7529
Jameson, D. and Hurvich, L. M. (1961). Complexities of perceived brightness. Science, Vol.
133, No. 1, (January 1961), pp. 174-179, ISSN 1545-1003
Johnston, A. (1987). Spatial scaling of central and peripheral contrast-sensitivity functions.
Journal of the Optical Society of America A, Vol. 4, No. 8, (August 1987), pp. 1583-1593,
ISSN 1084-2529
Katoh, N., Nakabayashi, K., Ito, M., and Ohno, S. (1998). Effect of ambient light on the color
appearance of softcopy images: Mixed chromatic adaptation for self-luminous
displays. Journal of Electronic Imaging, Vol. 7, No. 4, (October 1998), pp. 794-806,
ISSN 1017-9909
Kim, Y. J. and Kim, H. (2010). Spatial luminance contrast sensitivity: Effects of surround.
Journal of the Optical Society of Korea, Vol. 14, No. 2, (April 2010), pp.152-162, ISSN
1226-4776
Kim, Y. J., Bang, Y. and Choh, H. (2010). Gradient approach to quantify the gradation
smoothness for output media. Journal of Electronic Imaging, Vol. 19, No. 1, (January
2010), pp. 011012, ISSN 1017-9909
Kim, Y. J., Bang, Y. and Choh, H. (2010). Measurement and modelling of vividness
perception and observer preference for color laser printer quality. Journal of Imaging
Science and Technology, Vol. 54, No. 1, (January 2010), pp. 010501, ISSN 1062-3701
Kim, Y. J., Luo, M. R., Choe, W., Kim, H.S., Park, S.O., Baek, Y, Rhodes, P., Lee, S. and Kim,
C. (2008). Factors Affecting the Psychophysical Image Quality Evaluation of Mobile
Phone Display: the Case of Transmissive LCD. Journal of the Optical Society of
America A, Vol. 25, No. 9, (September 2008), pp. 2215-2222, ISSN 1084-2529
Kim, Y. J., Luo, M. R., Rhodes, P, Westland, S., Choe, W., Lee, S., Lee, S., Kwak, Y., Park, D.
and Kim, C. (2007). Image-Colour Quality Modelling under Various Surround
Conditions for a 2-inch Mobile Transmissive LCD. Journal of the Society for
Information Display, Vol. 15, No. 9, (September 2007), pp. 691-698, ISSN 1071-0922
Kitaguchi, S., MacDonald, L., and Westland, S. (2006). Evaluating contrast sensitivity,
Proceedings of SPIE, Human vision and electronic imaging XI, ISBN 9780819460974,
Westlandm, Stephen, February 2006
Koenderink, J. J., Bouman, M. A., Bueno de Mesquita, A. E. and Slappendale, S. (1979).
Perimetry of contrast detection thresholds of moving spatial sine wave patterns,
Parts I-IV. Journal of the Optical Society of America, Vol. 68, No. 6, (June 1978), pp.
845-865, ISSN 108-7529
Lee, H. J., Choi, D. W., Lee, E., Kim, S. Y., M, Shin., Yang, S. A., Lee, S. B., Lee, H. Y. and
Berkeley, B. H. (2009). Image sticking methods for OLED TV applications,
Proceedings of International Meeting on Information Display, ISBN 1738-7558, Ilsan,
Korea, October 2009
Li, Z., Bhomik, A.K., and Bos, P.J. (2008). Introduction to Mobile Displays, In: Mobile Displays
Technology and Applications, Wiley, ISBN 978-0470723746, Chichester , UK
Liu C. & Fairchild M.D. (2004). Measuring the relationship between perceived image
contrast and surround illumination, Proceedings of IS&T/SID 12th Color Imaging
Conference, ISBN 978-0-89208-294-0, Scottsdale, Arizona, November 2004