báo cáo khoa học: " Impact of AtNHX1, a vacuolar Na+/H+ antiporter, upon gene expression during short- and long-term salt stress in Arabidopsis thaliana" doc
Bạn đang xem bản rút gọn của tài liệu. Xem và tải ngay bản đầy đủ của tài liệu tại đây (391.12 KB, 15 trang )
BioMed Central
Page 1 of 15
(page number not for citation purposes)
BMC Plant Biology
Open Access
Research article
Impact of AtNHX1, a vacuolar Na
+
/H
+
antiporter, upon gene
expression during short- and long-term salt stress in Arabidopsis
thaliana
Jordan B Sottosanto, Yehoshua Saranga and Eduardo Blumwald*
Address: Department of Plant Sciences, University of California, One Shields Ave, Davis, CA 95616, USA
Email: Jordan B Sottosanto - ; Yehoshua Saranga - ; Eduardo Blumwald* -
* Corresponding author
Abstract
Background: AtNHX1, the most abundant vacuolar Na
+
/H
+
antiporter in Arabidopsis thaliana,
mediates the transport of Na
+
and K
+
into the vacuole, influencing plant development and
contributing to salt tolerance. In this report, microarray expression profiles of wild type plants, a
T-DNA insertion knockout mutant of AtNHX1 (nhx1), and a 'rescued' line (NHX1::nhx1) were
exposed to both short (12 h and 48 h) and long (one and two weeks) durations of a non-lethal salt
stress to identify key gene transcripts associated with the salt response that are influenced by
AtNHX1.
Results: 147 transcripts showed both salt responsiveness and a significant influence of AtNHX1.
Fifty-seven of these genes showed an influence of the antiporter across all salt treatments, while
the remaining genes were influenced as a result of a particular duration of salt stress. Most (69%)
of the genes were up-regulated in the absence of AtNHX1, with the exception of transcripts
encoding proteins involved with metabolic and energy processes that were mostly down-regulated.
Conclusion: While part of the AtNHX1-influenced transcripts were unclassified, other transcripts
with known or putative roles showed the importance of AtNHX1 to key cellular processes that
were not necessarily limited to the salt stress response; namely calcium signaling, sulfur
metabolism, cell structure and cell growth, as well as vesicular trafficking and protein processing.
Only a small number of other salt-responsive membrane transporter transcripts appeared
significantly influenced by AtNHX1.
Background
The AtNHX1 gene encodes the most abundant vacuolar
Na
+
/H
+
antiporter in Arabidopsis thaliana, and mediates
the transport of both K
+
and Na
+
into the vacuole [1,2].
Constitutive over-expression of AtNHX1 and homologues
from other plants have been shown to confer significant
salt tolerance in a variety of plant species as a result of
increased vacuolar sequestration of sodium ions ([3], and
references therein). The importance of AtNHX1 to salt
stress tolerance was further demonstrated when T-DNA
insertional mutant nhx1 'knockout' plants lacking a func-
tional antiporter were shown to be more salt sensitive
than wild-type Arabidopsis [4]. Additionally, it was found
that nhx1 mutants exhibit an altered phenotype under
normal growth conditions, including smaller cells,
smaller leaves, and other developmental irregularities,
Published: 5 April 2007
BMC Plant Biology 2007, 7:18 doi:10.1186/1471-2229-7-18
Received: 12 August 2006
Accepted: 5 April 2007
This article is available from: />© 2007 Sottosanto et al; licensee BioMed Central Ltd.
This is an Open Access article distributed under the terms of the Creative Commons Attribution License ( />),
which permits unrestricted use, distribution, and reproduction in any medium, provided the original work is properly cited.
BMC Plant Biology 2007, 7:18 />Page 2 of 15
(page number not for citation purposes)
associated with altered K
+
homeostasis brought about by
the lack of AtNHX1. These results suggested that AtNHX1
is associated with other cellular processes that are not nec-
essarily related to salt tolerance. Subsequently, the
AtNHX1 coding region driven by the CaMV 35S promoter
was introduced into the nhx1 knockout line. These 'res-
cued' plants (NHX1::nhx1) displayed AtNHX1 activity,
and a phenotype similar to that of wild-type plants [4].
The transcriptional profile of the AtNHX1 'knockout'
(nhx1) line has been analyzed previously [5]. That study
examined the differences in transcript level using the
Affymetrix
®
23 k 'Full Genome' GeneChips
®
to look at the
differences of expression levels between wild-type and
nhx1 plants grown in the absence of salt stress, and also to
examine the difference in relative gene expression changes
that occurred after exposure to two weeks of salt stress. It
was found that there was little overlap between the two
comparisons suggesting that the role of the antiporter as
part of the salt stress response machinery is distinct from
its role under normal growing conditions. The previous
study [5] also suggested that AtNHX1 is important to the
expression of several cellular processes, including compo-
nents of cell structure, protein processing and trafficking,
and energy balance, although AtNHX1 did not appear to
dramatically affect the expression of many other trans-
porters.
This report further establishes and clarifies the influence
of AtNHX1 on gene expression, limiting the analysis to
only those transcripts that respond to salt stress, and
including an analysis of the influence of both shorter (12
h and 48 h) and longer (one week and two weeks) salt
stress treatments. Additionally we have employed an
NHX1::nhx1 'rescued' line to determine transcripts whose
expression levels correlate with the expression of AtNHX1.
This approach provides evidence of the influence of a sin-
gle gene on the expression of other genes while helping to
eliminate some of the non-specific effects that result from
the mutation of the antiporter.
Results and discussion
Plants have been shown to have a "dual response" to salt
stress, with an early response to the osmotic stress brought
about by the more negative water potential of a salty soil
solution, and a later response due to the Na
+
toxicity
resulting from the relatively slower entry of Na
+
ions into
the leaf tissues [6]. In an effort to include both compo-
nents of the salt-stress response, we studied the influence
of AtNHX1 on gene expression after 12 hours, 48 hours,
one week, and two weeks of salt stress. This work is an
extension of a previous microarray study that compared
wild-type and nhx1 "knockout" plants before and after 2
weeks of salt stress [5]. Here the added shorter salt stress
treatments (12 hours, 48 hours, and one week) and the
inclusion of the NHX1::nhx1 'rescued' line allowed for a
more detailed analysis of the importance of AtNHX1 to
the expression of salt responsive genes. Furthermore, the
greatly increased number of microarray chips used here
(increased from 14 to 48) allowed for the use of a more
robust ANOVA-based statistical analysis.
The NHX1::nhx1 plant line used in this study has an aver-
age increased expression of 50% of AtNHX1 as compared
to the wild-type. This level of expression were sufficient to
restore the wild-type phenotype [4], but was insufficient
to confer meaningful salt tolerance [1]. Also, because
AtNHX1 is normally expressed in all tissues and to a com-
parable level in all cells, with the exception of meristem-
atic cells lacking vacuoles [4,7,8], expression patterns
under a constitutive promoter should not differ dramati-
cally from expression under the native promoter. The
objective behind using this line was to identify transcripts
with expression directly affected by the presence or
absence of a functional AtNHX1.
Overview of salt-responsive transcripts influenced by
AtNHX1
Out of the 17,030 genes that exhibited reliable expression
data, 4,027 transcripts met the criteria of salt responsive-
ness, and 147 of these also showed a significant influence
by AtNHX1, as delineated in Materials and Methods. This
study focused on transcripts that showed a significant
influence by both salt and AtNHX1. Other transcripts also
influenced by AtNHX1 but not responding to the salt
treatments, or responding to salinity but without restored
levels of expression in the NHX1::nhx1 were not consid-
ered. The latter transcripts may yet be an important com-
ponent of AtNHX1-related processes, but due to inherent
variation in expression levels or the consequences of con-
stitutive AtNHX1 expression, they did not meet the neces-
sary significance criteria threshold to establish a clear
relationship to the presence of the antiporter. Even with
an increased statistical filtering, comparisons of more salt
treatments, and an analysis of salt responsive transcripts
based on absolute values rather than relative values, 42 of
the 147 (>28%) transcripts that showed a significant effect
of AtNHX1 in this report, were also previously shown to
have an influence of AtNHX1 on expression levels [5]
(comparison data not shown).
Among the 147 salt-responsive transcripts that were sig-
nificantly affected by AtNHX1, 102 genes (69%) were up
regulated while only 44 genes (31%) were down regulated
in the absence of AtNHX1, with one transcript
(At3g54810) showing increased expression after one week
of salt stress, but decreased expression after two weeks of
salt stress. The Genevestigator
®
database [9,10] was
searched and most (88%) of same transcripts were found
to have at least a 20% change in expression in response to
BMC Plant Biology 2007, 7:18 />Page 3 of 15
(page number not for citation purposes)
salt, drought, and/or osmotic stress, despite differing
stress and growing conditions.
Fifty-eight of these 147 genes showed an influence of the
antiporter across all salt treatments (significant effect only
of genotype; see examples in Figure 1A, B) with the other
89 transcripts showing differential expression due to the
presence of AtNHX1 under a specific salinity treatment
(genotype × treatment interaction). The latter 89 tran-
scripts were influenced by AtNHX1 typically only in one
treatment (three transcripts showed a specific influence of
two treatments), with fewer transcripts showing this pat-
tern under control conditions (12 transcripts; e.g. Fig. 1C,
D) or after the shortest salt treatment of 12 hours (15 tran-
scripts; e.g. Fig. 1E, F) as compared with longer exposure
to salinity (20–24 transcripts per treatment; e.g Fig. 1G–
L). The two-factor ANOVA used in this study to determine
the influence of AtNHX1 is considered a powerful tool for
the analysis of microarray experiments with multiple fac-
tors [11], as it utilized all 48 microarray data points to dis-
tinguish between an effect of genotypes across all
treatments (main effect) and a treatment-dependent effect
of lines (genotype × treatment interaction). In order to
focus on AtNHX1-influenced salt-responsive genes, a fur-
ther statistical test was used to identify transcripts with sig-
nificantly different expression levels in the nhx1 line
relative to both wild type and NHX1::nhx1 lines. While
AtNHX1 influenced the expression of 58 genes that were
not specific to a particular salt treatment, most salt-
responsive genes appeared significantly impacted in con-
junction with a particular length of salt stress, with more
genes influenced as the duration of stress was increased.
This pattern would suggest that AtNHX1 has greater
impact on the expression of other genes as the influence
of salt stress shifts from initial osmotic stress to the ion
stress [6].
Various databases were queried [12-14] to determine the
most likely functional role of the proteins encoded by the
147 salt-responsive transcripts showing an impact of
AtNHX1 on their expression levels. These transcripts were
then classified into general functional groups to assist
with the analysis. (Figure 2) The largest group of tran-
scripts showing the influence of the AtNHX1 vacuolar ant-
iporter was comprised of 58 genes (40%) with unclear
functional classifications (Additional file 1) Interestingly,
the percentage of unclassified transcripts was larger
among the up-regulated genes (46% of the total
increased) than among the down-regulated (26% of the
total decreased), suggesting that more novel salt-respon-
sive genes are increasing in the absence of functional
AtNHX1.
The remaining 89 transcripts encode proteins from a vari-
ety of functional groups. The majority of encoded proteins
included signaling elements, DNA binding elements,
components of the protein processing and trafficking
machinery, and enzymes involved with metabolic and
energy balance of the cell. Details of all salt-responsive
transcripts that also showed a significant influence of
AtNHX1 are presented in Table 1. Specific transcripts of
particular interest are discussed in the subsequent sections
of this report. The research community is encouraged to
explore the data for all transcripts that were found to have
meaningful expression levels [15].
AtNHX1 influences salt-responsive transcripts encoding
signaling elements, including several putative calcium-
binding proteins
Thirteen salt-responsive signaling-associated transcripts
were significantly influenced by the AtNHX1 antiporter
(Table 2A). Nine of these transcripts exhibited signifi-
cantly increased expression levels in the nhx1 line, while
the expression of 4 transcripts showed reduced expres-
sion. Six of the up-regulated transcripts showed a geno-
type × treatment interaction with a significant effect of
AtNHX1 being observed only after a week or more of salt
treatment, suggesting that cellular signaling was not
strongly impacted by AtNHX1 until the later stages of salt
stress. The only transcripts that displayed a general trend
of increased expression for all salt treatments were three
kinases. These included two receptor protein kinases
(At4g04540 and At5g56040) and a casein kinase II
(At5g67380) all with unknown roles, although a CK2
homolog, with unidentified targets, has been implicated
in the response of maize to ABA [16].
A notable feature of the signaling elements influenced by
AtNHX1 is the number of transcripts encoding calcium-
binding proteins, including 2 of the 9 transcripts that were
up-regulated (At5g66210 and At1g52570) and 3 of the 4
transcripts (At3g09960; At2g38750; At4g34150) down-
regulated in the nhx1 line. At5g66210 is a calcium-
dependent protein kinase with an undetermined role, that
is localized at the plasma membrane [17]. At1g52570 is a
phospholipase D, shown to have regulatory functions in
plant growth and development as well as the stress
response (reviewed in [18]). The signaling transcripts with
diminished expression in the nhx1 line included a mem-
ber of the annexin family, ANNEXIN4 (At2g38750/
AnnAt4). Annexins are Ca
2+
-dependent membrane-bind-
ing proteins found in most eukaryotic species, playing
roles in a wide variety of cellular processes. In Arabidopsis,
they have been implicated, though not necessarily limited
to, roles in Golgi-mediated secretion [19] which is also
one of their key roles in animal systems. Moreover,
AnnAt4, along with AnnAt1, have been shown to be
important in Ca
2+
-dependent signaling in response to
osmotic stress and to ABA [20]. The other calcium-bind-
ing signaling components with diminished expression in
BMC Plant Biology 2007, 7:18 />Page 4 of 15
(page number not for citation purposes)
Expression profiles of selected salt responsive transcripts showing a significant influence of the AtNHX1 cation/H
+
vacuolar antiporterFigure 1
Expression profiles of selected salt responsive transcripts showing a significant influence of the AtNHX1 cation/H
+
vacuolar
antiporter. Transcripts that were found to be influenced by AtNHX1: [A,B] regardless of specific salt treatment, or [C,D]
specifically under control conditions; [E,F] 12 h salt treatment; [G,H] 48 h treatment; [I,J] one week treatment; [K,L] two
weeks treatment. Green ᭜ = nhx1, Black ■ = wild-type, Red ▲ = NHX1::nhx1. Values are the Mean ± S.D. (n = 4 for control,
n = 3 for all other treatments).
At1g08730, myosin heavy chain
(PCR43) (XIC)
0
50
100
150
200
250
00.52 7 14
At5g19890, putative peroxidase
0
50
100
150
200
250
00.52 714
At4g30470, cinnamoyl-CoA
reductase-related
200
400
600
800
1000
00.52 7 14
At2g47440, DNAJ heat shock
N-terminal domain-containing
0
1000
2000
3000
4000
5000
00.52 714
At5g67380, casein kinase II
200
300
400
500
600
700
800
00.52 714
At3g09960, calcineurin-like
phosphoesterase family protein
0
50
100
150
200
00.52 7 14
At3g17970, putative chloroplast
translocon subunit
0
100
200
300
400
00.52 714
At2g20000, cell division cycle
family protein
0
100
200
300
400
500
00.52 7 14
A
t2g36960, myb family
transcription factor
100
200
300
400
500
600
00.52 7 14
At4g11600, putative glutathione
peroxidase (AtGPX6)
2000
4000
6000
8000
10000
00.52 714
At1g27630, cyclin family protein
400
500
600
700
800
900
1000
00.52 714
At4g25490, DRE-binding protein
(DREB1B)
0
200
400
600
800
1000
00.52 7 14
A
C
G
I
K
E
B
D
H
J
L
F
Microarray Signal Detection Intensity
Duration of Salt Stress (days)
BMC Plant Biology 2007, 7:18 />Page 5 of 15
(page number not for citation purposes)
the nhx1 line included At4g34150, a transcript encoding a
protein that is similar to calcium-dependent protein
kinases and contains a C2 domain (Ca
2+
-dependent
membrane-targeting module often associated with signal
transduction or membrane trafficking, [21]) and
At3g09960, a calcineurin-like phosphoesterase family
member [22].
The presence of several calcium binding elements pro-
vides further evidence of the influence of pH and ion
homeostasis on the calcium signaling network. Calcium
has been shown to be an important component of the
SOS (Salt Overly Sensitive) network, with a calcium-bind-
ing protein (SOS3) in conjunction with a kinase (SOS2),
influencing both the expression and activity of the SOS1/
AtNHX7, a plasma membrane Na
+
/H
+
exchanger that is
important to salt stress tolerance and cytosolic pH home-
ostasis [23] A previous microarray study has also shown
that Ca
2+
starvation induced decreased expression of
AtNHX1, AtNHX2 and AtNHX5 in Arabidopsis [24], fur-
ther suggesting a link between vacuolar cation/H
+
anti-
porters and calcium levels in the cell. Moreover, the C-
terminal portion of AtNHX1 itself has been shown to bind
a calmodulin-like protein, with activity and ion specificity
modified by the interaction, in a calcium- and pH-
dependent manner [3]. Our results provide further dem-
onstration of the influence of Ca
2+
on cellular ion and pH
homeostasis.
AtNHX1 influences the expression of DNA binding
elements including water deficit responsive transcripts
The expression of 20 salt-responsive transcripts encoding
DNA binding elements (mostly transcription factors) was
influenced by AtNHX1 (Table 2B). Similar to the trends
Functional assignments of transcripts influenced by AtNHX1Figure 2
Functional assignments of transcripts influenced by AtNHX1. Pie chart depicting the functional distribution of all 147 tran-
scripts showing a significant influence of the AtNHX1 cation/H
+
antiporter.
Metabolism/Energy
25
Membrane
Transport
4
DNA binding
21
Unclassified
58
Structure/Growth
13
Signaling
13
Processing
14
BMC Plant Biology 2007, 7:18 />Page 6 of 15
(page number not for citation purposes)
seen among the signaling elements discussed above, most
(80%) of the transcription factors exhibited increased
expression in nhx1 plants and the majority of the individ-
ual transcripts were influenced by a specific salt treatment.
Genes encoding DNA binding elements were affected by
AtNHX1 in response to both short and long terms of salt
exposure whereas signaling elements were predominately
influenced after longer treatments with salt. Several of
these genes have been shown to be associated with the
plant response to osmotic stress. At4g25490/CBF1 and
At1g21910, which displayed increased expression in the
nhx1 line are members of the DREB transcription factor
family shown to be involved in the response of plants to
different environmental stimuli by binding to dehydra-
tion-responsive element (DRE) promoter regions of
stress-inducible genes [25]. CBF1, also known as DREB1B,
has been shown to be involved in increasing tolerance to
low temperatures, and shows a response to ABA treatment
[26], and was also recently shown to be regulated by the
circadian clock [27]. Conversely, expression of
At4g27410/RD26 was reduced in the nhx1 plants. RD26 is
a drought- and salt-induced transcript belonging to the
NAC gene family, that is also part of an ABA-dependent
stress-signaling pathway [28]. The altered expression of
these transcripts highlights the impact of AtNHX1 on
known and predicted components of drought stress-
related pathways.
Another transcript with an established role in the environ-
mental stress response and influenced by the presence of
the AtNHX1 was a transcriptional co-activator,
At3g24500/AtMBF1c, that exhibited a 3–4 fold increase in
expression as a result of the nhx1 mutation with 12 hours
of salt stress. Over-expression of AtMBF1c in Arabidopsis
enhanced the tolerance of the plants to different stresses
(including osmotic), possibly due to perturbation of the
ethylene-response signal pathway [29]. Moreover, plants
over-expressing AtMBF1c demonstrated increased expres-
sion of several genes (At5g66210, At1g21910, At1g35140,
At4g08950, At1g28480, and At2g32150) [29] that were
also shown to be significantly influenced by AtNHX1 in
this study, suggesting a possible relationship between
altered ion homeostasis and stress-induced hormonal
responses.
A heat shock transcription family member (At2g26150/
AtHsfA2) showed a significant influence of AtNHX1 after
12 hours of salt stress. The altered level of expression of
this gene may reflect another aspect of the disrupted
response to stress in the nhx1 line. However it is also pos-
sible that this gene is part of the protein processing net-
work that is disrupted in the absence of AtNHX1 (see
following discussion).
Other AtNHX1-influenced transcripts encoding putative
DNA binding elements have not been associated with abi-
otic stress response previously. At3g56980/OBP3, which
increased in expression after 48 hours of salt treatment, is
a transcription factor shown to target genes that are induc-
ible by salicylic acid, and is important to normal plant
development [30]. At5g56860, a GATA-type zinc finger
family member also influenced by AtNHX1 in a salt-inde-
pendent manner, has been shown to be induced by
nitrate, and to be important to chlorophyll synthesis and
glucose sensitivity [31]. Another GATA-type zinc finger
family member (At3g54810/BME-ZF) was also influenced
by AtNHX1 significantly following at one week of salt
stress. Although the role of this transcript in adult plants
is not clear, BME-ZF has been shown to act as a regulator
of seed germination during cold stratification [32], which
may reflect a role in the response to environmental stim-
uli similar to other GATA-type genes.
Table 1: Functional distribution of the 147 gene transcripts influenced by both salinity and AtNHX1.
Gene classification # of transcripts influenced under each treatment
1
Distribution of decreased/increased transcripts in the
nhx1 mutant
2
All Control 12 h 48 h 1wk 2wk Down in nhx1 Up in nhx1
Unclassified 25 5 7 5 9 9 12 46
DNA binding 4 4 3 4 3 3 5 16
Membrane Transport 1 1 0 1 1 0 1 3
Metabolism/Energy 12 0 3 6 2 2 16 9
Structure/Growth 2 1 1 3 4 2 4 9
Signaling 6 0 0 1 4 2 4 9
Protein Processing 8 1 1 1 1 2 3 11
Total 58 12 15 21 24 20 45 103
1
three transcripts were specifically influenced by AtNHX1 under two treatments (At4g17120, At5g47490 – both unclassified, significantly affected
by Control and 12 h treatments – and At3g54810 – DNA binding, significantly affected by 1wk and 2wk treatments)
2
one transcript (At3g54810) was up-regulated in one treatment (1wk) and down regulated in a second treatment (2wk)
BMC Plant Biology 2007, 7:18 />Page 7 of 15
(page number not for citation purposes)
Table 2: Specific salt-responsive transcripts influenced by AtNHX1, organized by functional category
P(f)
a
Treatment
influenced by
AtNHX1
b
Transcripts intensity under the
influenced treatment
c
Accession Funtional Classes and Gene Descriptions L LxT nhx1
d
wild-type NHX1::nhx1
A. DNA binding elements
At3g53730 histone H4 ** Control 2511.1 3461.3 4184.2
At5g67580 myb family transcription factor * * Control 287.4 123.8 149.1
At5g35330 methyl-CpG-binding domain-containing protein *** *** Control 772.7 526.9 508.3
At1g14685 BASIC PENTACYSTEINE 2, BPC2 ** Control 555.1 370.5 390.9
At2g36960 myb family transcription factor *12 h298.0 368.5 476.0
At2g26150 heat shock transcription factor family protein * 12 h 684.1 98.8 181.5
At3g24500 Transcriptional Coactivator Multiprotein Bridging Factor 1c. * 12 h 1024.0 261.8 393.4
At1g69010 basic helix-loop-helix (bHLH) family protein ** ** 48 h 422.3 278.1 243.7
At3g56980 basic helix-loop-helix (bHLH) family protein * 48 h 503.2 304.3 130.8
At4g25490 DRE-binding protein (DREB1B)/CRT/CRE-binding factor 1 (CBF1) * 48 h 758.3 522.5 569.9
At1g69580 myb family transcription factor ** * 48 h 236.4 141.3 135.7
At3g54810 zinc finger (GATA type) family protein
e
** 1 wk 1168.0 571.7 340.6
At2g31730 putative ethylene-responsive protein * 1 wk 293.2 147.8 47.1
At1g21910 DREB A-5 subfamily member, ERF/AP2 transcription factor family * 1 wk 1871.5 771.5 598.6
At3g54810 zinc finger (GATA type) family protein
e
** 2 wk 473.7 967.6 803.4
At4g00850 GRF1-interacting factor 3 (GIF3), SSXT family protein ** 2 wk 366.7 273.8 86.5
At2g04240 zinc finger (C3HC4-type RING finger) family protein ** 2 wk 1018.2 539.9 360.6
At5g57660 zinc finger (B-box type) family protein *All1108.0 1585.0 1545.2
At4g27410 no apical meristem (NAM) family protein (RD26) *All402.0 971.3 870.1
At5g56860 zinc finger (GATA type) family protein *** All 244.5 157.7 125.6
At1g18710 myb family transcription factor (MYB47) ** All 257.3 460.3 467.0
B. Signaling Elements
At4g34150 C2 domain-containing, similar to calcium-dependent protein kinase *** ** 48 h 2199.5 4215.4 4558.0
At4g08960 phosphotyrosyl phosphatase activator (PTPA) family protein ** * 1 wk 542.6 377.1 279.9
At5g54380 protein kinase family protein ** 1 wk 1866.1 1250.7 826.4
At5g54840 GTP-binding family protein ** 1 wk 134.1 60.7 57.2
At5g66210 calcium-dependent protein kinase family protein (CPK28) ** 1 wk 367.5 221.8 213.5
At1g52570 phospholipase D alpha 2 (PLD2)/choline phosphatase 2 * 2 wk 229.2 99.4 74.5
At2g24160 pseudogene, leucine rich repeat protein family * 2 wk 349.8 160.4 71.7
At2g38750 annexin 4 (ANN4) *** All 511.2 875.1 804.2
At3g09960 calcineurin-like phosphoesterase family protein *All59.2 98.7 104.2
At4g21370 putative S-locus protein kinase, pseudogene *All63.0 102.8 110.1
At4g04540 protein kinase family protein///protein kinase family protein ** All 412.6 289.1 220.3
At5g56040 leucine-rich repeat protein kinase, putative ** All 930.9 748.2 617.4
At5g67380 casein kinase II alpha chain 1 *** All 637.3 496.1 488.6
C. Metabolism/Energy Components
At4g11600 putative glutathione peroxidase (AtGPX6) ** * 12 h 3636.1 5433.9 4962.7
At1g68290 bifunctional nuclease, putative *** * 12 h 105.1 236.2 244.6
At3g16050 putative pyridoxine (Vitamin B6) biosynthesis protein * 12 h 403.6 121.1 227.3
At4g32360 NADP adrenodoxin-like ferredoxin reductase *48 h102.5 172.0 203.7
At2g26560 putative patatin (PLP2) *** ** 48 h 1647.2 3298.0 3515.3
At1g56430 putative nicotianamine synthase * 48 h 995.2 433.8 601.6
At3g03520 phosphoesterase family protein ** * 48 h 208.4 125.2 122.2
At5g05960 protease inhibitor/seed storage/lipid transfer protein (LTP) family protein * 48 h 754.4 423.3 436.3
At3g63440 FAD-binding domain-containing protein/cytokinin oxidase family protein ** 48 h 224.6 132.2 48.8
At4g04955 amidohydrolase family protein *1 wk204.2 296.5 465.4
At1g63710 cytochrome P450, putative ** 1 wk 126.9 67.9 25.9
At2g17570 undecaprenyl pyrophosphate synthetase family protein ** 2 wk 112.5 206.2 310.0
BMC Plant Biology 2007, 7:18 />Page 8 of 15
(page number not for citation purposes)
At5g19890 putative peroxidase * ** 2 wk 212.8 99.3 79.7
At1g28480 glutaredoxin family protein *** All 349.1 696.8 1131.5
At2g46650 cytochrome b5, putative ** All 1075.4 1748.2 1638.4
At5g17220 glutathione S-transferase (AtGSTF12, TT19) *All270.8 402.7 422.1
At4g39940 adenylylsulfate kinase 2 (AKN2) ** All 1940.2 2675.4 2748.4
At4g04610 5'-adenylylsulfate reductase (APR1)/PAPS reductase homolog (PRH19) *All507.7 1362.0 1284.4
At3g22740 homocysteine S-methyltransferase 3 (HMT-3) *** All 622.8 928.0 1155.4
At1g21440 mutase family protein ** All 2176.8 2737.5 2793.7
At1g06520 phospholipid/glycerol acyltransferase family protein ** All 69.9 120.1 126.8
At1g16410 cytochrome P450 family protein (CYP79F1) (bushy1) *** All 280.2 480.4 492.0
At2g32150 haloacid dehalogenase-like hydrolase family protein *** All 357.9 720.0 857.9
At5g47240 MutT/nudix family protein *** All 961.5 1939.5 1471.4
At2g06050 12-oxophytodienoate reductase (OPR3)/delayed dehiscence1 (DDE1) ** All 804.0 1315.1 1454.0
D. Structure/Growth Components
At2g20000 cell division cycle family protein/CDC family protein * Control 429.7 274.3 260.2
At2g40610 expansin, putative (EXP8) * * 12 hours 792.4 462.8 381.2
At1g27630 cyclin family protein ** 48 h 519.1 744.7 913.9
At3g02350 glycosyl transferase family 8 protein * * 48 h 1160.2 947.2 609.2
At1g19170 glycoside hydrolase family 28/polygalacturonase (pectinase) family * * 48 h 365.0 220.3 177.9
At3g45970 expansin family protein (EXPL1/AtEXLA1) * 1 wk 3701.0 1684.2 1026.0
At3g62720 galactosyl transferase GMA12/MNN10 family protein ** 1 wk 2237.1 1459.9 790.3
At5g57560 cell wall-modifying enzyme, endo-xyloglucan transferase (TCH4) ** 1 wk 13493.
5
6314.8 6047.0
At4g30470 cinnamoyl-CoA reductase-related * 1 wk 756.6 478.9 512.6
At1g57590 putative pectinacetylesterase ** 2 wk 143.8 381.3 336.7
At1g16340 putative 3-deoxy-D-manno-2-octulosonate-8-phosphate synthase * 2 wk 352.0 231.3 48.7
At4g16590 glucosyltransferase-related *All194.5 578.7 602.4
At1g24070 glycosyl transferase family 2 protein (AtCSLA10) ** All 280.2 509.7 495.6
E. Protein Processing
At3g17970 chloroplast outer membrane translocon subunit, putative * Control 252.5 115.4 162.0
At2g20560 DNAJ heat shock family protein * 12 h 413.3 159.6 155.0
At1g08780 prefoldin, putative * 48 h 476.4 303.2 182.0
At2g47440 DNAJ heat shock N-terminal domain-containing protein ** 1 wk 3769.5 2247.3 1271.8
At1g08730 myosin heavy chain (PCR43) (XIC) *** *** 2 wk 25.4 147.4 204.6
At5g58810 subtilisin-like serine protease, similar to prepro-cucumisin *** ** 2 wk 24.0 148.8 201.3
At5g59730 exocyst subunit EXO70 family protein *All768.8 1096.8 1199.6
At3g25150 nuclear transport factor 2 (NTF2) family protein *** All 693.3 527.6 439.1
At5g64760 26S proteasome regulatory subunit, putative (RPN5) ** All 419.3 340.3 316.2
At1g22740 Ras-related protein (RAB7)/AtRab75/small GTP-binding *** All 1324.9 892.1 703.5
At2g22040 transducin family protein/WD-40 repeat family protein *** All 362.1 283.2 231.5
At5g47820 kinesin-like protein (FRA1) ** All 389.3 303.8 259.8
At4g34980 subtilase family protein (SLP2) ** All 1133.4 899.5 930.4
At3g23670 phragmoplast-associated kinesin-related protein, putative ** All 138.2 101.9 75.6
F. Membrane Transport
At2g23980 cyclic nucleotide-regulated ion channel (CNGC6) * * Control 393.3 259.6 180.7
At2g47830 cation efflux family/metal tolerance (MTPc1) ** 48 h 73.9 149.7 166.0
At1g31470 nodulin-related * 1 wk 223.1 148.5 110.3
At2g25520 phosphate translocator-related ** All 999.7 790.3 773.9
a
*, ** and *** indicate significant F values for the plant line effect and line × treatment interaction at the 0.05, 0.01 and 0.001 levels, respectively. An additional 58 salt-
responsive AtNHX1 influenced transcripts with unclear functional assignment are not presented and can be found in Additional File
1
b
the specific treatment influenced by AtNHX1 for cases of significant interaction, or 'All' for cases where only the plant line effect was significant.
c
transcript intensity of the three plant lines for the treatment of interest, with the average expression value of all treatments used when only plant line effect was significant.
d
transcript intensity of the nhx1 line is in bold font for cases where the expression level is higher compared to the other lines, normal font signifies reduced expression.
e
At3g54810 is represented twice because it showed a significant influence of AtNHX1 at both one week and two weeks of salt treatment, with alternate relative levels of
expression of the nhx1 line
Table 2: Specific salt-responsive transcripts influenced by AtNHX1, organized by functional category (Continued)
BMC Plant Biology 2007, 7:18 />Page 9 of 15
(page number not for citation purposes)
The nhx1 plants have been shown to have altered leaf
development, in addition to increased salt sensitivity [4],
and the expression of several transcription factors associ-
ated with leaf morphology and development were influ-
enced by AtNHX1. While most developmental genes are
expected to be independent of salinity effect, two genes
were significantly influenced by AtNHX1 under specific
salt treatments. The expression of At2g36960, encoding
the TOUSLED gene, was decreased in the nhx1 line after
12 hours of salt stress. TOUSLED interacts with chromatin
regulators and its expression normally increases in divid-
ing cells [33]. In addition, At4g00850/AtGIF, involved in
leaf growth and morphology [34] showed a significant
effect of AtNHX1 after two weeks of salt stress. Possibly,
these factors contribute to the altered gene expression that
is associated with the nhx1 phenotype [4].
AtNHX1 is associated with sulfur metabolism
Of the 89 AtNHX1-influenced transcripts with an assigned
or putative function, 25 transcripts, found on Table 2C,
encode genes with metabolism or energy functions not
directly associated with cell structure or cell growth (dis-
cussed in the next section). The majority of these tran-
scripts had significantly lowered expression in the nhx1
line, in contrast to the overall patterns of genes showing
mostly increased expression in the absence of AtNHX1.
This pattern would suggest an overall decrease of metabo-
lism- and energy processes-related genes in the knockout
plants.
Twelve of the 18 metabolism/energy-related transcripts
down-regulated in the nhx1 plants were generally
decreased in the nhx1 line over all treatments. On the
other hand, the transcripts with increased expression in
nhx1 plants were responsive to particular lengths of salt
stress. These results indicated that, though in general gene
expression was enhanced in the nhx1 line to compensate
for altered ion homeostasis, metabolic and energy proc-
esses were compromised in the absence of AtNHX1.
At least 5 of the 12 transcripts with diminished expression
over all salt treatments in the nhx1 line appeared to be
associated with sulfur/sulfate metabolism pathways.
Transcripts encoding adenosine-5'-phosphosulfate-kinase
(At4g39940/AKN2), a 5'-adenylylsulfate reductase/PAPS
reductase homolog (At4g04610/APR1/PRH19), and a
homocysteine methyltransferase (At3g22740/HMT3)
have well established roles in sulfur metabolism [35]. The
diminished expression of these transcripts would suggest
a decrease in the synthesis of both glucosinolates and
methionine within the leaves of the nhx1 plants. Other
sulfur-related transcripts were also diminished over all
treatments in the nhx1 line, encoding a glutathione S-
transferase (At5g17220/AtGSTF12) a putative glutare-
doxin (At1g28480), and CYP79F1 (At1g16410) a protein
that mediates the formation of glucosinolates that are
derived from methionine [36]. Additionally, a glutath-
ione peroxidase (At4g11600/AtGPX6), which is known be
regulated by abiotic stress [37], was down-regulated in the
nhx1 line specifically with 12 hours of salinity stress.
There are several other down-regulated transcripts that are
also likely to play a role in sulfur assimilation pathways.
OPR3 (At2g06050) catalyzes the middle step in jasmonic
acid biosynthesis, has been associated with the plant
response to environmental stresses, and influence the sul-
fur metabolic pathway [38]. These results highlight a link
between S-assimilation/metabolism and the expression
levels of the AtNHX1 antiporter, as also suggested by a
study using transgenic Brassica plants overexpressing
AtNHX1 [39].
AtNHX1 influences cell wall metabolism and components
of cell growth
Thirteen salt-responsive, AtNHX1-influenced transcripts,
were associated with cell wall metabolism and cell growth
(Table 2D). Nine of these exhibited increased expression
in the nhx1 plants, mostly after exposure to salt stress of
two days or longer. The up-regulated cell wall-associated
genes included At5g57560/TCH4 – encoding an endo-
xyloglucan transferase that has been shown to be rapidly
up-regulated in response to many environmental and hor-
monal stimuli [40], a galactosyltransferase (At3g62720), a
galacturonosyltransferase (At3g02350), a polygalacturo-
nase family member (At1g19170), a putative cinnamoyl-
CoA reductase (At4g30470), and a 3-deoxy-D-manno-
octulosonate 8-phosphate synthase (At1g16340). Tran-
scripts encoding proteins with cell-wall associations also
had diminished expression in the nhx1 line, including two
cellulose synthase-like genes (At4g16590 and At1g24070)
that were diminished with all treatments, and a pecti-
nacetylesterase (At1g57590) transcript that was dimin-
ished after two weeks of salt stress.
The altered expression of the above-mentioned transcripts
associated with cell size and structure, in addition to some
of the transcription factors mentioned earlier, are likely to
be involved in the altered developmental phenotype of
the nhx1 line, showing smaller cells, smaller leaves and
diminished growth [4]. There are also four salt responsive
transcripts displaying altered expression levels in the
absence of the AtNHX1 that are part of cell expansion and
growth. Under control conditions a cell division gene
(At2g20000/HBT) has increased expression in the nhx1
line whereas with 48 hours of salt stress a cyclin family
protein (At1g27630) shows decreased expression. Two
putative expansins also show increased nhx1 expression
levels (At2g40610/AtExpA8 and At3g45970/AtExlA1) at
12 hours and one week of salt stress, respectively. Intrac-
ellular ion and pH homeostasis is important to the regu-
BMC Plant Biology 2007, 7:18 />Page 10 of 15
(page number not for citation purposes)
lation of cell volume and cell cycle progression [41,42],
and in mammalian systems, calcium-regulated sodium/
proton exchange activity has been implicated in carcino-
genesis and proliferation [43,44]. The diminished cell size
of plants lacking AtNHX1 [5] can be a consequence of the
roles played by AtNHX1 in ion and pH homeostasis, and
the influence of the antiporter on calcium signaling and
vesicular trafficking processes (discussed below). Whether
the absence of functional AtNHX1 can change the rate of
cell proliferation remains to be demonstrated.
AtNHX1 influence the expression of protein processing
and trafficking components in response to salt stress
Fourteen of the AtNHX1-influenced salt-responsive genes
appeared to play roles in the processing and trafficking of
other cellular components and proteins (Table 2E). Nhx1,
the yeast orthologue of AtNHX1, has been shown to play
an important role in protein trafficking in yeast [45,46],
and the regulation of endosomal pH by Nhx1 controls the
vesicle trafficking out of the endosome [47].
Eleven of the salt-responsive protein processing/traffick-
ing components had increased expression due to the
absence of AtNHX1, with seven of these transcripts not
specific to a particular salt stress treatment, suggesting an
influence of AtNHX1 over the entire range of the studied
stress treatments.
The impact of AtNHX1 on vesicular trafficking is reflected
by the altered expression of At1g22740, encoding RAB7, a
small GTP-binding Ras-related protein, in the nhx1 line.
Rab GTPases are part of the organization of intracellular
membrane trafficking, including vesicle formation, vesicle
motility, and vesicle tethering [48], and Rab7-related
genes are important for the regulation of the late steps of
endocytotic pathway. The overexpression of a Rab7
homolog stimulated endocytosis and conferred tolerance
to salinity and oxidative stress in Arabidopsis [49,50]. Also
a rice homologue of this gene was differentially regulated
by both ABA and salinity and was implicated in vesicular
traffic to the vacuole [51].
The altered expression pattern of an exocyst subunit
EXO70 family protein (At5g59730) may be a further indi-
cation of the role of AtNHX1 in vesicular trafficking.
Though not yet fully characterized in higher organisms,
the EXO70 family members are important to vesicle dock-
ing and membrane fusion as well as regulation of actin
polarity and transport of exocytic vesicles in yeast [52,53].
Also two kinesin-related transcripts (At5g47820 and
At3g23670) showed an altered expression pattern. Kines-
ins are key to the intracellular transport system ([54] and
references therein).
Four salt-responsive transcripts with roles in protein
processing that are influenced by AtNHX1, emphasize the
role of ion homeostasis on the proper folding and func-
tion of other proteins. These include two DnaJ-type genes
(At2g20560 and At2g47440), a prefoldin (At1g08780),
and a transducin/WD-40 repeat containing gene
(At2g22040). The altered expression of these genes would
suggest that the absence of AtNHX1 induces the instability
of other proteins. Also, the altered expression of subtilases
(At5g58810 and At4g34980) and a 26S proteasome regu-
latory subunit (RPN5/At5g64760) suggest a possible
influence on protein degradation pathways.
A salt-responsive myosin XI subunit was also influenced
by AtNHX1 (PCR43/XIC/At1g08730). Myosin XI mutants
have been shown to be defective in both organelle move-
ment and polar auxin transport [55] through the action
on several vesicle-mediated processes. The altered expres-
sion of both a nuclear transport factor (NTF2/At3g25150)
and a chloroplast outer membrane translocon subunit
(At3g17970) would suggest a potential influence of
AtNHX1 on trafficking of cellular components to
organelles. Additionally, AtNHX1-influenced transcripts
in other functional categories may also be related to a role
of the antiporter as part of vesicular trafficking. For exam-
ple, At2g17570, encoding a member of the undecaprenyl
pyrophosphate synthetase family (Table 2C – Metabo-
lism) is homologous to the yeast gene RER2, was shown
to be important to vesicular processes and organelle integ-
rity [56].
Most salt-responsive transporters genes are not
significantly influenced by AtNHX1
The Arabidopsis NHX family is comprised of 6 endomem-
brane (AtNHX1-6) and 2 plasma membrane-bound
(AtNHX7/SOS1 and AtNHX8) members and in the
absence of AtNHX1, compensation by the other AtNHX
members might be expected, in particular when the plants
are exposed to salt stress. However, our data did not show
significant changes in the expression of any of the
AtNHX2-8 transcripts either in nhx1 or NHX1::nhx1 plants
in response to salt. Additionally, though the differences of
AtNHX1 signal detection were at 27% and 160% of wild-
type levels (p < 0.0001) for the nhx1 and NHX1::nhx1
lines, respectively, the other transporter genes did not
show a significant difference of expression levels between
lines regardless of the salt treatment used (data not
shown).
A few salt-responsive transporters did show an apparent
affect of AtNHX1 on expression levels (Table 2F). A puta-
tive phosphate transporter (At2g25520) showed an over-
all increased level of expression in the nhx1 plants,
possibly as a result of an imbalance of phosphate ions as
proton efflux from the vacuole is changed in the nhx1 line.
BMC Plant Biology 2007, 7:18 />Page 11 of 15
(page number not for citation purposes)
A cyclic nucleotide-regulated ion channel (At2g23980/
CNGC6) also showed increased expression in the nhx1
line. CNGCs comprise a family of 20 members in Arabi-
dopsis, activated by direct binding of cyclic nucleotides
and regulated by CaM [57]. They can provide a significant
pathway for the non-selective uptake of ions (Na
+
, K
+
or
Ca
2+
) and several family members were up-regulated or
down-regulated by salt stress [58]. Since an increase in cel-
lular cGMP was shown to occur during salt and osmotic
stress [59], and the expression of AtCNGC6 was shown to
be up-regulated in plants exposed to cGMP [60], it could
be hypothesized that the overexpression of AtCNGC6 is
related to the Na
+
-induced K
+
deficiency. Lastly, the
expression of a nodulin-related gene (At1g31470) was
increased in the nhx1 line with one week of salt stress, and
the expression a cation efflux/metal tolerance family gene
(At2g47830) was decreased with 48 hours of salt stress.
The role of these putative transporters has yet to be eluci-
dated.
Little is known about the influence of AtNHX1 on the
expression/activity of other transporters within the plant
cell. Previous work showed that AtNHX1 influenced the
expression of a few genes encoding putative transporters
[5]. However, as noted by Gong, et al. [61], previous
microarray studies of salt stress in Arabidopsis (eg. [62,63])
did not demonstrate significantly altered expression of
transporters, such as AtNHX1 or SOS1, which are known
to contribute to ion homeostasis and salt tolerance [1,64].
Furthermore, a wide survey of available Arabidopsis micro-
array data suggested that only approximately 40 tran-
scripts encoding putative cation transporters showed a
significant response to salt or drought stress, with less
than a 10% overlap between studies [58]. This emphasizes
the influence of the experimental design on the expression
profiles, suggesting a high level of inherent variability.
Several factors might interfere with the detection of tran-
scriptional changes in the genes encoding these transport-
ers during salt stress, such as relatively low levels of
expression or post-translational mechanisms that can
modify the transporters affinity, selectivity, and/or its
kinetics without affecting transcript expression [3,65].
Conclusion
A unique feature of this study is the utilization of both an
nhx1 'knockout' line and a 'rescued' mutant line
(NHX1::nhx1) to identify transcripts with expression
changes directly related to the presence of a single gene,
AtNHX1. A previous study of the influence of AtNHX1 [5]
on gene expression, was limited to only the nhx1 line in
comparison to wild-type before and after the exposure of
the plants to long-term (two weeks) salt stress. This work
is a logical extension of the findings from the previous
publication, because it provides novel aspects of the influ-
ence of the antiporter, especially as part of the salt stress
response. We have provided evidence that AtNHX1 has a
larger effect on salt responsive transcripts with increased
salt stress duration rather than during the early exposure,
emphasizing the increased importance of the antiporter
during the later ionic effects of salt stress. Nonetheless the
detection of AtNHX1-influenced salt-responsive tran-
scripts during the earlier salt stress treatments, and the
presence of 57 transcripts that appeared influenced
regardless of any particular stress treatment, also high-
lights the role(s) of AtNHX1 throughout salt stress expo-
sure. The use of short- and long-terms of sub-lethal levels
of salt stress, together with the NHX1::nhx1 line, facili-
tated the elucidation of adaptive responses that are influ-
enced by the vacuolar antiporter.
In line with its importance to salt stress tolerance, our
results demonstrate that AtNHX1 influenced transcripts
with known roles in the response to water deficit stress.
We have additionally provided further evidence that
AtNHX1 impacts the expression of other components of
the response of Arabidopsis to stress. Recently, it has been
shown that AtNHX1 activity can be modulated by calcium
levels within the cell [3], and our results demonstrated
that several Ca
2+
-binding elements were also affected tran-
scriptionally by the presence of the antiporter protein.
Furthermore, in addition to many uncharacterized tran-
scripts, AtNHX1 also showed an impact on the transcrip-
tion of several other key cellular processes including:
sulfur metabolism, vesicular trafficking, protein process-
ing, energy transfer processes, and cell growth/structure.
Up-regulation of most of the AtNHX1-influenced salt-
responsive transcripts in the absence of AtNHX1 would
suggest the activation of compensatory mechanisms in the
nhx1 plants. Nevertheless, the decreased expression in
transcripts encoding proteins with roles in metabolism
and energy transfer would correlate with the phenotype
displayed by the knockout plants, i.e. reduction of leaf
area, smaller plants, and increased salt-sensitivity [4].
Also, the influence of AtNHX1 on vesicular trafficking and
protein processing did not appear to be associated with
any particular salt stress treatment, but rather appears to
be an expression phenotype of the nhx1 plants, further
indicating that, similar to its homolog in yeast [45-47],
AtNHX1 plays an important role in ion and pH homeos-
tasis of the cell endosomes.
The relatively small effect of AtNHX1 on the expression of
other transporters during salt stress is noteworthy. Other
microarray studies have also shown little impact of salt
stress on the expression of ion transporters [62,63]. It
could be argued that the non-lethal salt concentrations
used here and in previous studies precluded the detection
of significant changes in expression of transporters, and
that under these conditions ion transport may be regu-
BMC Plant Biology 2007, 7:18 />Page 12 of 15
(page number not for citation purposes)
lated primarily at the level of activity. Nevertheless, the
nhx1 plants, in addition to being more sensitive to salt
stress, are decreased in size, show developmental changes,
and have decreased vacuolar H
+
-coupled cation transport
[4]. This would indicate that any possible compensatory
transport mechanism in the knockout plants was insuffi-
cient to maintain ion homeostasis at wild-type levels.
Methods
Plant materials and growth conditions
Three lines of Arabidopsis thaliana were used for this study,
wild-type line (ecotype Wassilewskija; 'WS'), a 'knockout'
line (nhx1) with a T-DNA insertion in the ninth exon of
the AtNHX1 gene, and a 'rescued' line (nhx1::NHX1) with
a single copy of the AtNHX1 coding sequence driven to
constitutive expression by the 35S CMV promoter using
the nhx1 line as the genetic background [4]. Seeds were
surface sterilized with bleach and plated at an even den-
sity (~1 seed cm
-2
) in Petri dishes containing a modified
MS growth medium supplemented with 8% agar and 5%
sucrose. Seeds were germinated in an incubator (Model
CU-36L; Percival Scientific, Perry, IA, USA) at 22°C under
a 12-h photoperiod. Two weeks after sowing, seedlings of
uniform size were selected and were transplanted into 100
ml pots (five seedlings per pot) containing moist soil mix-
ture (MetroMix 200; Scotts Sierra Horticulture Products,
Marysville, OH, USA). The pots were covered with a trans-
parent plastic cover and placed in a growth chamber
(Model AC-40 Controller 6000; Enconair, Winnipeg, MB,
Canada) at 22°C under a short-day cycle (8 h light, 16 h
dark) in order to delay bolting and enhance leaf develop-
ment. Inflorescence tissues were removed nine days later
(one week before harvest) to further emphasize leaf
growth and to minimize developmental differences
among plant lines and treatments. Plant were allowed to
acclimatize for two days after transplanting and the soil
was then saturated with the modified MS medium with-
out or with supplemental 100 mM NaCl, as required. The
watering solution was applied to the soil surface, allowed
to drain and drainage was immediately removed to avoid
salt accumulation.
Plants were subjected to salt stress for durations of 12-
hours, 48-hours, 1-week or 2 weeks. The 2-week treatment
was initiated after a 2-days acclimatization period,
whereas other treatments were initiated afterwards at dif-
ferent times so that all treatments were harvested concur-
rently at the same age, 30 days after sowing. Plant
material, excluding root and inflorescence tissues, was
immediately frozen in liquid nitrogen for later expression
analyses. Subsets of 25 plants (5 pots) of the same treat-
ment and plant line were pooled to form an independent
biological replicate. Four samples for control plants and
three for each of the salt-stressed treatments were col-
lected from each plant line.
RNA extraction and GeneChip
®
hybridization
Frozen plant samples were ground to a fine powder and
RNA was extracted by a modification of the hot-phenol
method [66]. After quality confirmation by agarose gel
electrophoresis, the extracted RNA was prepared for array
analysis as suggested by the manufacturer [67]. Briefly, ds-
cDNA was made from total RNA, followed by formation
of biotin-labeled cRNA, which was purified and fraction-
ated prior to hybridization on individual gene chips. After
overnight hybridization, the chips were stained with
streptavidin-phycoerythrin and biotinylated anti-strepta-
vidin antibody, then scanned by laser, producing an
image file, the basis for quantifying and comparing rela-
tive transcript levels. Quantification of the data depends
on a number of mathematical factors as optimized by
Affymetrix [68] but is primarily based on the hybridiza-
tion of experimental RNA to probe sets, each consisting of
11 representative 25-mer perfect match probes comple-
menting unique portions of different transcripts and 11
corresponding single mismatch oligomer sequences. For
this study, the Affymetrix
®
ATH1-121501 Genome Array
GeneChip
®
was used, containing probe sets for 22,746
predicted and known expressed Arabidopsis genes.
Data analysis
The data images produced by the microarray scanning
were interpreted by Affymetrix
®
Microarray Suite 5.0 (MAS
5.0) software with scaling of all probe sets to a target value
of 500. The purpose of this chip-wide scaling was to min-
imize chip-to-chip difference in overall hybridization
intensities [69]. A numerical file of all the data was pro-
duced and any transcript that did not generate a detection
P-value <0.05 [70] for at least one chip was removed from
the analysis (the default P-value cut-off for a 'present'
expression call is 0.065). This filter eliminated 5,716
genes with unreliable expression data; because of low
detection levels or non-specific probe sets. This also elim-
inated a large majority of transcripts with non-normal dis-
tribution of detection value data generated by MAS 5.0
algorithms [71]. Data from the remaining 17,030 genes
were first normalized to an invariant set using dChip v1.2
computer software [72,73] and exported into Microsoft
®
Excel
®
(Microsoft Corp., Redmond, WA, USA) for further
processing and analyses. Two statistical methods were
used to identify salt responsive genes. A cross-wise log2
ratio analysis was performed with a cut-off threshold for
significance set at two standard errors from a log change
ratio of 0.585, corresponding to a 95% probability that
the true mean represents at least a 50% deviation from the
control treatment. In addition, one-tailed Student's
homoscedastic t-tests with cutoff of P < 0.05 were used to
evaluate the statistical significance of the difference
between gene expression data under each salinity treat-
ment vs. under the respective control. Twelve (3 plant
lines × 4 salinity treatments) comparisons were made for
BMC Plant Biology 2007, 7:18 />Page 13 of 15
(page number not for citation purposes)
each of the 17,030 genes. Only transcripts with compari-
sons that satisfied both statistical conditions under at least
one salt treatment in at least one of the lines were retained
for further analysis. These comparisons limited further
analysis to the 4,027 transcripts that showed a significant
response to salt treatment for at least one comparison.
This approach to determine salt responsive transcripts,
was used in a previous study of salt-treated Arabidopsis
and verification by quantitative real-time PCR demon-
strated the consistency of the method [5].
The selected salt-responsive genes were further analyzed
to discover those that were influenced most strongly by
the AtNHX1 antiporter. Of particular interest were gene
transcripts either up- or down-regulated in the nhx1
'knockout' line, as compared to the wild-type line, with
recovered expression levels in the NHX1::nhx1 'rescued'
line. The 4,027 salt-responsive gene transcripts were sub-
jected to a two-factor model analysis of variance using
JMP software (SAS Institute, 2005). Gene transcripts
showing a significant (p(F) < 0.05) line × treatment inter-
action (indicating treatment-dependent effect of plant
line) or a significant main effect of the plant line (indicat-
ing difference between lines across all treatments) were
subjected to means comparison by Student's t-test. Tran-
scripts expression levels of the three plant lines were com-
pared, either under each environment separately (for
those showing significant interaction) or averaged across
environments (for those showing a significant plant line
effect but no significant interaction). A transcript was
manifested as a salt-responsive AtNHX1-influenced gene
if it exhibited a significantly decreased (down-regulated)
or increased (up-regulated) level of expression in the nhx1
line relative to both the WS line and the NHX1::nhx1 line.
Authors' contributions
JBS carried out the microarray studies, analyzed the data
and drafted the manuscript; YS contributed to the data
analysis and the preparation of the manuscript; EB con-
tributed to the experimental design, data analysis and the
final preparation of the manuscript. All authors have read
and have approved the final manuscript.
Additional material
Acknowledgements
This research was supported by a National Science Foundation Grant
MCB-0343279.
References
1. Apse MP, Aharon GS, Snedden WA, Blumwald E: Salt tolerance
conferred by overexpression of a vacuolar Na
+
/H
+
antiport in
Arabidopsis. Science 1999, 285(5431):1256-1258.
2. Zhang HX, Blumwald E: Transgenic salt-tolerant tomato plants
accumulate salt in foliage but not in fruit. Nature Biotechnology
2001, 19(8):765-768.
3. Yamaguchi T, Aharon GS, Sottosanto JB, Blumwald E: Vacuolar Na
+
/
H
+
antiporter cation selectivity is regulated by calmodulin
from within the vacuole in a Ca
2+
- and pH-dependent man-
ner. Proc Natl Acad Sci USA 2005, 102(44):16107-16112.
4. Apse MP, Sottosanto JB, Blumwald E: Vacuolar cation/H
+
exchange, ion homeostasis, and leaf development are
altered in a T-DNA insertional mutant of AtNHX1, the Ara-
bidopsis vacuolar Na
+
/H
+
antiporter. Plant J 2003,
36(2):229-239.
5. Sottosanto JB, Gelli A, Blumwald E: DNA array analyses of Arabi-
dopsis thaliana lacking a vacuolar Na
+
/H
+
antiporter: impact
of AtNHX1 on gene expression. Plant J 2004, 40(5):752-771.
6. Munns R: Physiological processes limiting plant-growth in
saline soils – some dogmas and hypotheses. Plant Cell Environ
1993, 16(1):15-24.
7. Aharon GS, Apse MP, Duan SL, Hua XJ, Blumwald E: Characteriza-
tion of a family of vacuolar Na
+
/H
+
antiporters in Arabidopsis
thaliana. Plant Soil 2003, 253(1):245-256.
8. Yokoi S, Quintero FJ, Cubero B, Ruiz MT, Bressan RA, Hasegawa PM,
Pardo JM: Differential expression and function of Arabidopsis
thaliana NHX Na
+
/H
+
antiporters in the salt stress response.
Plant J 2002, 30(5):529-539.
9. Zimmermann P, Hirsch-Hoffmann M, Hennig L, Gruissem W: GEN-
EVESTIGATOR. Arabidopsis microarray database and anal-
ysis toolbox. Plant Physiol 2004, 136(1):2621-2632.
10. Genevestigator AtGenExpress Dataset [evestiga
tor.ethz.ch].
11. Cui XQ, Churchill GA: Statistical tests for differential expres-
sion in cDNA microarray experiments. Genome Biol 2003,
4(4):210.1-10.
12. Munich Information Center for Protein Sequence, Arabidop-
sis thaliana Project [ />]
13. The Institute for Genomic Research, Arabidopsis thaliana
Database [ />]
14. The Arabidopsis Information Resource [bidop
sis.org]
15. Blumwald lab microarray data [ />micro/micro.htm]
16. Riera M, Figueras M, Lopez C, Goday A, Pages M: Protein kinase
CK2 modulates developmental functions of the abscisic acid
responsive protein Rab17 from maize. Proc Natl Acad Sci USA
2004, 101(26):9879-9884.
17. Dammann C, Ichida A, Hong BM, Romanowsky SM, Hrabak EM, Har-
mon AC, Pickard BG, Harper JF: Subcellular targeting of nine cal-
cium-dependent protein kinase isoforms from Arabidopsis.
Plant Physiol 2003, 132(4):1840-1848.
18. Wang XM: Regulatory functions of phospholipase D and phos-
phatidic acid in plant growth, development, and stress
responses. Plant Physiol 2005, 139(2):566-573.
19. Clark GB, Sessions A, Eastburn DJ, Roux SJ: Differential expres-
sion of members of the annexin multigene family in Arabi-
dopsis. Plant Physiol 2001, 126(3):1072-1084.
20. Lee S, Lee EJ, Yang EJ, Lee JE, Park AR, Song WH, Park OK: Pro-
teomic identification of annexins, calcium-dependent mem-
brane binding proteins that mediate osmotic stress and
abscisic acid signal transduction in Arabidopsis. Plant Cell 2004,
16(6):1378-1391.
21. Cho W: Membrane targeting by C1 and C2 domains. J Biol
Chem 2001, 276(35):32407-32410.
22. Rusnak F, Mertz P: Calcineurin: Form and function. Physiol Rev
2000, 80(4):1483-1521.
23. Zhu JK: Salt and drought stress signal transduction in plants.
Annu Rev Plant Biol 2002, 53:247-273.
Additional file 1
Specific salt-responsive transcripts influenced by AtNHX1 that have an
unclear cellular function Description : The 58 transcripts that met the
same criteria as those found in Table 1 but that currently have an unclear
functional classification
Click here for file
[ />2229-7-18-S1.pdf]
BMC Plant Biology 2007, 7:18 />Page 14 of 15
(page number not for citation purposes)
24. Maathuis FJM, Filatov V, Herzyk P, Krijger GC, Axelsen KB, Chen SX,
Green BJ, Li Y, Madagan KL, Sanchez-Fernandez R, et al.: Transcrip-
tome analysis of root transporters reveals participation of
multiple gene families in the response to cation stress. Plant
J 2003, 35(6):675-692.
25. Sakuma Y, Liu Q, Dubouzet JG, Abe H, Shinozaki K, Yamaguchi-Shi-
nozaki K: DNA-binding specificity of the ERF/AP2 domain of
Arabidopsis DREBs, transcription factors involved in dehy-
dration- and cold-inducible gene expression. Biochem Bioph Res
Commun 2002, 290(3):998-1009.
26. Knight H, Zarka DG, Okamoto H, Thomashow ME, Knight MR:
Abscisic acid induces CBF gene transcription and subse-
quent induction of cold-regulated genes via the CRT pro-
moter element. Plant Physiol 2004, 135(3):1710-1717.
27. Fowler SG, Cook D, Thomashow ME: Low temperature induc-
tion of Arabidopsis CBF1, 2, and 3 is gated by the circadian
clock. Plant Physiol 2005, 137(3):961-968.
28. Fujita M, Fujita Y, Maruyama K, Seki M, Hiratsu K, Ohme-Takagi M,
Tran LSP, Yamaguchi-Shinozaki K, Shinozaki K: A dehydration-
induced NAC protein, RD26, is involved in a novel ABA-
dependent stress-signaling pathway. Plant J 2004,
39(6):863-876.
29. Suzuki N, Rizhsky L, Liang HJ, Shuman J, Shulaev V, Mittler R:
Enhanced tolerance to environmental stress in transgenic
plants expressing the transcriptional coactivator multipro-
tein bridging factor 1c. Plant Physiol 2005, 139(3):1313-1322.
30. Kang HG, Foley RC, Onate-Sanchez L, Lin CGT, Singh KB: Target
genes for OBP3, a Dof transcription factor, include novel
basic helix-loop-helix domain proteins inducible by salicylic
acid. Plant J 2003, 35(3):362-372.
31. Bi YM, Zhang Y, Signorelli T, Zhao R, Zhu T, Rothstein S: Genetic
analysis of Arabidopsis GATA transcription factor gene fam-
ily reveals a nitrate-inducible member important for chloro-
phyll synthesis and glucose sensitivity. Plant J 2005,
44(4):680-692.
32. Liu PP, Koizuka N, Martin RC, Nonogaki H: The BME3 (Blue
Micropylar End 3) GATA zinc finger transcription factor is a
positive regulator of Arabidopsis seed germination. Plant J
2005, 44(6):
960-971.
33. Ehsan H, Reichheld JP, Durfee T, Roe JL: TOUSLED kinase activ-
ity oscillates during the cell cycle and interacts with chroma-
tin regulators. Plant Physiol 2004, 134(4):1488-1499.
34. Kim JH, Kende H: A transcriptional coactivator, AtGIF1, is
involved in regulating leaf growth and morphology in Arabi-
dopsis. Proc Natl Acad Sci USA 2004, 101(36):13374-13379.
35. Droux M: Sulfur assimilation and the role of sulfur in plant
metabolism: a survey. Photosynth Res 2004, 79(3):331-348.
36. Reintanz B, Lehnen M, Reichelt M, Gershenzon J, Kowalczyk M, Sand-
berg G, Godde M, Uhl R, Palme K: Bus, a bushy Arabidopsis
CYP79F1 knockout mutant with abolished synthesis of
short-chain aliphatic glucosinolates. Plant Cell 2001,
13(2):351-367.
37. Milla MAR, Maurer A, Huete AR, Gustafson JP: Glutathione perox-
idase genes in Arabidopsis are ubiquitous and regulated by
abiotic stresses through diverse signaling pathways. Plant J
2003, 36(5):602-615.
38. Sasaki-Sekimoto Y, Taki N, Obayashi T, Aono M, Matsumoto F,
Sakurai N, Suzuki H, Hirai MY, Noji M, Saito K, et al.: Coordinated
activation of metabolic pathways for antioxidants and
defence compounds by jasmonates and their roles in stress
tolerance in Arabidopsis. Plant J 2005, 44(4):653-668.
39. Ruiz JM, Blumwald E: Salinity-induced glutathione synthesis in
Brassica napus. Planta 2002, 214(6):965-969.
40. Iliev EA, Xu W, Polisensky DH, Oh MH, Torisky RS, Clouse SD,
Braam J: Transcriptional and posttranscriptional regulation of
Arabidopsis TCH4 expression by diverse stimuli. Roles of cis
regions and brassinosteroids. Plant Physiol 2002, 130(2):770-783.
41. Kunzelmann K: Ion channels and cancer. J Membrane Biol 2005,
205(3):159-173.
42. Schreiber R: Ca
2+
signaling, intracellular pH and cell volume in
cell proliferation. J Membrane Biol 2005, 205(3):129-137.
43. McSwine RL, Li J, Villereal ML: Examination of the role for Ca
2+
in regulation and phosphorylation of the Na
+
/H
+
antiporter
NHE1 via mitogen and hypertonic stimulation. J Cell Physiol
1996, 168(1):8-17.
44. Rotin D, Steelenorwood D, Grinstein S, Tannock I: Requirement of
the Na
+
/H
+
Exchanger for Tumor-Growth. Cancer Res 1989,
49(1):205-211.
45. Ali R, Brett CL, Mukherjee S, Rao R: Inhibition of sodium/proton
exchange by a Rab-GTPase-activating protein regulates
endosomal traffic in yeast. J Biol Chem 2004, 279(6):4498-4506.
46. Bowers K, Levi BP, Patel FI, Stevens TH: The sodium/proton
exchanger Nhx1p is required for endosomal protein traffick-
ing in the yeast Saccharomyces cerevisiae. Mol Biol Cell 2000,
11(12):4277-4294.
47. Brett CL, Tukaye DN, Mukherjee S, Rao RJ: The yeast endosomal
Na
+
(K
+
)/H
+
exchanger Nhx1 regulates cellular pH to control
vesicle trafficking. Mol Biol Cell 2005, 16(3):1396-1405.
48. Molendijk AJ, Ruperti B, Palme K: Small GTPases in vesicle traf-
ficking. Curr Opin Plant Biol 2004, 7(6):694-700.
49. Lindemann P, Koch A, Degenhardt B, Hause G, Grimm B, Papadopou-
los V: A novel Arabidopsis thaliana protein is a functional
peripheral-type benzodiazepine receptor. Plant Cell Physiol
2004, 45(6):723-733.
50. Mazel A, Leshem Y, Tiwari BS, Levine A: Induction of salt and
osmotic stress tolerance by overexpression of an intracellu-
lar vesicle trafficking protein AtRab7 (AtRabG3e). Plant Phys-
iol 2004, 134(1):118-128.
51. Nahm MY, Kim SW, Yun DJ, Lee SY, Cho MJ, Bahk JD: Molecular
and biochemical analyses of OsRab7, a rice Rab7 homolog.
Plant Cell Physiol 2003, 44(12):1341-1349.
52. TerBush DR, Maurice T, Roth D, Novick P: The Exocyst is a mul-
tiprotein complex required for exocytosis in Saccharomyces
cerevisiae. EMBO J 1996, 15(23):6483-6494.
53. Terbush DR, Dunkelbarger S, Navidi A, Partridge J, Levi A: Exo70
links vesicle targeting to artin cytoskeleton organization.
Mol Biol Cell 1999, 10:303a-303a.
54. Miki H, Okada Y, Hirokawa N: Analysis of the kinesin super-
family: insights into structure and function. Trends Cell Biol
2005, 15(9):467-476.
55. Holweg C, Nick P: Arabidopsis myosin XI mutant is defective
in organelle movement and polar auxin transport. Proc Natl
Acad Sci USA 2004, 101(28):10488-10493.
56. Sato M, Sato K, Nishikawa S, Hirata A, Kato J, Nakano A: The yeast
RER2 gene, identified by endoplasmic reticulum protein
localization mutations, encodes cis-prenyltransferase, a key
enzyme in dolichol synthesis. Mol Cell Biol 1999, 19(1):471-483.
57. Leng Q, Mercier RW, Hua BG, Fromm H, Berkowitz GA:
Electro-
physiological analysis of cloned cyclic nucleotide-gated ion
channels. Plant Physiol 2002, 128(2):400-410.
58. Maathuis FJM: The role of monovalent cation transporters in
plant responses to salinity. J Exp Bot 2006, 57(5):1137-1147.
59. Donaldson L, Ludidi N, Knight MR, Gehring C, Denby K: Salt and
osmotic stress cause rapid increases in Arabidopsis thaliana
cGMP levels. FEBS Lett 2004, 569(1–3):317-320.
60. Maathuis FJM: cGMP modulates gene transcription and cation
transport in Arabidopsis roots. Plant J 2006, 45(5):700-711.
61. Gong QQ, Li PH, Ma SS, Rupassara SI, Bohnert HJ: Salinity stress
adaptation competence in the extremophile Thellungiella
halophila in comparison with its relative Arabidopsis thal-
iana. Plant J 2005, 44(5):826-839.
62. Kreps JA, Wu YJ, Chang HS, Zhu T, Wang X, Harper JF: Transcrip-
tome changes for Arabidopsis in response to salt, osmotic,
and cold stress. Plant Physiol 2002, 130(4):2129-2141.
63. Seki M, Narusaka M, Ishida J, Nanjo T, Fujita M, Oono Y, Kamiya A,
Nakajima M, Enju A, Sakurai T, et al.: Monitoring the expression
profiles of 7000 Arabidopsis genes under drought, cold and
high-salinity stresses using a full-length cDNA microarray.
Plant J 2002, 31(3):279-292.
64. Shi HZ, Ishitani M, Kim CS, Zhu JK: The Arabidopsis thaliana salt
tolerance gene SOS1 encodes a putative Na
+
/H
+
antiporter.
Proc Natl Acad Sci USA 2000, 97(12):6896-6901.
65. Yamaguchi T, Apse MP, Shi HZ, Blumwald E: Topological analysis
of a plant vacuolar Na
+
/H
+
antiporter reveals a luminal C ter-
minus that regulates antiporter cation selectivity. Proc Natl
Acad Sci USA 2003, 100(21):12510-12515.
66. Verwoerd TC, Dekker BMM, Hoekema A: A small-scale proce-
dure for the rapid isolation of plant RNAs. Nucleic Acids Res
1989, 17(6):2362-2362.
Publish with BioMed Central and every
scientist can read your work free of charge
"BioMed Central will be the most significant development for
disseminating the results of biomedical research in our lifetime."
Sir Paul Nurse, Cancer Research UK
Your research papers will be:
available free of charge to the entire biomedical community
peer reviewed and published immediately upon acceptance
cited in PubMed and archived on PubMed Central
yours — you keep the copyright
Submit your manuscript here:
/>BioMedcentral
BMC Plant Biology 2007, 7:18 />Page 15 of 15
(page number not for citation purposes)
67. GeneChip
®
Expression Analysis Technical Manual [http://
www.affymetrix.com/support/technical/manual/
expression_manual.affx]
68. Affymetrix: New Statistical Algorithms For Monitoring Gene
Expression On Genechip
®
Probe Arrays. .
69. Affymetrix: GeneChip
®
Expression Analysis Data Analysis
Fundamentals. [ />manuals/data_analysis_fundamentals_manual.pdf].
70. Affymetrix: Statistical Algorithms Reference Guide. [http://
www.affymetrix.com/support/technical/technotes/
statistical_reference_guide.pdf].
71. Giles PJ, Kipling D: Normality of oligonucleotide microarray
data and implications for parametric statistical analyses. Bio-
informatics 2003, 19(17):2254-2262.
72. Li C, Wong WH: Model-based analysis of oligonucleotide
arrays: Expression index computation and outlier detection.
Proc Natl Acad Sci USA 2001, 98(1):31-36.
73. dChip Software [
]
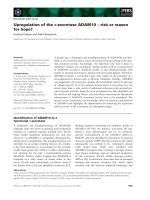


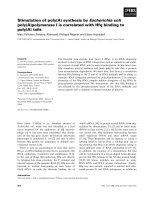
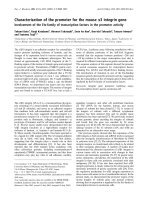
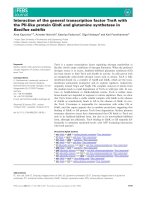

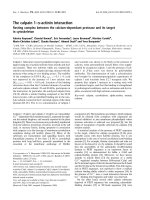
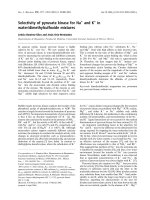
![Báo cáo khoa học: Epoxidation of benzo[a]pyrene-7,8-dihydrodiol by human CYP1A1 in reconstituted membranes Effects of charge and nonbilayer phase propensity of the membrane pot](https://media.store123doc.com/images/document/14/rc/ld/medium_ldo1394248806.jpg)