báo cáo khoa học: " Discovery of chemically induced mutations in rice by TILLING" potx
Bạn đang xem bản rút gọn của tài liệu. Xem và tải ngay bản đầy đủ của tài liệu tại đây (556.69 KB, 12 trang )
BioMed Central
Page 1 of 12
(page number not for citation purposes)
BMC Plant Biology
Open Access
Methodology article
Discovery of chemically induced mutations in rice by TILLING
Bradley J Till
†1,2
, Jennifer Cooper
†1
, Thomas H Tai
3
, Peter Colowit
3
,
Elizabeth A Greene
1
, Steven Henikoff
1
and Luca Comai*
2,4
Address:
1
Fred Hutchinson Cancer Research Center, Seattle, WA 98107, USA,
2
Department of Biology, University of Washington, Box 355325,
Seattle, WA 98195, USA,
3
USDA-ARS, Crops Pathology and Genetics Research Unit, Department of Plant Sciences, Davis, CA 95616, USA and
4
Section of Plant Biology and Genome Center, UC Davis, Davis, CA 95616, USA
Email: Bradley J Till - ; Jennifer Cooper - ; Thomas H Tai - ;
Peter Colowit - ; Elizabeth A Greene - ; Steven Henikoff - ;
Luca Comai* -
* Corresponding author †Equal contributors
Abstract
Background: Rice is both a food source for a majority of the world's population and an important
model system. Available functional genomics resources include targeted insertion mutagenesis and
transgenic tools. While these can be powerful, a non-transgenic, unbiased targeted mutagenesis
method that can generate a range of allele types would add considerably to the analysis of the rice
genome. TILLING (Targeting Induced Local Lesions in Genomes), a general reverse genetic
technique that combines traditional mutagenesis with high throughput methods for mutation
discovery, is such a method.
Results: To apply TILLING to rice, we developed two mutagenized rice populations. One
population was developed by treatment with the chemical mutagen ethyl methanesulphonate
(EMS), and the other with a combination of sodium azide plus methyl-nitrosourea (Az-MNU). To
find induced mutations, target regions of 0.7–1.5 kilobases were PCR amplified using gene specific
primers labeled with fluorescent dyes. Heteroduplexes were formed through denaturation and
annealing of PCR products, mismatches digested with a crude preparation of CEL I nuclease and
cleaved fragments visualized using denaturing polyacrylamide gel electrophoresis. In 10 target genes
screened, we identified 27 nucleotide changes in the EMS-treated population and 30 in the Az-
MNU population.
Conclusion: We estimate that the density of induced mutations is two- to threefold higher than
previously reported rice populations (about 1/300 kb). By comparison to other plants used in public
TILLING services, we conclude that the populations described here would be suitable for use in a
large scale TILLING project.
Background
Rice is both a food crop and a model system for scientific
research. While the wild plant Arabidopsis has become
the paramount model plant system, the spectrum of its
traits cannot address fundamental questions of crop plant
domestication and performance, therefore, an efficient
experimental system based on a crop plant is needed. At
the time of this publication, rice is the only crop for which
Published: 11 April 2007
BMC Plant Biology 2007, 7:19 doi:10.1186/1471-2229-7-19
Received: 2 November 2006
Accepted: 11 April 2007
This article is available from: />© 2007 Till et al; licensee BioMed Central Ltd.
This is an Open Access article distributed under the terms of the Creative Commons Attribution License ( />),
which permits unrestricted use, distribution, and reproduction in any medium, provided the original work is properly cited.
BMC Plant Biology 2007, 7:19 />Page 2 of 12
(page number not for citation purposes)
complete genome sequence has been made available [1-
3]. To realize the full potential of rice genomics, however,
an appropriate genomic toolbox must be assembled.
While methods such as expression profiling, proteomic
and metabolomic analysis can provide insight into the
function of genes and pathways, a complete analysis of
function must involve disruption or modification of gene
action.
Several approaches are available for the functional inacti-
vation of rice genes. Tagging has been achieved with
endogenous [4] and introduced transposons [5,6], and
with the T-DNA of Agrobacterium tumefaciens [5,7]. The
growing tagged gene databases will provide knock-outs
for a majority of rice genes [5], but a substantial number
will be missed. Such an outcome is exemplified by the tag-
ging resources available in Arabidopsis [8], where even
360,000 tags leave more than 10% of the genes untagged
[9]. While the probability of tagging a gene increases with
the number of available tags, it does so asymptotically and
with some sequence bias [10], and the efforts to extend
the database produce diminishing returns.
Another method exploits RNA interference [11,12], trig-
gered by expression of transgenic hairpin repeats homol-
ogous to the gene target. The efficacy of this approach,
however, can vary [13] and transgenic technologies may
hinder field-testing because of regulatory and contain-
ment considerations. Given these limitations, the ability
to use traditional mutagenesis techniques coupled to effi-
cient targeting of genes would be advantageous. Fast neu-
tron mutagenesis can generate small to medium size
deletions in genomes. Li and colleagues exploited this
strategy in rice to develop a PCR-based method that iden-
tified smaller-than-expected amplicons due to the pres-
ence of a deletion [14]. While this approach is potentially
quite powerful, the mutants were rare and it is unclear if
large populations with a sufficient density of medium
sized deletions can be generated to make the process effi-
cient. Further, deletions will most likely lead to a com-
plete loss of gene function, making them unsuitable for
studying the functions of essential genes.
Chemical mutagens have been used for forward genetic
screens in a variety of organisms (see for example [15]).
Compounds such as EMS and MNU induce single nucleo-
tide changes by alkylation of specific nucleotides [16,17],
resulting in mutations that are high in density and essen-
tially randomly distributed [18]. Therefore, a relatively
small population of individuals can provide an allelic
series that includes a variety of missense changes with dif-
fering effects on protein function, and nonsense or splice
site changes that cause truncation of the gene product.
TILLING (Targeting Induced Local Lesions IN Genomes)
[19] is a general reverse genetic technique that uses tradi-
tional chemical mutagenesis methods to create libraries of
mutagenized individuals that are later subjected to high
throughput screens for the discovery of mutations
[20,21]. Mutations are identified by enzymatic cleavage of
PCR amplified heteroduplexed DNA followed by band
visualization using fluorescent end-labeling and denatur-
ing polyacrylamide gel electrophoresis. The generality of
the mutagenesis and the mutation discovery methods
allow application of this approach to most organisms.
Indeed, TILLING results have been reported for a variety
of plants and animals [19,22-29]. The application of TILL-
ING to rice, however, has been hampered by the difficulty
in obtaining a population with a sufficiently high muta-
tion density [27]. Here we describe progress in the TILL-
ING of rice. Two different mutagenic treatments were used
to generate two pilot scale mutant libraries, which were
screened for mutations in 10 gene targets. A total of 57
nucleotide changes were identified. Based on this work,
we conclude that a sufficient density of mutations can be
obtained and detected by this method to create an effi-
cient, large-scale mutation discovery service for rice.
Results
TILLING population development
To TILL rice, we chose a seed mutagenesis strategy analo-
gous to what was used for TILLING Arabidopsis [19]. In
this strategy, seeds are soaked with mutagen, and each fer-
tile seedling defines a line harboring unique mutations
(Figure 1). To avoid mosaicism in the M1 generation,
plants are self fertilized and M2s are grown. Only one M2
individual from each M1 is selected for DNA extraction.
This avoids sampling the same mutation in TILLING
screens. Mutagenesis was performed using protocols that
were previously established for grasses [30]. While EMS
has been the mutagen of choice for many TILLING
projects [19,22-28], a relatively low number of EMS-
induced mutations were reported for the indica rice vari-
ety IR64 when treated with 0.8% and 1% EMS [27] and
initial EMS treatments of the reference japonica variety
Nipponbare resulted in insufficient seed germination due
to toxicity (Tai and Colowit, unpublished observations).
We therefore decided to test if alternative mutagens might
provide a higher density of mutations with less toxicity to
the treated seeds. A mutagenesis protocol using a combi-
nation of sodium azide plus methyl nitrosourea (Az-
MNU) was selected. This mutagen has been previously
used for forward genetic screens of barley [30]. A previ-
ously developed population in the japonica variety M-202
using 1 mM Az-7.5 mM MNU (Tai and Colowit, unpub-
lished) was examined and shown to have a low mutation
density (~1 per 1000 kb; Till and Cooper, unpublished
results). Preliminary tests indicated that concentrations of
MNU above 15 mM caused a large drop in germination
and in viability of germinated plants (see Methods). Based
on this, a combination of 1 mM Az-15 mM MNU was cho-
BMC Plant Biology 2007, 7:19 />Page 3 of 12
(page number not for citation purposes)
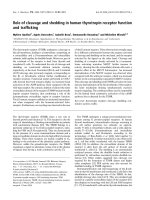
TILLING strategy for riceFigure 1
TILLING strategy for rice. After seed mutagenesis, chimeric M1 plants are allowed to self-pollinate and a single M2 plant is
grown to provide DNA for mutation discovery and seed for banking. DNAs are pooled eightfold and arrayed in a two-dimen-
sional format on 96-well plates. After PCR amplification of target genes, heteroduplexes are formed upon heating and anneal-
ing, and then digested using crude celery juice extract containing the CEL I nuclease. Cut strands are separated by denaturing
polyacrylamide gel electrophoresis, and visualized by fluorescence detection using a Li-Cor DNA analyzer. The presence of cut
products in two pools identifies the individual harboring the polymorphism.
EMS or Az-MNU M1
seed
M2 M3
DNAs
2-D 8-fold pools
in 96 - well plate
Li-cor gel images
IRD700
CELI
PCR
positive pools
IRD800
BMC Plant Biology 2007, 7:19 />Page 4 of 12
(page number not for citation purposes)
sen for mutagenesis of Nipponbare. In addition, extended
washing of seeds treated with EMS enabled the develop-
ment of a Nipponbare population mutagenized with
1.5% EMS.
Detection of mutations
For TILLING, we designed gene-specific primers that tar-
get selected regions of the rice genome (Table 1). Forward-
strand primers were end-labeled with IRDye 700 dye and
reverse-strand primers with IRDye 800 dye. We followed
the standard high throughput TILLING protocol for muta-
tion discovery [31]. After PCR amplification, products
were denatured and annealed to form heteroduplexes
between complementary strands. Heteroduplexes were
then cleaved using a crude celery juice extract [32], and the
products were size-fractionated on denaturing polyacryla-
mide gels using a Li-Cor DNA analyzer. Cleaved heterodu-
plexes produced two smaller molecular weight products,
one labeled with IRDye 700 and the other with IRDye
800, whose sizes added up to the size of the full length
product (Figure 2).
For both the Az-MNU and the EMS populations, 768
unique individual samples were selected for screening. We
have previously reported robust discovery of mutations
using pooled DNAs from eight individuals [18]. We there-
fore chose to pool samples eightfold for rice TILLING.
Prior to pooling, genomic DNAs were normalized to a
standard concentration. To shorten the time for validation
of putative mutations, we used a two-dimensional array-
ing strategy whereby every individual is represented in
two distinct eightfold pools and 384 unique individuals
are screened in 96 lanes (2 × 8 × 96 = 384). A mutation
will then produce signals in two gel lanes, whose posi-
tions allow deconvolution of the pools and provide the
identity of the individual harboring the mutation (Figure
2). After discovery on a TILLING gel, the identity of each
change was determined by sequencing.
A total of 57 nucleotide changes were identified in the Az-
MNU and EMS populations (Table 2). We obtained mul-
tiple mutations from each target. The mutations in
OsDREB provide an example of an interesting allelic series
that is anchored by a predicted severe loss of function
(truncation due to a nonsense mutation at codon 21) and
contains six other missense changes (Figure 3). To esti-
mate the density of mutations for each population, we
divided the total number of mutations identified by the
total base pairs screened. We previously reported a dimin-
ished ability to detect mutations in the terminal 100 base
pairs of each end of the amplicon [18]. Therefore, we sub-
tracted 200 base pairs from the size of each amplicon to
obtain the effective screening window size. To determine
the total number of base pairs screened, we added the
adjusted size of each amplicon and multiplied by the total
number of samples screened. For each population,
7,951,104 base pairs were interrogated for mutations
(10,353 bp × 768 individuals). We estimate a density of
~1 mutation/294 kb for the 1.5% EMS population and 1/
265 kb for the population treated with Az-MNU. These
mutation densities are ~threefold higher than have been
previously observed for treatments with a lower concen-
tration of mutagen [27] (B.T. and J.C., unpublished
results).
We compared the mutational spectrum obtained through
TILLING with the spectrum of natural polymorphisms
identified by in silico comparison of sequences from
japonica and indica varieties [33] (Table 3). In the case of
chemically-induced mutations, frequent transition
changes are expected because both EMS and MNU
alkylate predominantly G residues and result in GC->AT
changes [34,35]. Comparison of observed to expected
ratios of GC->AT changes to all other changes indicated
that these changes did not result from sampling natural
variation (p < 0.01) as would be expected if the changes
we observed had resulted from contamination. We con-
clude that most or all changes were induced through
mutagenesis.
Discussion
There are two critical steps in TILLING: mutagenesis and
high throughput mutation discovery. For a successful
reverse genetics service, it is paramount to achieve a satis-
factory mutation density. The experience of the Seattle
TILLING Project is that a library of mutagenized individu-
als is optimally suited for TILLING when in average at
least one mutation is found per Li-Cor gel run. With sam-
ples pooled eightfold in a two dimensional array and an
amplicon size of 1.5 kb, efficient TILLING requires a pop-
ulation with a mutation density of ≥ 1 mutation/500 kb.
Mutation rates should increase with increasing mutagen
concentration, but developing a well-mutagenized popu-
lation can be challenging because diverse species and even
varieties of the same species display a different response to
mutagenic treatments [27]. For example, doses of muta-
gen that result in high lethality of the treated seed in one
species, such as barley [36], may not yield the high muta-
tion density that is seen with much less lethality in
another species, such as Arabidopsis [37] or wheat [28].
We experienced such a difficulty with rice, where multiple
attempts resulted in unsatisfactorily low mutation densi-
ties (Till, Tai, Leung, Henikoff and Comai, unpublished
results). Although desirable, estimating the mutation rate
from phenotypic analysis of M2 individuals is not simple.
In Arabidopsis it is possible to reliably score embryo
lethals, a phenotype resulting from deficiency at any of
hundreds of genes. This measure has been incorporated in
routine mutagenesis for TILLING [37]. Embryo lethality,
however, is not as easily ascertained in rice and there is
BMC Plant Biology 2007, 7:19 />Page 5 of 12
(page number not for citation purposes)
uncertainty on what other phenotypic indicators should
be used. For example, the frequency of albino mutants is
surprisingly high (8%) in rice populations that had a sub-
optimal mutation rate as determined by TILLING [27].
Through optimization of mutagenesis treatments and by
choosing the highest mutagen concentration compatible
with acceptable seed survival, we have succeeded in
achieving a satisfactory mutation rate. Nipponbare popu-
lations treated either with 1.5 % EMS or by sequential
soaking in 1 mM sodium azide and 15 mM MNU, showed
a similar density of putative mutations detected by TILL-
ING, ~1/300 kb. This mutation density is well suited to
high-throughput mutation discovery. Comparison of
phenotypic versus molecular mutation rates in these pop-
ulations should provide phenotypic markers for assessing
future TILLING populations.
The spectrum of observed changes differs from what was
observed in Arabidopsis, maize, and wheat [24,28,37]. In
these systems, EMS-induced changes were mostly GC->AT
transitions, as expected from the frequent alkylation by
EMS of guanine residues [16,38]. In our EMS-treated rice
population, we found 70% GC->AT, 11% AT->GC, 4%
GC->TA, and 15% AT->TA. This is not very different from
the spectrum of mutations observed in a forward screen in
Drosophila, which were respectively 76, 6 and 10 % (the
balance were deletions) [39], and is consistent with the
mutational spectrum reported by TILLING of barley [36].
Rice, therefore, might differ from Arabidopsis, maize, and
wheat in its mutagenic response to EMS. There is less
information on changes induced in plants by sodium
azide and MNU, and no information on the combined
action of the two mutagens. Both transitions (GC->AT,
and AT->GC) and transversions were observed after
sodium azide treatment in barley [40]. MNU induced pre-
dominantly GC->AT transitions in bacteria [34] and mice
[35]. The analysis of the changes induced by both the EMS
and Az-MNU treatment argued against the hypothesis that
natural polymorphisms introduced by contamination of
the Nipponbare population could be responsible for the
observations. It is possible, nonetheless, that polymor-
phisms introduced through pollen or seed contamination
might be responsible for a minority of the observed
changes. This is the case in the Arabidopsis population
used successfully by the Seattle TILLING Project where
rare contaminants have been observed to introduce poly-
morphisms in multiple genes in the same individual
[18,41]. In such cases, however, occasional concurrent
mutations found either in the same gene of the same indi-
vidual, or in other genes of the same individual are
expected [18,29]. For example, based on the Poisson dis-
tribution, the probability of obtaining two mutations in
the same individual of either EMS- or Az-MNU-treated
populations after screening 10 genes × 1,300 bp of DNA
is 0.95. An increasing number of concurrent mutations are
of course less and less likely to be caused by the mutagenic
treatment. Once an appropriate P-value threshold is
crossed, usually requiring the screening of two or three
dozen genes, these rare contaminants can be flagged and
eliminated from subsequent TILLING searches. In the case
of these populations, even if we assume conservatively
that all concurrent or non-GC->AT changes are due to
contamination, and remove them from the counts, the
resulting mutation rates (EMS, 1/530 kb; Az-MNU, 1/497
kb) are still satisfactory and suitable for high throughput
TILLING. A TILLING service for the rice community is
planned and will be accessible at the following URL: http:/
/tilling.ucdavis.edu.
Conclusion
We have applied the TILLING method to the model crop
rice and have identified two different mutagenic treat-
ments that provide a suitably high density of mutations (≥
1/500 kb) to consider developing rice for a high through-
Table 1: Genes and primers
Target name Locus Forward primer Reverse primer Amplicon size (bp)
Os1433 Os02g36974 agccgtggtaatgaggatcgttgc cctgaagccgcacacatggaattt 1,499
OsBZIP Os01g64000 gtgagatggcatcggagatgagca ctggctgccacccctatttgcatt 1,495
OsCALS8R Os01g55040 cactcggcgtggaggaattacgac aacactgcgaatctcccccagatg 999
OsDREB Os01g07120 catcgtggcgcaacatgaaaaaga ccacagtgcactcaacacacagtacaa 1,167
OsEXTE Os10g33970 tgtttgccttccgttaatgccaca agcgcccctaatccgaaccaaag 1,433
OsMAPK Os07g38530 gccggaagcgttgtacaaggtcaa cggcaagaaagcatttcaggcatc 1,495
OsPITA Os12g18360 tggagttgttggccaaggaaatga tttccagtccatttggggatgctg 1,008
OsR1A Os05g41290 ggttctcatcggtcacgaccaaca tccattgagaccgactgtgcaagg 751
OsRPLD1 Os01g07760 ggatggcttgatggcaacacatga gtccttggggttcgcttcaattcc 997
OsTPS1 Os02g44230 agcggaaggtcccgcaataaggta gcttcaaaattgtcgcctcggaaa 1,509
TOTAL 12,353
BMC Plant Biology 2007, 7:19 />Page 6 of 12
(page number not for citation purposes)
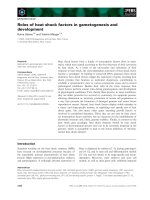
Mutation discovery in eightfold pools of mutagenized individuals arrayed in a 2-D schemeFigure 2
Mutation discovery in eightfold pools of mutagenized individuals arrayed in a 2-D scheme. Mutation discovery in
eightfold pools of mutagenized individuals arrayed in a two-dimensional format. Top: A two dimensional pooling scheme is
used whereby sixty-four samples from individual rice plants are first arrayed in an eight by eight grid. Samples from a common
column are pooled in the first dimension and from a common row in the second dimension. Row pools and column pools are
arrayed on adjacent lanes of an assay plate. Bottom: IRDye 700 (left) and IRDye 800 (right) gel images from the same sixteen
lanes of a ninety-six lane TILLING assay for mutations in the 1,167 base pair OsDREB rice target. True mutations (boxed) pro-
duce a band in the column and row pool of each IRDye image, allowing the unique individual harboring the mutation to be
determined in a single gel run (marked in yellow on the top diagram). Bands resulting from the same mutation are boxed a sim-
ilar color. The molecular weight of the mutant band in the IRDye 700 image plus the molecular weight of the band in the IRDye
800 image adds up to the molecular weight of the full length PCR product. To the left of the images a virtual molecular weight
ladder generated by the GelBuddy gel analysis program is shown. Next to this is the gene model (lines represent introns, boxes
represent exons) that was generated when target primers were chosen using the CODDLe program.
columns rows
2-D pooling
IRD700 IRD800
1000
800
700
650
600
565
530
500
460
400
364
350
300
255
200
145
100
BMC Plant Biology 2007, 7:19 />Page 7 of 12
(page number not for citation purposes)
put TILLING service. From this pilot-scale experiment
with 10 target genes, we were able to identify 57 nucleo-
tide changes, most of which were inferred to be induced
by mutagen treatment. One nonsense mutation and 29
missense mutations were identified, six of which are pre-
dicted to be damaging to protein function. The estimated
mutation density is at least twofold greater than previ-
ously reported for rice and comparable to that reported
for Arabidopsis.
Methods
Mutagenesis
The reference variety Nipponbare was selected for muta-
genesis. Seeds from the original Nipponbare GA3 plant
selected for use by the International Rice Genome
Sequencing Project [3] were obtained from S. McCouch
(Cornell University). These seeds were amplified in a
greenhouse in Stuttgart, AR, followed by amplification in
a field nursery in the same location and an additional
amplification in a field nursery in Davis, CA. These seeds
were subjected to the following mutagenesis protocols.
Sodium azide and methyl nitrosourea mutagenesis: For
preliminary testing, we determined toxicity levels by treat-
ing with MNU as indicated below and germinating about
250 seeds. In two preliminary tests we observed respec-
tively 49 and 56% germination (control displayed 72 and
80% germination) after treatment with 15 mM MNU.
Higher concentrations of MNU resulted in progressively
lower germination (20 mM, 36 and 48%; 30 mM, 24 and
23%). The fraction of viable (green) plants, however, was
reduced precipitously by MNU concentrations above 15
mM (15 mM, 21 and 53%; 20 mM, 13 and 17%; 30 mM
13 and 14%). Therefore, 15 mM MNU was used as the
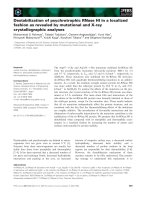
PARSESNP output for the rice target OsDREB showing mutations discovered in both test populationsFigure 3
PARSESNP output for the rice target OsDREB showing mutations discovered in both test populations. At top,
the gene model is shown in red with boxes corresponding to exons and lines for introns. Green boxes represent protein
homology block alignments automatically generated using the SIFT program. Triangles indicate the location and type of muta-
tion found. The red triangle denotes a nonsense mutation, the purple a silent change, and black triangles represent missense
changes. The table summarizes the position and nucleotide change of each mutation, and the respective effect on the protein
sequence (* indicates premature stop codon, = indicates a silent change, and letters indicate the amino acid according to single
letter code). Restriction endonuclease sites that are either gained or lost due to the mutation are also listed and can be used
for downstream genotyping. Missense changes are provided with PSSM and SIFT scores [46,47]. Scores are listed in red when
the change is predicted to be damaging.
BMC Plant Biology 2007, 7:19 />Page 8 of 12
(page number not for citation purposes)
Table 2: Mutations discovered in the Nipponbare populations mutagenized with either 1.5% EMS or 1 mM Az-15 mM MNU
Target Nucleotide Change Amplicon Position Effect
a
Population Stock
EMS Az-MNU
Os1433 T->C 270 L139P
+
XTJ_0516
T->A 304 D150E X TJ_0521
G->A 326 A158T
+
XTJ_0160
A->G 332 K160E X TJ_0160
C->T 595 S194F
+
XTJ_0024
G->T 950 intron X TJ_0042
C->T 1144 intron X TT_0028
G->A 1314 L213= X TJ_0478
OsBZIP C->T 141 L46F X TT_0370
G->A 475 S157N X TT_0846
G->A 530 E175= X TJ_0747
G->A 574 G190E X TT_0267
G->A 640 G212D X TT_0150
G->A 947 E314= X TT_0781
G->A 1012 intron X TT_0150
C->T 1083 L330= X TJ_0504
OsCALS8R G->A 93 R291= X TJ_0461
C->T 288 V356= X TJ_0521
A->T 458 Y413F
+
X TT_0314
A->G 574 I452V X TT_0044
C->T 643 L475= X TT_0145
G->A 843 E541= X TJ_0143
OsDREB G->A 203 W21* X TT_0320
G->A 278 E46= X TT_0781
G->A 318 A60T X TT_0133
G->A 558 D140N X TT_0627
C->T 613 S158F X TT_0593
A->C 805 N222T X TT_0150
A->C 805 N222T X TT_0123
G->A 849 V237M X TJ_0230
G->A 913 S258N X TJ_0676
OsEXTE C->T 73 intron X TT_0646
A->G 282 E174G X TT_0682
G->A 593 V278I X TJ_0122
C->T 651 S297F X TJ_0024
G->A 697 R312= X TT_0426
A->G 1024 Q421= X TT_0419
G->A 1093 P444= X TT_0503
G->A 1164 C468Y X TJ_0155
OsMAPK A->T 254 T331S X TT_0301
T->C 799 G478= X TT_0399
G->A 832 E489= X TT_0437
A->T 1181 M606L X TJ_0360
OsPITA G->A 293 D481N X TT_0515
C->T 424 V524= X TJ_0183
T->C 724 L624= X TJ_0517
G->A 802 K650= X TJ_0162
G->A 872 A674T X TJ_0025
OsR1A C->T 217 T186I X TT_0246
BMC Plant Biology 2007, 7:19 />Page 9 of 12
(page number not for citation purposes)
highest concentration and administered in combination
with sodium azide. A batch of ~10,000 seed (estimated by
the average weight of a kernel) were placed in a 1L flask
with 400 ml of ultrapure water and soaked overnight
(~14–18 hours) at room temperature. Water was decanted
and replaced with 325 ml of 1 mM sodium azide in
sodium phosphate buffer (pH 3.5) and incubated at room
temperature for 3 hours. Sodium azide was decanted and
seeds were rinsed with 400 ml of ultrapure water (3 rinses,
5 minutes each). Following the third rinse, 400 ml of
ultrapure water was added to the seeds for another over-
night soak. Water was decanted and 400 ml of 15 mM
MNU was added to the seeds followed by incubation for
3 hours at room temperature with occasional mixing.
Rinsing with ultrapure water was performed as described,
followed by rinsing under running tap water for 1 hour.
Seeds were sown in flats and germinated in the green-
house. Young seedlings (about 4 leaf stage) were trans-
A->G 389 L243= X TT_0257
OsRPLD1 C->T 252 T371I
+
X TT_0643
OsTPS1 T->C 182 G182= X TT_0898
C->T 364 intron X TJ_0710
C->T 521 intron X TJ_0476
A->T 598 Q205H
+
XTJ_0545
G->A 1147 intron X TJ_0415
A->T 1458 intron X TJ_0247
Total 27 30
a
Synonymous (=), nonsense (*), and missense changes are shown, where the amino acid residue number is based on the exon-intron model for the
TILLed fragment. Missense changes predicted by the program SIFT to be damaging to the encoded protein are indicated (+). Predicted damaging
mutations are highlighted in bold.
Table 2: Mutations discovered in the Nipponbare populations mutagenized with either 1.5% EMS or 1 mM Az-15 mM MNU (Continued)
Table 3: Analysis of natural and induced polymorphisms
polymorphism natural rate
b
EMS Az-MNU
type change
a
ob
c
ex
d
ob ex
transitions GC->AT 0.32 19 8.53 20 9.48
AT->GC 0.35 3 9.48 6 10.53
transversions GC->TA 0.09 1 2.33 0 2.59
GC->CG 0.07 0 1.84 0 2.05
AT->TA 0.09 4 2.30 2 2.55
AT->CG 0.09 0 2.52 2 2.80
Statistical analysis
e
transitions GC->AT 0.32 19 8.53 20 9.48
AT->GC
transversions GC->TA
GC->CG 0.68 8 18.46 10 20.52
AT->TA
AT->CG
Probability 0.0067 0.0042
a
GC->AT is expected from G base-alkylating mutagens. Changes in bold are rare to uncommon in EMS- or MNU-treated organisms (see
references in text).
b
calculated from 62,000 natural SNPs of rice.
c
observed.
d
expected for natural polymorphisms.
e
P of the null hypothesis that
the observed changes are natural polymorphisms was calculated with Fisher Exact test for each for 2-by-2 table of data from the EMS (ethyl
methanesulfonate treatment) and Az-MNU (sodium azide – methyl nitrosourea treatment). See Discussion and Methods for details.
BMC Plant Biology 2007, 7:19 />Page 10 of 12
(page number not for citation purposes)
planted by hand in a field nursery (Davis, CA). Plants
were harvested and single panicles (M2 seeds) were ran-
domly selected from each M1 plant. A single M2 plant
from each M1 was grown for DNA analysis and M3 seed
collection.
EMS mutagenesis: A total of ~48,000 seeds (estimated by
the average weight of a kernel) were treated in batches of
2,000. Batches were placed in a 250 ml flask and ultrapure
water was added to about 1 cm above the seeds (~75 ml).
Seeds were soaked overnight at room temperature for 24
hours. Water was decanted and 25 ml of 1.5% EMS (v/v)
in water was added. Seeds were incubated for 18 hours at
room temperature followed by decanting of the EMS and
rinsing with 75 ml of ultrapure water (3 times, 5 minutes
each) and 125 ml of ultrapure water (3 times, 20 minutes
each). Seeds were then rinsed under running tap water for
2 hours before planting in flats. Seedlings (2 to 4 leaf
stage) were transplanted to 98-cell plug trays and grown in
the greenhouse until maturity. The M1 plants grown
under these conditions typically produced one flowering
tiller, which was harvested. A single M2 plant from each
M1 was grown for DNA analysis and M3 seed collection.
DNA extraction and sample pooling
Approximately 20 mg of lyophilized leaf tissue was used
for DNA extraction with the FastPrep DNA kit (Qbiogene
Inc/MP Biomedical, Irvine, CA, USA), as previously
described [42]. Prior to pooling, the concentration of each
sample was determined by agarose gel electrophoresis and
comparison to lambda DNA references of known concen-
tration (Invitrogen Inc, Carlsbad, CA, USA) with the aid of
the UVP Bioimaging System, and LabWorks Image Acqui-
sition and Analysis Software version 4.5 (UVP Inc,
Upland, CA, USA). All samples were normalized to a
standard concentration of 3 ng/µl and arrayed in an 8-by-
8 grid. Two-dimensional pools were created by combin-
ing all samples in shared rows and all samples in shared
columns as diagrammed in Figure 2.
Primer design, high throughput TILLING, gel analysis, and
mutation validation
Primers were selected using the CODDLe and Primer3
programs as previously described [37]. Forward and
reverse primers were 5'-end labeled with IRDye 700 and
IRDye 800 dye respectively. Custom synthesis of labeled
and unlabeled primers was performed by MWG Biotech
(Ebersberg, Germany). PCR, heteroduplex formation, het-
eroduplex digestion, and denaturing polyacrylamide gel
electrophoresis were performed as previously described
[42] with the following exceptions: 0.3 nanograms of
pooled genomic DNA was used per PCR reaction, and 1
unit of crude celery juice extract was used per heterodu-
plex digestion reaction [32]. TILLING gels were analyzed
with the aid of the GelBuddy semi-automated TILLING
and Ecotilling gel analysis software [43]. Mutations iden-
tified by TILLING were validated by conventional
sequencing as previously described [37]. The mutation
rate was calculated by dividing the total number of
observed mutations by the total surveyed DNA length
(length of TILLED fragment × individuals surveyed). We
subtracted 200 bp from each TILLED fragment to account
for the difficulty in detecting CELI-cut DNA products that
migrate in the top and bottom range of the gel. We have
previously determined that less than 10% of the muta-
tions expected to produce fragments that migrate in these
ranges are identified [18]. Of the 57 scored mutations, 3
were in the range masked for the frequency calculation.
Including the masked ranges in the calculation of total
surveyed DNA decreases the mutation density from 1/294
to 1/351 kb for EMS and from 1/265 to 1/316 kb for Az-
MNU.
Statistical analysis
The probability of concurrent DNA changes in the same
individual was calculated using the Poisson distribution
[44]. The spectrum of natural polymorphism in rice was
calculated using single nucleotide polymorphism (SNP)
data obtained by the in silico comparison of japonica and
indica rice sequences [33]. The first 62,051 SNPs involv-
ing base pair changes on chromosome 1 were counted
using the Microsoft Excel COUNTIF function yielding
19,614 GC->AT, 21,778 AT->GC, 5,356 GC->TA, 4,233
GC->CG, 5,276 AT->TA, and 5,794 AT->CG. The corre-
sponding fractions were 0.316, 0.351, 0.086, 0.068,
0.085, and 0.093. The expectations for natural polymor-
phisms were derived by multiplying the number of
changes observed by TILLING times the measured natural
fraction. The probability that the observed data fit the null
hypothesis of natural polymorphisms was tested using a 2
× 2 table (e.g. for EMS: observed, 19 GC->AT and 8 others;
expected 9 GC->AT and 18 others) and Fisher Exact test
[45]. The P value for the same or stronger association was
reported.
Authors' contributions
TT planned and headed the development of the mutant
populations. PC coordinated the experimental compo-
nents of population development. BT and JC oversaw the
high-throughput laboratory during DNA preparations,
arrays and mutation detection. BT designed and tested the
two-dimensional screening strategy. JC and EAG designed
and tested the primers. BT, JC, EAG, SH, and LC inter-
preted the mutation detection data. SH and LC co-
directed the high throughput STP laboratory. With TT,
they conceived the project and obtained the funding for it.
BT and LC were primarily responsible for drafting and
revising the manuscript with contributions from co-
authors. All authors read and approved the final manu-
script.
BMC Plant Biology 2007, 7:19 />Page 11 of 12
(page number not for citation purposes)
Acknowledgements
This work was supported by grant 2004-35604-14265 from USDA Coop-
erative State Research, Education and Extension Service, NRI Plant
Genome Program and in part by a grant from the Rockefeller Foundation.
We thank Darryl Aragones, Dariush Farzaneh and Tanisha Caravallo for
help in developing the TILLING populations, Faith Hassinger for her help
with designing and testing the two-dimensional screening strategy, Rob
Laport, Kim Young and Maggie Darlow for their work with DNA extrac-
tion, sample concentration normalization, and arraying, Elisabeth Bowers
for help with DNA extraction and mutation screening, Aaron Holm for
help with mutation screening, and Christine Codomo for sequencing muta-
tions and analyzing sequence trace data.
References
1. Goff SA, Ricke D, Lan TH, Presting G, Wang R, Dunn M, Glazebrook
J, Sessions A, Oeller P, Varma H, et al.: A draft sequence of the
rice genome (Oryza sativa L. ssp. japonica). Science 2002,
296:92-100.
2. Yu J, Hu S, Wang J, Wong GK, Li S, Liu B, Deng Y, Dai L, Zhou Y,
Zhang X, et al.: A draft sequence of the rice genome (Oryza
sativa L. ssp. indica). Science 2002, 296:79-92.
3. The map-based sequence of the rice genome. Nature 2005,
436:793-800.
4. Hirochika H, Guiderdoni E, An G, Hsing YI, Eun MY, Han CD, Upad-
hyaya N, Ramachandran S, Zhang Q, Pereira A, et al.: Rice mutant
resources for gene discovery. Plant Mol Biol 2004, 54:325-334.
5. An G, Jeong DH, Jung KH, Lee S: Reverse genetic approaches for
functional genomics of rice. Plant Mol Biol 2005, 59:111-123.
6. Kumar CS, Wing RA, Sundaresan V: Efficient insertional muta-
genesis in rice using the maize En/Spm elements. Plant J 2005,
44:879-892.
7. Jeong DH, An S, Park S, Kang HG, Park GG, Kim SR, Sim J, Kim YO,
Kim MK, Kim SR, et al.: Generation of a flanking sequence-tag
database for activation-tagging lines in japonica rice. Plant J
2006, 45:123-132.
8. Alonso JM, Stepanova AN, Leisse TJ, Kim CJ, Chen H, Shinn P, Ste-
venson DK, Zimmerman J, Barajas P, Cheuk R, et al.: Genome-wide
insertional mutagenesis of Arabidopsis thaliana. Science 2003,
301:653-657.
9. SIGnAL "T-DNA Express" Arabidopsis Gene Mapping Tool
[ />]
10. Pan X, Li Y, Stein L: Site preferences of insertional mutagenesis
agents in Arabidopsis. Plant Physiol 2005, 137:168-175.
11. Miki D, Itoh R, Shimamoto K: RNA silencing of single and multi-
ple members in a gene family of rice. Plant Physiol 2005,
138:1903-1913.
12. Wesley SV, Helliwell CA, Smith NA, Wang MB, Rouse DT, Liu Q,
Gooding PS, Singh SP, Abbott D, Stoutjesdijk PA, et al.: Construct
design for efficient, effective and high-throughput gene
silencing in plants. Plant J 2001, 27:581-590.
13. Kerschen A, Napoli CA, Jorgensen RA, Muller AE: Effectiveness of
RNA interference in transgenic plants. FEBS Lett 2004,
566:223-228.
14. Li X, Song Y, Century K, Straight S, Ronald P, Dong X, Lassner M,
Zhang Y: A fast neutron deletion mutagenesis-based reverse
genetics system for plants. Plant J 2001, 27:235-242.
15. Guenet JL: Chemical mutagenesis of the mouse genome: an
overview. Genetica 2004, 122:9-24.
16. Sega GA: A review of the genetic effects of ethyl methanesul-
fonate. Mutat Res 1984, 134:113-142.
17. Vogel EW, Natarajan AT: DNA damage and repair in somatic
and germ cells in vivo. Mutat Res 1995, 330:183-208.
18. Greene EA, Codomo CA, Taylor NE, Henikoff JG, Till BJ, Reynolds
SH, Enns LC, Burtner C, Johnson JE, Odden AR, et al.: Spectrum of
chemically induced mutations from a large-scale reverse-
genetic screen in Arabidopsis. Genetics 2003, 164:731-740.
19. McCallum CM, Comai L, Greene EA, Henikoff S: Targeted screen-
ing for induced mutations. Nat Biotechnol 2000, 18:455-457.
20. Comai L, Henikoff S: TILLING: practical single-nucleotide
mutation discovery. Plant J 2006, 45:684-694.
21. Henikoff S, Comai L: Single-nucleotide mutations for plant
functional genomics. Annu Rev Plant Biol 2003, 54:375-401.
22. Wienholds E, van Eeden F, Kosters M, Mudde J, Plasterk RH, Cuppen
E: Efficient target-selected mutagenesis in zebrafish. Genome
Res 2003, 13:2700-2707.
23. Perry JA, Wang TL, Welham TJ, Gardner S, Pike JM, Yoshida S, Parni-
ske M: A TILLING reverse genetics tool and a web-accessible
collection of mutants of the legume Lotus japonicus. Plant
Physiol 2003, 131:866-871.
24. Till BJ, Reynolds SH, Weil C, Springer N, Burtner C, Young K, Bowers
E, Codomo CA, Enns LC, Odden AR, et al.: Discovery of induced
point mutations in maize genes by TILLING. BMC Plant Biol
2004, 4:12.
25. Gilchrist EJ, Haughn GW: TILLING without a plough: a new
method with applications for reverse genetics. Curr Opin Plant
Biol 2005, 8:211-215.
26. Winkler S, Schwabedissen A, Backasch D, Bokel C, Seidel C, Bonisch
S, Furthauer M, Kuhrs A, Cobreros L, Brand M, et al.: Target-
selected mutant screen by TILLING in Drosophila. Genome
Res 2005, 15:718-723.
27. Wu JL, Wu C, Lei C, Baraoidan M, Bordeos A, Madamba MR, Ramos-
Pamplona M, Mauleon R, Portugal A, Ulat VJ, et al.: Chemical- and
Irradiation-induced Mutants of Indica Rice IR64 for Forward
and Reverse Genetics. Plant Mol Biol 2005, 59:85-97.
28. Slade AJ, Fuerstenberg SI, Loeffler D, Steine MN, Facciotti D: A
reverse genetic, nontransgenic approach to wheat crop
improvement by TILLING. Nat Biotechnol 2005, 23:75-81.
29. Gilchrist EJ, O'neil NJ, Rose AM, Zetka MC, Haughn GW: TILLING
is an effective reverse genetics technique for Caenorhabditis
elegans. BMC Genomics 2006, 7:262.
30. Szarejko I, Maluszynski M: High frequency of mutations after
mutagenic treatment of barley seeds with NaN3 and MNH
with application of inter-incubation germination period.
Mutation Breed Newslet 1999, 44:28-30.
31. Till BJ, Colbert T, Codomo C, Enns L, Johnson J, Reynolds SH,
Henikoff JG, Greene EA, Steine MN, Comai L, et al.: High-through-
put TILLING for Arabidopsis. Methods Mol Biol 2006,
323:127-135.
32. Till BJ, Burtner C, Comai L, Henikoff S: Mismatch cleavage by sin-
gle-strand specific nucleases. Nucleic Acids Res 2004,
32:2632-2641.
33. Feltus FA, Wan J, Schulze SR, Estill JC, Jiang N, Paterson AH: An SNP
resource for rice genetics and breeding based on subspecies
indica and japonica genome alignments. Genome Res 2004,
14:1812-1819.
34. Richardson KK, Richardson FC, Crosby RM, Swenberg JA, Skopek
TR: DNA base changes and alkylation following in vivo expo-
sure of Escherichia coli to N-methyl-N-nitrosourea or N-
ethyl-N-nitrosourea. Proc Natl Acad Sci USA 1987, 84:344-348.
35. Shioyama Y, Gondo Y, Nakao K, Katsuki M: Different mutation
frequencies and spectra among organs by N-methyl-N-nitro-
sourea in rpsL (strA) transgenic mice. Jpn J Cancer Res 2000,
91:482-491.
36. Caldwell DG, McCallum N, Shaw P, Muehlbauer GJ, Marshall DF,
Waugh R: A structured mutant population for forward and
reverse genetics in Barley (Hordeum vulgare L.). Plant J 2004,
40:143-150.
37. Till BJ, Reynolds SH, Greene EA, Codomo CA, Enns LC, Johnson JE,
Burtner C, Odden AR, Young K, Taylor NE, et al.: Large-scale dis-
covery of induced point mutations with high-throughput
TILLING. Genome Res 2003, 13:524-530.
38. Fortini P, Calcagnile A, Di Muccio A, Bignami M, Dogliotti E: Quan-
titative relationship between ethylated DNA bases and gene
mutation at two loci in CHO cells. Environ Mol Mutagen 1993,
21:154-159.
39. Pastink A, Heemskerk E, Nivard MJ, van Vliet CJ, Vogel EW: Muta-
tional specificity of ethyl methanesulfonate in excision-
repair-proficient and -deficient strains of Drosophila mela-
nogaster. Mol Gen Genet 1991, 229:213-218.
40. Olsen O, Wang X, von Wettstein D: Sodium azide mutagenesis:
preferential generation of A.T >G.C transitions in the bar-
ley Ant18 gene. Proc Natl Acad Sci USA 1993, 90:8043-8047.
41. Comai L, Young K, Till BJ, Reynolds SH, Greene EA, Codomo CA,
Enns LC, Johnson JE, Burtner C, Odden AR, et al.: Efficient discov-
ery of DNA polymorphisms in natural populations by Ecotill-
ing. Plant J 2004, 37:778-786.
42. Till BJ, Colbert T, Tompa R, Enns LC, Codomo CA, Johnson JE, Rey-
nolds SH, Henikoff JG, Greene EA, Steine MN, et al.: High-through-
Publish with BioMed Central and every
scientist can read your work free of charge
"BioMed Central will be the most significant development for
disseminating the results of biomedical research in our lifetime."
Sir Paul Nurse, Cancer Research UK
Your research papers will be:
available free of charge to the entire biomedical community
peer reviewed and published immediately upon acceptance
cited in PubMed and archived on PubMed Central
yours — you keep the copyright
Submit your manuscript here:
/>BioMedcentral
BMC Plant Biology 2007, 7:19 />Page 12 of 12
(page number not for citation purposes)
put TILLING for functional genomics. Methods Mol Biol 2003,
236:205-220.
43. Zerr T, Henikoff S: Automated band mapping in electro-
phoretic gel images using background information. Nucleic
Acids Res 2005, 33:2806-2812.
44. SISA-Poisson [ />]
45. SISA-Fisher Exact [ />]
46. Taylor NE, Greene EA: PARSESNP: A tool for the analysis of
nucleotide polymorphisms. Nucleic Acids Res 2003,
31:3808-3811.
47. Ng PC, Henikoff S: SIFT: Predicting amino acid changes that
affect protein function. Nucleic Acids Res 2003, 31:3812-3814.
![Tài liệu Báo cáo khoa học: Expression of two [Fe]-hydrogenases in Chlamydomonas reinhardtii under anaerobic conditions doc](https://media.store123doc.com/images/document/14/br/hw/medium_hwm1392870031.jpg)