báo cáo khoa học: " A high-throughput screening system for barley/powdery mildew interactions based on automated analysis of light micrographs" docx
Bạn đang xem bản rút gọn của tài liệu. Xem và tải ngay bản đầy đủ của tài liệu tại đây (886.29 KB, 9 trang )
BioMed Central
Page 1 of 9
(page number not for citation purposes)
BMC Plant Biology
Open Access
Research article
A high-throughput screening system for barley/powdery mildew
interactions based on automated analysis of light micrographs
Alexander Ihlow*
1,2
, Patrick Schweizer
2
and Udo Seiffert
1
Address:
1
Pattern Recognition Group, IPK Gatersleben, Corrensstr. 3, D-06466 Gatersleben, Germany and
2
Transcriptome Analysis Group, IPK
Gatersleben, Corrensstr. 3, D-06466 Gatersleben, Germany
Email: Alexander Ihlow* - ; Patrick Schweizer - ; Udo Seiffert -
* Corresponding author
Abstract
Background: To find candidate genes that potentially influence the susceptibility or resistance of
crop plants to powdery mildew fungi, an assay system based on transient-induced gene silencing
(TIGS) as well as transient over-expression in single epidermal cells of barley has been developed.
However, this system relies on quantitative microscopic analysis of the barley/powdery mildew
interaction and will only become a high-throughput tool of phenomics upon automation of the
most time-consuming steps.
Results: We have developed a high-throughput screening system based on a motorized
microscope which evaluates the specimens fully automatically. A large-scale double-blind
verification of the system showed an excellent agreement of manual and automated analysis and
proved the system to work dependably. Furthermore, in a series of bombardment experiments an
RNAi construct targeting the Mlo gene was included, which is expected to phenocopy resistance
mediated by recessive loss-of-function alleles such as mlo5. In most cases, the automated analysis
system recorded a shift towards resistance upon RNAi of Mlo, thus providing proof of concept for
its usefulness in detecting gene-target effects.
Conclusion: Besides saving labor and enabling a screening of thousands of candidate genes, this
system offers continuous operation of expensive laboratory equipment and provides a less
subjective analysis as well as a complete and enduring documentation of the experimental raw data
in terms of digital images. In general, it proves the concept of enabling available microscope
hardware to handle challenging screening tasks fully automatically.
Background
Recent molecular methods have paved the way for a
number of new experimental approaches in life science
which were not available several years ago. As a matter of
fact, these new techniques exceed the capacity of well-
established manual or scantily automated analysis by far.
Automated high-throughput analysis techniques not only
solve this problem – they generally introduce a less sub-
jective, more reproducible, and potentially more accurate
data processing. However, competing with intuitive and
trainable human skills, even though only for a rather spe-
cific problem, often turns out to be a difficult task.
This paper introduces a fully automated high-throughput
screening system which has been developed for support-
Published: 23 January 2008
BMC Plant Biology 2008, 8:6 doi:10.1186/1471-2229-8-6
Received: 13 August 2007
Accepted: 23 January 2008
This article is available from: />© 2008 Ihlow et al; licensee BioMed Central Ltd.
This is an Open Access article distributed under the terms of the Creative Commons Attribution License ( />),
which permits unrestricted use, distribution, and reproduction in any medium, provided the original work is properly cited.
BMC Plant Biology 2008, 8:6 />Page 2 of 9
(page number not for citation purposes)
ing a functional genomics approach in the field of plant-
pathogen interactions.
In order to directly assess gene function in barley and
wheat suffering from biotic stress caused by the powdery
mildew fungus Blumeria graminis, a transient assay system
based on bombarded leaf epidermis was developed and
proved to be useful [1-4]. This system, which can be used
for transient overexpression of genes as well as for tran-
sient-induced gene silencing (TIGS), has recently been fur-
ther developed using GATEWAY technology in order to
enhance throughput [5]. In the experiments, young barley
leaves are bombarded with DNA-coated gold particles
which confer transient expression of desired genes. For
analysis purposes, the beta-glucuronidase (GUS) reporter
gene is co-expressed in cells that were hit by the particle
bombardment. This stains the genetically transformed
cells greenish blue and allows their identification by
bright field microscopy. In the evaluation of the experi-
ments, haustoria of the powdery mildew have to be
detected inside these stained, genetically transformed
cells, as they indicate a successful penetration by the fun-
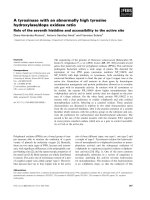
gus. A cutout of a typical micrograph, containing a well
stained, transformed cell with one haustorium is depicted
in Figure 1. By evaluating several hundred transformed
cells per test gene, the susceptibility of the cells to the fun-
gus is assessed in terms of the susceptibility index
A significant increase or decrease of this index indicates a
relation of the test gene to the plant's defense mechanism.
Manual screening has been done for a large number of
experiments and this proved to be a tedious and very
time-consuming mission. The desired screening of thou-
sands of candidate genes would require many person
years without automation. Relegating this task to a fully
automated high-throughput screening system offers a
number of advantages: Besides saving labor, the subjective
component of the human observer is replaced by deter-
ministic image analysis algorithms. Due to the autono-
mous operation, continuous activity (24/7) becomes
possible, leading to a higher utilization degree of expen-
sive laboratory equipment. Last but not least, the intrinsic
storage of the experimental raw data as digital images pro-
vides a complete and enduring documentation of the
experiments for further reference.
Results and discussion
Screening pipeline
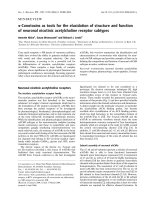
The hardware basis is a motorized, computer-operated
light-optical microscope (Axioplan 2 imaging, Carl Zeiss,
Germany), including an xy-stage for up to eight slides and
a CCD camera (AxioCam HRc, Carl Zeiss, Germany). Fig-
ure 2 depicts the hardware. The microscope is controlled
by the vendor's software AxioVision. Automation is
achieved by a script program which operates AxioVision
via its optionally available Visual Basic for Applications
(VBA) interface. This script program also provides a
graphical user interface where the experimenter para-
metrizes and starts the screening. It cooperates with a set
of specifically developed stand-alone image analysis pro-
grams, which subsequently evaluate the images directly
after acquisition. The resulting screening pipeline consists
of two main domains: image acquisition and image anal-
ysis. First, let us focus on important aspects of the image
acquisition and their consequences for the design of the
system.
SI =
number of infected transformed cells
total number of tra
nnsformed cells
.
(1)
Microscope hardwareFigure 2
Microscope hardware. The hardware basis of the devel-
oped high-throughput screening system is a motorized, com-
puter-operated light-optical microscope (left). The xy-table
can carry up to 8 slides (right).
Light micrograph of prepared barley leaf epidermisFigure 1
Light micrograph of prepared barley leaf epidermis.
Epidermal cell tissue with a well stained, genetically trans-
formed cell and a salient haustorium. In the enlarged region
of interest, the cell boundary and the haustorium are marked
in black and red, respectively.
BMC Plant Biology 2008, 8:6 />Page 3 of 9
(page number not for citation purposes)
To realize a fully automated specimen analysis, interesting
regions on the slide must first be identified, before
detailed images of these regions can be generated. A naive
complete high-resolution scanning is out of the question
due to the tight time constraints of a high-throughput sys-
tem. Therefore, the screening is divided into two main
temporal passes, namely a preview scan and a subsequent
detailed scan. During the preview scan, an overview image
of each slide is generated by assembling together coarse
resolution images (432 × 342 pixels) of low magnification
(5× objective). To cover the entire slide, 15 horizontal
times 38 vertical steps are necessary, leading to 570
subimages per slide. After the positions of transformed
cells are identified, the detailed scan starts. Subsequently,
the microscope changes to the 10× objective and acquires
high-resolution images (1300 × 1030 pixels) of each
requested position. To overcome the limited depth of
field, images of several foci are necessary. Five focal layers
of 7
μ
m distance proved to be sufficient to provide a sharp
reproduction of all details. The described pipeline is illus-
trated in Figure 3 as a flow chart.
Time constraints
From the user's perspective, an important aspect is the
expentiture of time for a screening. Here the limiting fac-
tor is the image acquisition, which is dependent on the
microscope hardware, whereas the subsequent image
analysis proves to be noncritical on current computer
hardware. Table 1 summarizes the time required for the
individual image acquisition steps. Note that these num-
bers are expected to decrease significantly on future micro-
scope hardware. With our current configuration we are
able to load the microscope three times a day (7 am,
about noon, and about 4 pm) each with eight slides,
whereby the last run completes in the evening.
System output and intermediate results
After processing the detailed images, the system primarily
provides the susceptibility indices according to Equation
(1) for each scanned slide in terms of the number of
infected transformed cells and the total number of trans-
formed cells. The detailed description of necessary image
processing and pattern recognition algorithms might be
of limited interest for potential users, but fundamental for
researchers and developers who need to completely
understand the system. Therefore, at this point we give an
illustrative overview of the image analysis and refer the
reader to the method section for a detailed disquisition.
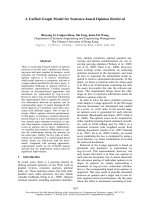
Figure 4 exemplarily shows three typical stained cells, in
which both the left and the centered cell contain a haus-
torium. Figure 5 illustrates the results of the automated
image analysis, consisting of three main steps: First, the
cell segmentation finds transformed cells in the image and
provides the exact cell boundary (displayed in black
color). Afterwards, the haustoria segmentation detects
potential haustoria (displayed inside the cell by their con-
Screening pipelineFigure 3
Screening pipeline. After inserting the slides onto the xy-stage, the screening is started in the control program. The final
output are the susceptibility indices for each slide in terms of the number of infected transformed cells over the total number
of transformed cells according to Equation (1).
Complete scan of each slide at
small magnification (5x-objective)
Scan of interesting regions at
large magnification (10x-objective)
Image acquisition
Image analysis
Analysis of preview images
• Detection of interesting regions
Analysis of detailed images
• Segmentation of transformed cells
• Segmentation of potential haustoria
• Classification of potential haustoria
Preview images Detailed images
Susceptibility index for each slideXY positions of interesting regions
Preview scan Detailed scan
Start
BMC Plant Biology 2008, 8:6 />Page 4 of 9
(page number not for citation purposes)
tours). As a last step, each segmented object is validated by
the haustoria classification as to whether it is truly a haus-
torium or a false positive object. In the sketch, this is illus-
trated by the object's colors: Objects classified as haustoria
are marked in red, other objects appear green. There are
rare cases, in which even an experienced expert is in doubt
about the classification of questionable objects. The same
holds for the system: The middle cell contains an object
(displayed as a blue contour) which can neither be classi-
fied as haustorium nor as other object. As it would be
done in case of a manual screening, cells without a relia-
ble decision will be excluded from the calculation of the
susceptibility index.
System validation
Benchmarking the system gives evidence about its reliabil-
ity. One problem, the rather variable staining intensity of
the transformed cells, can be dealt with by sophisticated
image processing algorithms to detect these properly. But
the generally low contrast of haustoria as well as the
occurrence of salient discolorations in the stained cells
preclude a naive haustoria detection solely on weak color
differences to the staining. For a reliable classification, we
applied machine-learning techniques which are trained
on a reference data set previously labeled by an expert
human observer. Based on this manually labeled data set,
we investigated a classification accuracy of 95 ± 1%.
Ultimately, the screening system has to meet the stand-
ards of meticulous manual evaluation. As an exhaustive
verification, we performed a large-scale double-blind test:
A number of 45 experiments, each consisting of two
microscopic slides with hundreds of transformed cells,
were manually screened by one human expert by counting
both the number of infected transformed cells (which
contain at least one haustorium) and the total number of
transformed cells. According to Equation (1), this gives a
certain susceptibility index. Additionally, the slides were
screened by the automated system and the susceptibility
index was calculated using the automatically derived clas-
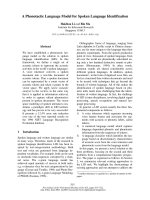
sification results. Plotting the susceptibility indices for
each experiment against each other, Figure 6 shows the
congruence in the results of both analysis methods.
Clearly, we do not know the true susceptibility indices
since both the system and the human observer are not
infallible and errors may occur from both parts. However,
the strong accordance of automated and human analysis
with a correlation coefficient R > 0.9 indicates that the sys-
tem works dependably.
From the biological point of view, only large changes of
the susceptibility index are significant and must be relia-
bly detected by the system. Evidently, this goal is reached
in practice.
Screening for gene discovery
The automated analysis system was used for a TIGS
screening of more than 300 defense-related candidate
genes previously found to be up-regulated in pathogen-
attacked barley epidermis. As a positive control for RNAi
efficiency, a construct targeting the Mlo gene was also
included, which is expected to phenocopy resistance
mediated by recessive loss-of-function alleles such as
mlo5. As shown in Figure 7, TIGS of the different barley
candidate genes resulted in a broad range of relative sus-
ceptibility indices, and many within the "extrema" groups
could be reproduced in four additional, independent rep-
etitions (data to be published elsewhere). Importantly,
the relative susceptibility indices that resulted from the
RNAi construct targeting Mlo were clustered at the more
Typical examples of transformed cellsFigure 4
Typical examples of transformed cells. Both the left and the centered cell contain one haustorium of the powdery mil-
dew fungus.
Table 1: Expenditure of time for image acquisition
Action 1st pass: preview scan (5×-objective, 432 × 342 pixels) 2nd pass: detailed scan (10×-objective, 1300 × 1030 pixels)
stage positioning ≈ 0.5 s ≈ 1 s
auto focus negligible (once per slide) ≈ 3 s
single shot ≈ 0.7 s ≈ 1.5 s
several focal layers 5 layers per position
time expenditure
≈ 10 min per slide (scanning 15 × 38 = 570 positions) ≈ 20 min per slide (scanning ≈ 100 positions*)
*A number of 100 positions is an average, depending on the actual quantity of transformed cells on the slide.
BMC Plant Biology 2008, 8:6 />Page 5 of 9
(page number not for citation purposes)
resistant side of the spectrum, as reported previously for
manually scored TIGS experiments using the same con-
struct [5]. This provided proof of concept for a usefulness
of the automated system for de-novo discovery of genes
affecting the barley/powdery mildew interaction.
Conclusion
The described high-throughput screening system enables
a large-scale analysis of candidate genes regarding the
resistance of crop plants against the powdery mildew fun-
gus by automating very time-consuming screening tasks.
Proved to work dependably and at operational stage now,
it provides a novel tool of medium- to high-throughput
phenomics in the crop plant barley allowing researchers
to address gene function in host- or nonhost interactions
for resistance. A single experimenter is expected to test up
to 100 candidate genes per person month, which is
approximately two orders of magnitude higher than
whole-plant approaches in barley such as stable trans-
genic plants or TILLING mutants. Currently, the system is
established in a number of projects at our research insti-
tute as well as at international cooperating partners.
As a general conclusion, the developed solution can be
understood as a proof of concept of how to extend already
available microscope hardware to handle challenging
screening tasks fully automatically by bringing together
research and development both from the fields of biology
and engineering. Of course, this concept is neither limited
to the described application nor to the currently used
microscope hardware. In the future, the system will be
adapted to further challenges and we will focus also on
screening problems incorporating fluorescence micros-
copy. This paper should encourage other researchers to
tackle analogous screening tasks in a similar way.
Methods
Having explained the general system concept, its time
constraints, and reliability, we will now discuss in detail
the image analysis. This information is essential to com-
pletely understand the functioning of the system in assess-
ing the infection status of transformed cells by haustoria.
The image analysis pipeline is illustrated in Figure 8 and
will be presented here in detail. Firstly, the specimen prep-
aration is considered.
TIGS screening
The screening was carried out in seven-day-old susceptible
barley plants of cv. Golden Promise, as described in [5].
Briefly, leaf segments were bombarded by gold particles
that had been coated with a mixture of pUbiGUS (reporter
plasmid) and pIPKTA30 Target (RNAi plasmid) using a
PDS 1000/He system (Bio-Rad, Munich, Germany). Three
days after the bombardment, leaf segments were inocu-
lated with Blumeria graminis f. sp. hordei and incubated for
another 40 h, followed by staining of transformed cells for
beta-glucuronidase (GUS) activity and microscopy.
Cell segmentation
Due to the performed staining (cf. Figures 1 and 4), hue is
an apparent feature to discriminate between the trans-
formed cells and the surrounding epidermal tissue. To
cope with the large variability of the staining intensity and
to detect also regions with very weak dyestuff expression,
Correlation between manual and automated analysisFigure 6
Correlation between manual and automated analy-
sis. In this evaluation, 45 experiments (each consisting of two
microscopic slides) were analyzed by a human expert as well
as by the automated system. Measured quantity is the sus-
ceptibility index SI, which is given by Equation (1).
0 0.1 0.2 0.3 0.4 0.5
0
0.1
0.2
0.3
0.4
0.5
manual
automated
Automatically generated sketches of the cell images of Figure 4Figure 5
Automatically generated sketches of the cell images of Figure 4. The cell boundary appears in black. Objects classified
as haustoria are marked in red, other objects in green, ambiguous objects in blue.
BMC Plant Biology 2008, 8:6 />Page 6 of 9
(page number not for citation purposes)
we use an edge detection approach [6,7]. As an intermedi-
ate result, the stained cells are marked by a closed contour.
To refine this recognition and to properly detect the exact
cell boundary, more sophisticated techniques are applied
afterwards: First, the rectangular region of interest con-
taining the stained cell is transformed into an adaptive
color space [8], incorporating the Expectation Maximiza-
tion (EM) algorithm [9,10] for parameter estimation.
Compared to hue, this adaptive color space provides a
better discriminatory power between the staining and the
color of the surrounding tissue. It is applied to the previ-
ously detected regions of interest only, because of its high
computational cost. Subsequently, based on the adaptive
color space the estimated approximate cell boundary con-
tour is moved towards the nearby true edge of the stained
cell using an active contour model. Following the classical
formulation according to Kass et al. [11], we implemented
a new, computationally more efficient numerical solution
scheme [12]. The result is illustrated in Figure 9: Initial-
ized with the rough contour (depicted in the left image),
the active contour model finally provides the accurate cell
boundary (depicted in the right image). This high effort to
gain exactly the cell boundary is justified due to salient
discolorations of the cell wall, which occasionally show
the same color features as potential haustoria. They would
interfere during the next processing step and must be
removed in advance.
Haustoria segmentation
Having isolated the stained, genetically transformed cells,
potential haustoria must be detected therein. Generally,
both haustoria and other salient objects exhibit a slightly
more saturated color than the remaining cell area. Exploit-
ing this feature, we perform the following heuristic: First,
a contrast enhancement via morphological top-hats [13]
is applied on the color image of the cell cutout. Since mor-
phological top-hats operate contrarily by extracting objects
which cannot contain the structuring element, a rectangu-
lar or disk-shaped structuring element being somewhat
larger than a haustorium is appropriate. (Actually, we use
Image analysis pipelineFigure 8
Image analysis pipeline. This figure is a more detailed description of the corresponding box of Figure 3.
Cell segmentation
• Find region of interest
• Transform rectangular
region of interest into
adaptive color space
• Detect exact cell boundary
Haustoria segmentation
• Enhance contrast of the
segmented cell image via
morphological operations
• Binarize enhanced image
based on color saturation
Haustoria classification
• Extract shape features
• Transform feature vector
into one dimension via LDA
• Classifiy object on axis of
maximum discriminance
Analysis of detailed images
Results of an automated TIGS screeningFigure 7
Results of an automated TIGS screening. The screening comprised ≈ 300 defense-related candidate genes (displayed as
blue bars). As a positive control for RNAi efficiency, a construct targeting the Mlo gene was also included (displayed as red
bars). As to be expected, the relative susceptibility indices that resulted from the RNAi construct targeting Mlo were clustered
at the more resistant side of the spectrum.
0
100
200
300
400
500
600
Experiments, sorted according to their relative susceptibility indices
Relative SI (% of control)
RNAi of candidate genes
RNAi of mlo gene
BMC Plant Biology 2008, 8:6 />Page 7 of 9
(page number not for citation purposes)
a disk-shaped structured element of 37 pixels diameter.)
This leads to a content-adaptive contrast enhancement,
increasing the saliency of potential haustoria regions
while preserving the saliency of the remaining cell area.
Second, the color saturation of the enhanced image cutout
is taken as feature image for the segmentation. Salient
regions are extracted by a region growing segmentation
starting from seeds which exceed a certain high threshold
until falling below a second, low threshold. This is effi-
ciently realized by using a binary morphological recon-
struction method [14]. We describe this haustoria
segmentation process in detail in [15].
At this stage, where the stained cells have been segmented
and potential objects that might be haustoria have been
marked, the image processing part is completed. Looking
back at Figures 4 and 5 we now have obtained a sketch of
the color images, representing the objects of interest. As a
last milestone, the identified potential haustoria regions
must be classified into true haustoria and false positive
objects. In Figure 5 this is illustrated by the color, where
haustoria are marked in red.
Haustoria classification
To transfer the expert knowledge, enabling the human
observer to detect haustoria, to the machine, distinctive
features of the considered objects are extracted and fed
into an appropriate classifier. In general, the composition
of an adequate feature vector is the most important step to
obtain a good classification performance. Furthermore,
the selected features have to be considered in relation to
the subsequent classification technique. In [16] we tested
several feature combinations on sophisticated classifiers
and drew the conclusion that a classification accuracy of
more than 90% is possible.
Due to an improved feature preprocessing we recently
simplified the solution by enabling the use of a linear clas-
sifier. Confinement to an uncomplex classifier has the
advantage of being independent of further specifications
such as neural network topologies, training algorithms,
learning rates, or other parameters. In addition, there is
the least risk of overfitting. To reach this aim, the feature
vector is adapted by nonlinear transformations in
advance. As an example, consider incorporating the
object's perimeter P and area A. For a given object, both
features are related nonlinearly by A ~ P
2
. Hence, it can
help a linear classifier to adapt to this feature vector when
the object area is incorporated as , as the former non-
linear correlation of both features is thus linearized. Such
a nonlinear preprocessing can also be done for more
sophisticated features.
In order to train a classifier onto the extracted features, a
representative data set is needed which contains samples
of virtually all possible cases both of the classes "hausto-
rium" and "other object". Therefore, we manually anno-
tated a large set of digital images containing transformed
cells with and without haustoria and stopped when the
data set comprised 500 objects for each class.
Shape features for haustoria recognition
In order to complement the color features which have
already been exploited during the segmentation, we must
now focus on the object's shape. For haustoria recogni-
tion, the features must reflect a class of specifically shaped
objects, consisting of a body with "fingers". Therefore,
beside basic shape descriptors such as the object's area, its
contour length, or principal axes, we incorporate two
sophisticated approaches: moment invariants [17,18] and
Fourier descriptors [19].
As appropriate moment invariants, we use the set
ψ
1
ψ
11
introduced by Flusser [18]. To enable their use with a lin-
ear classifier, the following transformation is applied:
Moment invariants can be derived both from a gray-level
image and a binarized image. We incorporate the invari-
ants of both the binary image and the color sat-
uration image, leading to 22 features.
In addition to region-based features, we further use a set
of contour-based features in terms of Cartesian Fourier
descriptors [19]. Therefore, the x- and y-coordinates of the
A
ψψ ξ
ξ
ii
i
==with
111
26881212410101616
{,,,,,,,,,,}.
(2)
ψψ
111
Cell segmentation via an active contourFigure 9
Cell segmentation via an active contour. The approximate cell boundary found by edge detection (left) is iteratively
refined by moving the contour towards the true edge of the stained cell (right).
BMC Plant Biology 2008, 8:6 />Page 8 of 9
(page number not for citation purposes)
sampled contour of length N are taken as complex num-
bers z
n
= x
n
+ j y
n
(n = 0 N -1) and the periodic sequence
is represented by its spectral coefficients
, also known as Fourier
descriptors. The set
is invariant to shifting due to omitting the descriptor
and invariant to scaling due to normalization by . Fur-
thermore it is invariant to rotation due to using the abso-
lute value of the complex Fourier coefficients. In fact, this
power spectrum describes the contour in terms of its auto-
correlation features – its linear self-similarity. Since the
spectrum decays rapidly towards higher frequencies we
use the following equalization and introduce the trans-
formed Fourier descriptors
In the feature vector we use , which leads to 27
features due to omitting and . So far, composed of
moment invariants and Fourier descriptors, the feature set
is scale invariant, i.e., the information about the object's
size is not contained. This changes through the incorpora-
tion of the square root of object area , the object
perimeter P, and the major and minor axis length a and b,
respectively. Additionally, we consider the normalized
multiscale bending energy (NMBE) Ψ [20,21] in terms of
and the mean color saturation S as features.
Together with the 22 moment invariants and the 27 Fou-
rier descriptors this finally leads to a set of 55 features.
After normalizing the feature vector to zero mean and unit
variance by applying the standard score (also called z-
score or normal score) transformation [22], it is ready for
the actual classification.
Classification
In [16] we have, inter alia, used the linear discrimant anal-
ysis (LDA) [22] as a feature reduction technique. The LDA
linearly weights the input features in such a way that the
output dimension exhibits maximum discriminatory
power. Inititally developed by Fisher [23], it is extended in
[24] to multiple output dimensions by building an
orthonormal system yielding maximum discriminatory
power in each dimension. The resulting transformed,
reduced feature set can be applied to any classification
algorithm. In case the classes are linearly separable, the
LDA itself is sufficient already for classification. Due to the
previously applied nonlinear feature transformations we
have successfully generated this ideal configuration: In
Figure 10 the projection of all 55 features onto two
dimensions via LDA is depicted. Both dimensions show a
high correlation. Incorporating a third discriminant axis
would show a similar highly-correlated scenario in 3-D.
As a result, classification based on the axis of maximum
discriminatory power is sufficient, i.e., simply a separa-
tion threshold needs to be applied to the 1st discriminant
axis (cf. Figure 10).
For estimating the expected classification performance on
unknown data, the representative data set needs to be par-
titioned into a training subset and a disjoint test subset
[25]. We randomly partitioned the data set and used one
half for training the classifier and the other half for testing.
To obtain a stable informational value, this partitioning,
training, and testing was performed in terms of 500 differ-
ent realizations. As a result, we obtained a classification
accuracy of 95 ± 1%.
ˆ
/
Zz
N
n
nN
n
N
ν
πν
=
−
=
−
∑
1
2
0
1
e
j
ˆ
ˆ
ˆ
()
ˆ
ˆ
ˆ
ˆ
ˆ
ˆ
ˆ
Z
n
Z
Z
n
Z
Z
Z
Z
Z
Z
n
Z
−
−−
−
⎡
⎣
⎢
⎢
⎢
⎤
⎦
⎥
⎥
2
1
2
1
2
1
2
1
2
1
2
2
2
1
2
2
1
2
⎥⎥
ˆ
Z
0
ˆ
Z
1
ˆ
ˆ
ˆ
Z
Z
Z
ν
ν
ν
=
1
1
(3)
ˆˆ
…
ZZ
−14 14
ˆ
Z
0
ˆ
Z
1
AA=
ΨΨ= 1/
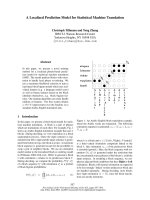
Object classification by linear discriminant analysisFigure 10
Object classification by linear discriminant analysis.
The 55-dimensional feature space, in which both haustoria
and other objects are described, is reduced to two dimen-
sions. The linear discriminant analysis (LDA) projects the
data onto axes of maximum discriminatory power. Both
dimensions are highly correlated, so that considering multiple
linear discriminant axes yields no benefit. Hence, the 1st axis
is sufficient for classification.
−0.4 −0.3 −0.2 −0.1 0 0.1 0.2 0.3 0.4
−0.4
−0.3
−0.2
−0.1
0
0.1
0.2
0.3
0.4
1st linear discriminant axis
2nd linear discriminant axis
← separation threshold
other objects
haustoria
Publish with BioMed Central and every
scientist can read your work free of charge
"BioMed Central will be the most significant development for
disseminating the results of biomedical research in our lifetime."
Sir Paul Nurse, Cancer Research UK
Your research papers will be:
available free of charge to the entire biomedical community
peer reviewed and published immediately upon acceptance
cited in PubMed and archived on PubMed Central
yours — you keep the copyright
Submit your manuscript here:
/>BioMedcentral
BMC Plant Biology 2008, 8:6 />Page 9 of 9
(page number not for citation purposes)
At the end of this analysis pipeline, all necessary informa-
tion is available to distinguish infected cells from unin-
fected ones. Cells are considered as infected if there is at
least one object classified as a haustorium.
Authors' contributions
AI developed the screening system. PS coordinated and
mentored the biological part of the development. US
coordinated and mentored the engineering part of the
development. All authors read and approved the final
manuscript.
Acknowledgements
We thank Stefanie Lück, Manuela Knauft, Gabi Brantin, and Dimitar
Douchkov for their support concerning the preparation of the specimens
and the manual screening. Many thanks to Ralf Tautenhahn, Christian
Schulze, Tobias Senst, Martin Kalev, and Burkhard Steuernagel for support-
ing the system development as well as to Cornelia Brüß, Felix Bollenbeck,
Tobias Czauderna, Rainer Pielot, and Marc Strickert for fruitful discussions.
This work was supported by the German Ministry of Education and
Research (BMBF) under grant 0312706A.
References
1. Shen QH, Saijo Y, Mauch S, Biskup C, Bieri S, Keller B, Seki H, Ülker
B, Somssich IE, Schulze-Lefert P: Nuclear activity of MLA
immune receptors links isolate-specific and basal disease-
resistance responses. Science 2007, 315(5815):1098-1103.
2. Zimmermann G, Bäumlein H, Mock HP, Himmelbach A, Schweizer P:
The multigene family encoding germin-like proteins of bar-
ley. Regulation and function in basal host resistance. Plant
Physiology 2006, 142:181-192.
3. Dong W, Nowara D, Schweizer P: Protein polyubiquitination
plays a role in basal host resistance of barley. The Plant Cell
2006, 18:3321-3331.
4. Panstruga R: A golden shot: How ballistic single cell transfor-
mation boosts the molecular analysis of cereal-mildew inter-
actions. Molecular Plant Pathology 2004, 5(2):141-148.
5. Douchkov D, Nowara D, Zierold U, Schweizer P: A high-through-
put gene-silencing system for the functional assessment of
defense-related genes in barley epidermal cells. Molecular
Plant-Microbe Interactions (MPMI) 2005, 18(8):755-761.
6. Canny JF: A computational approach to edge detection. IEEE
Transactions on Pattern Analysis and Machine Intelligence (PAMI) 1986,
8(6):679-698.
7. Ihlow A, Seiffert U: Microscope color image segmentation for
resistance analysis of barley cells against powdery mildew. 9.
Workshop "Farbbildverarbeitung", ZBS Zentrum für Bild- und Signalverar-
beitung e.V. Ilmenau, Report Nr. 3/2003 Ostfildern-Nellingen, Germany
2003:59-66.
8. Ihlow A, Seiffert U: Adaptive color spaces based on multivari-
ate Gaussian distributions for color image segmentation. 12.
Workshop "Farbbildverarbeitung", ZBS Zentrum für Bild- und Signalverar-
beitung e.V. Ilmenau, Ilmenau, Germany 2006:86-96.
9. Bilmes JA: A gentle tutorial of the EM algorithm and its appli-
cation to parameter estimation for Gaussian mixture and
hidden Markov models. In Tech Rep ICSI-TR-97-021 University of
Berkeley; 1997.
10. Ihlow A, Seiffert U: Automating microscope colour image anal-
ysis using the Expectation Maximisation algorithm. Pattern
Recognition: 26th DAGM Symposium, Volume LNCS 3175 of Lecture Notes
in Computer Science 2004:536-543 [ />tent/ufaq4c9gdma7d19q/]. Tübingen, Germany: Springer
11. Kass M, Witkin A, Terzopoulos D: Snakes: Active contour mod-
els. International Journal of Computer Vision 1988, 1(4):321-331.
12. Ihlow A, Seiffert U: Snakes revisited – speeding up active con-
tour models using the Fast Fourier Transform. In Proceedings
of the Eighth IASTED International Conference on Intelligent Systems and
Control (ISC 2005) Cambridge, MA, USA; 2005:416-420.
13. Soille P: Morphological Image Analysis 2nd edition. Berlin: Springer;
2004.
14. Vincent L: Morphological grayscale reconstruction in image
analysis: Applications and efficient algorithms. IEEE Transac-
tions on Image Processing 1993, 2(2):176-201.
15. Ihlow A, Seiffert U: Haustoria segmentation in microscope col-
our images of barley cells. In 10. Workshop "Farbbildverarbeitung"
Edited by: Droege D, Paulus D. Koblenz: Der andere Verlag;
2004:119-126.
16. Tautenhahn R, Ihlow A, Seiffert U: Adaptive feature selection for
classification of microscope images. Fuzzy Logic and Applications:
6th International Workshop, WILF 2005, Crema, Italy, September 15–17,
2005, Revised Selected Papers, Volume LNAI 3849 of Lecture Notes in Arti-
ficial Intelligence 2006:215-222 [ />m441755p245l1521/]. Springer
17. Hu MK: Visual pattern recognition by moment invariants. IRE
Transactions on Information Theory 1962, 8(2):179-187.
18. Flusser J: On the independence of rotation moment invari-
ants. Pattern Recognition 2000, 33(9):1405-1410.
19. van Otterloo PJ: A contour-oriented approach to digital shape
analysis. In PhD thesis TU Delft; 1988.
20. Cesar RM Jr, Costa LdF: Application and assessment of multi-
scale bending energy for morphometric characterization of
neural cells. Review of Scientific Instruments 1997, 68(5):2177-2186.
21. Young IT, Walker JE, Bowie JE: An analysis technique for biolog-
ical shape I. Information and Control 1974, 25(4):357-370.
22. Duda RO, Hart PE, Stork DG: Pattern Classification New York: John
Wiley & Sons; 2001.
23. Fisher RA: The use of multiple measurements in taxonomic
problems. Annals of Eugenics 1936, 7(Part II):179-188.
24. Duchene J, Leclercq S: An optimal transformation for discrimi-
nant and principal component analysis. IEEE Transactions on Pat-
tern Analysis and Machine Intelligence (PAMI) 1988, 10(6):978-983.
25. Bishop CM: Neural Networks for Pattern Recognition Oxford: Oxford
University Press; 1995.