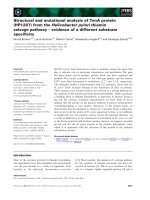
báo cáo khoa học: " Global gene expression analysis of apple fruit development from the floral bud to ripe fruit" pot
Bạn đang xem bản rút gọn của tài liệu. Xem và tải ngay bản đầy đủ của tài liệu tại đây (1.33 MB, 29 trang )
BioMed Central
Page 1 of 29
(page number not for citation purposes)
BMC Plant Biology
Open Access
Research article
Global gene expression analysis of apple fruit development from the
floral bud to ripe fruit
Bart J Janssen*
1
, Kate Thodey
2
, Robert J Schaffer
1
, Rob Alba
3,8
,
Lena Balakrishnan
4
, Rebecca Bishop
5
, Judith H Bowen
1
, Ross N Crowhurst
1
,
Andrew P Gleave
1
, Susan Ledger
1
, Steve McArtney
6
, Franz B Pichler
7
,
Kimberley C Snowden
1
and Shayna Ward
1
Address:
1
The Horticulture and Food Research Institute of New Zealand Ltd., Mt Albert, Private Bag 92169, Auckland Mail Centre, Auckland 1142,
New Zealand,
2
John Innes Centre, Colney Lane, Norwich NR4 7UH, UK,
3
Boyce Thompson Institute for Plant Research, Tower Road, Cornell
University Campus, Ithaca, NY 14853, USA,
4
22 Ramphal Terrace, Khandallah, Wellington, New Zealand,
5
4 La Trobe Track, RD2 New Lynn,
Karekare, Auckland, New Zealand,
6
Department of Horticultural Science, North Carolina State University, Mountain Horticultural Crops Research
and Extension Centre, 455 Research Drive, Fletcher, NC 28732-9244, USA,
7
Microbial Ecology & Genomics Lab, School of Biological Sciences,
University of Auckland, Auckland, New Zealand and
8
Monsanto Company – O3D, Product Safety Center, 800 North Lindbergh Blvd., St. Louis,
MO 63167, USA
Email: Bart J Janssen* - ; Kate Thodey - ;
Robert J Schaffer - ; Rob Alba - ; Lena Balakrishnan - ;
Rebecca Bishop - ; Judith H Bowen - ;
Ross N Crowhurst - ; Andrew P Gleave - ;
Susan Ledger - ; Steve McArtney - ; Franz B Pichler - ;
Kimberley C Snowden - ; Shayna Ward -
* Corresponding author
Abstract
Background: Apple fruit develop over a period of 150 days from anthesis to fully ripe. An array representing
approximately 13000 genes (15726 oligonucleotides of 45–55 bases) designed from apple ESTs has been used to study
gene expression over eight time points during fruit development. This analysis of gene expression lays the groundwork
for a molecular understanding of fruit growth and development in apple.
Results: Using ANOVA analysis of the microarray data, 1955 genes showed significant changes in expression over this
time course. Expression of genes is coordinated with four major patterns of expression observed: high in floral buds;
high during cell division; high when starch levels and cell expansion rates peak; and high during ripening. Functional
analysis associated cell cycle genes with early fruit development and three core cell cycle genes are significantly up-
regulated in the early stages of fruit development. Starch metabolic genes were associated with changes in starch levels
during fruit development. Comparison with microarrays of ethylene-treated apple fruit identified a group of ethylene
induced genes also induced in normal fruit ripening. Comparison with fruit development microarrays in tomato has been
used to identify 16 genes for which expression patterns are similar in apple and tomato and these genes may play
fundamental roles in fruit development. The early phase of cell division and tissue specification that occurs in the first 35
days after pollination has been associated with up-regulation of a cluster of genes that includes core cell cycle genes.
Conclusion: Gene expression in apple fruit is coordinated with specific developmental stages. The array results are
reproducible and comparisons with experiments in other species has been used to identify genes that may play a
fundamental role in fruit development.
Published: 17 February 2008
BMC Plant Biology 2008, 8:16 doi:10.1186/1471-2229-8-16
Received: 13 September 2007
Accepted: 17 February 2008
This article is available from: />© 2008 Janssen et al; licensee BioMed Central Ltd.
This is an Open Access article distributed under the terms of the Creative Commons Attribution License ( />),
which permits unrestricted use, distribution, and reproduction in any medium, provided the original work is properly cited.
BMC Plant Biology 2008, 8:16 />Page 2 of 29
(page number not for citation purposes)
Background
Fruit-bearing crop species are an important component of
the human diet providing nutrition, dietary diversity and
pleasure. Fruit are typically considered an enlarged organ
that surrounds the developing seeds of a plant, or the rip-
ened ovary of a flower together with any associated acces-
sory parts [1]. The development and final form of the
fruiting body is widely varied, ranging from minimally
expanded simple dehiscent (non-fleshy) fruit of the
model plant Arabidopsis, through expanded ovaries of
tomato, to complex fruiting organs with several different
expanded tissues, such as found in the pome fruit [1].
Common to all fruit is the developmental process that
results in expansion of tissue near the seed in a coordi-
nated manner with seed development (usually, but not
always, enclosing the seed). At early stages during devel-
opment (both before and after successful fertilization, and
sometimes in the absence of fertilization) the fruit tissue
undergoes several rounds of cell division, followed (usu-
ally) by cell expansion during which the fruit stores
metabolites and energy, in the form of starch or sugars
(e.g. tomato development [2-4]). Subsequently, usually
after the seeds mature, the fruit undergoes a series of bio-
chemical changes that convert starches into more availa-
ble and attractive compounds, such as sugars, as well as
producing volatile secondary metabolites that are thought
to function as attractants for animals or insects which dis-
perse the seed.
Morphological and physiological studies of fruit have led
to considerable understanding of the physical and bio-
chemical events that occur as fruit mature and ripen
[1,3,5], however it is only relatively recently that genomic
approaches have been used to investigate fruit develop-
ment [4,6-9]. As a result of excellent genetic resources and
the application of molecular and genomic approaches,
tomato has become the best studied indehiscent fruit.
Domestication of tomatoes has resulted in the increase of
fruit size from a few grams to varieties 1000-fold larger
[10]. The physiological events leading to the expansion of
the ovary wall of the tomato flower and in particular the
events that occur around tomato ripening have been well
described (for reviews see Gillaspy et al. [2]; Giovanonni
[3]). More recently, molecular approaches have been used
to study global gene expression in tomato [11-13] allow-
ing identification of large numbers of genes potentially
involved in fruit development and ripening.
In other fruit crops, microarrays have been used to exam-
ine gene expression during the development and in partic-
ular the ripening of fruits such as strawberry [6], peach
[14], pear [15], and grape [8,9]. These studies have identi-
fied genes involved in fruit flavour and genes associated
with distinct stages of fruit development.
Apples (Malus × domestica Borkh. also known as M. pum-
ila) are members of the Rosaceae family, sub family
pomoideae, which includes crop species such as pear, rose
and quince. Members of the pomoideae have a fruit that
consists of two distinct parts: an expanded ovary corre-
sponding to the "core" which is homologous to the
tomato fruit; and the cortex or edible portion of the fruit
which is derived from the fused base of stamens, petals
and sepals [1,16], which expands to surround the ovary.
Fruit develop over a period of 150 days from pollination
to full tree ripeness with a simple sigmoidal growth curve
[17,18]. Physiological studies of apple fruit development
have focused on measures of ripeness such as colour
changes and breakdown of starch to form the palatable
sugars. From such studies, it has been shown that floral
buds contain a small amount of starch that is metabolized
quickly after pollination. Starch levels then build up in
fruit coordinate with cell expansion. At about 100 days
after pollination starch levels begin to decline again and
fruit sugars increase, until the fruit are fully ripe [19]. Like
tomato, apple undergoes an ethylene-dependent ripening
stage [20,21] and transgenic apples with reduced ethylene
production fail to produce skin colour changes and
appear to lack production of volatile compounds typically
associated with apples [22].
Apple is functionally a diploid with 2n = 34 and a genome
of moderate size (1C = 2.25 pg [23] which corresponds to
approximately 1.5 × 10
9
bp) making genomic approaches
to the study of its biology reasonable. Recently an EST
sequencing approach has been used to identify apple
genes [24]; unigenes derived from this sequencing project
were used to design the oligonucleotides used in this
work. Two groups have published apple microarray anal-
yses [22,25]. Lee et al. [25] used a 3484 feature cDNA
array to identify 192 apple cDNAs for which expression
changes during early fruit development. Using the same
~13000 gene (15726 feature) apple oligonucleotide array
described in this paper, Schaffer et al. [22] identified 944
genes in fruit that respond to ethylene treatment and asso-
ciated changes in gene expression with changes in fruit
volatiles.
In the work described in this paper, microarrays have been
used to study the developmental processes occurring dur-
ing fruit formation from pollination to full tree ripeness.
In pome fruit both core (ovary) and cortex (hypanthium)
tissues expand. Understanding the regulation of the
events required to produce a complex apple fruit, includ-
ing the division and expansion of cells from different flo-
ral structures is the ultimate aim of this work. Using
microarrays we show that large groups of genes are co-
ordinately expressed at specific stages of fruit develop-
ment. We have identified cell division genes for which
expression coincides with the period of cell division in
BMC Plant Biology 2008, 8:16 />Page 3 of 29
(page number not for citation purposes)
apple fruit and have identified starch metabolic enzymes
likely to be involved as fruit store and then metabolize
starch. Using a comparative approach we have identified
a number of genes for which expression patterns are sim-
ilar in both apple and tomato fruit development and may
be involved in similar fundamental processes in fruit
development.
Results
Microarray analysis of apple fruit development
When apple trees (Malus domestica 'Royal Gala') were at
full bloom (greater than 50% of buds open) individual
fully open flowers were tagged and trees separated into
two biological replicates (Rep1 and Rep2). Based on phys-
iological and morphological studies of apple fruit devel-
opment [17,19] eight time points were selected for
sampling (Figure 1). The first sample 0 Days After Anthe-
sis (DAA) was taken at the same time that fully open flow-
ers were tagged. The 14 and 25 DAA sampling time points
coincide with the period of cell division that occurs after
pollination. At 35 DAA cell division has ceased, the rate of
cell expansion increases and starch accumulation begins.
60 DAA coincides with the greatest rate of cell expansion
and starch accumulation. By 87 DAA the rate of cell
expansion has declined but cell expansion continues at a
reduced rate until full ripeness, starch levels peak shortly
after this timepoint. In the year in which the samples were
taken harvest ripeness was at 132 DAA, at this stage starch
levels are rapidly declining and fruit sugars increasing,
skin colour is still changing and while some flavour com-
pounds are present full "apple flavour" has not yet devel-
oped. By 146 DAA fruit were "tree ripe" at this stage fruit
have strong colour and have fully developed flavour,
almost all the starch present has been converted into fruit
sugars and some flesh softening has occurred. While
developmental events that occur prior to full bloom are
significant in the developmental program leading to the
final fruit, samples prior to full bloom were not consid-
ered in this work. RNA was extracted from samples from
both replicates, labelled and hybridized to an array of
15726 oligonucleotides (45–55 bases long) designed
from 15145 unigenes representing approximately 13000
genes. All samples were compared (using a dye swap
design) to genomic DNA (gDNA) as a common reference,
making samples directly comparable, the absolute expres-
sion of all the samples is shown in Additional file 1.
Four major groups of co-ordinately expressed genes during
fruit development
To examine global changes in gene expression, 8719
genes which changed in expression during fruit develop-
ment (genes with greater than 5-fold change were
excluded in order to see the pattern from genes exhibiting
smaller changes, inclusion of these genes did not alter the
pattern of expression seen for the majority of genes) were
grouped using hierarchical clustering and visualized by
plotting expression in 3-dimensional space (Figure 2A
and 2B). This global analysis of the microarray shows four
major patterns of coordinated gene expression. A group of
genes was identified with expression in floral buds but are
down-regulated throughout fruit development, a second
group of genes was up-regulated early in development
and down-regulated later, two additional groups of genes
were up-regulated during the middle stages of develop-
ment and during ripening. By contrast with the results
seen for tomato [13], there was no sharp change in global
expression patterns at ripening, but this difference is likely
to reflect differences in sampling.
To identify those genes that changed expression signifi-
cantly, a one way ANOVA (model y = time) was applied
to the entire dataset. Using a non-adaptive false discovery
rate (FDR) control [26] of 0.01, 1986 features were iden-
tified (corresponding to 1955 genes) where gene expres-
sion changed significantly during fruit development.
Hierarchical clustering identified four groups of genes
with similar patterns of expression during fruit develop-
ment (Figure 2C, and Additional file 1, which lists the
entire dataset). The full bloom (FB) cluster contained 314
genes (315 features) with high expression at 0 DAA and
then low expression during the rest of fruit development.
The early fruit development (EFD) cluster contained 814
genes (819 features) where expression peaked between 14
and 35 DAA. The EFD cluster consisted of two weaker sub-
clusters: EFD1, a group of 320 genes (326 features) which
had high expression early and then very low expression
later in development; and EFD2 a group of 493 genes
(493 features) with high expression early and moderate
expression later in development. The mid development
cluster (MD) contained 168 genes (169 features) with
expression peaking at 60 and 87 DAA and low expression
at other stages of development. The ripening cluster (R)
contains 668 genes (681 features) with expression low ini-
tially and eventually peaking late in fruit development.
The R cluster could be clustered into three further sub-
clusters: R1 70 genes (70 features) where expression
peaked at harvest ripe (132 DAA) and was low at other
stages of development; R2 191 genes (195 features) where
expression was very low throughout development until
tree ripe (146 DAA); and R3 406 genes (408 features)
where expression peaked at tree ripe (146 DAA) but some
expression was present at earlier stages of development.
Both approaches to clustering identified four major
groups of co-ordinately expressed genes suggesting these
correspond to major phases of fruit development.
Validation of microarray expression by quantitative RT-
PCR
To examine the reliability of gene expression patterns
identified from the microarray we used quantitative
BMC Plant Biology 2008, 8:16 />Page 4 of 29
(page number not for citation purposes)
reverse transcriptase-PCR (qRT-PCR) to examine steady-
state RNA levels during fruit development. Genes for qRT-
PCR were initially selected from the list of genes that sig-
nificantly changed their expression during fruit develop-
ment. The list of regulated genes was ordered from most
significant to least significant and genes for qRT-PCR
selected at regular intervals from this list (approximately
every 50
th
gene). Several genes were also chosen for qRT-
PCR to confirm expression patterns of genes in particular
pathways (see below). Three housekeeping genes were
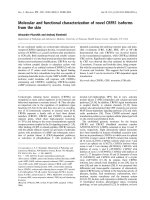
Apple fruit developmentFigure 1
Apple fruit development. Apple fruit at various stages of development. A, 0 DAA, B, 14 DAA, C, 35 DAA, D, 60 DAA, E,
87 DAA, F, 132 DAA, G, 146 DAA. H, diagram of fruit development showing the timing of major physiological events and the
sampling time points, adapted from [17–19]. Ripening is shown as a solid and dashed red, solid from the time of the climacteric
and dashed for events prior to the climacteric. Bar = 1 cm.
0 14 25 35 60 87 132 146
Days after anthesis (DAA)
Cell division
Cell expansion
Peak rate of cell expansion
Starch accumulation
Starch decline
Ripening
ABCD
EF G
H
BMC Plant Biology 2008, 8:16 />Page 5 of 29
(page number not for citation purposes)
used to normalize qRT-PCR results: an actin gene (Gen-
bank accession CN927806
); a GAPDH gene (Genbank
accession CN929227
) and a gene of unknown function
which was selected on the basis of low variability in
microarray experiments (Genbank accession CN908822
).
qRT-PCR expression profiles were compared with micro-
array expression profiles (Figure 3) and scored as match-
ing if they agreed at all developmental stages or if the
majority of stages were in agreement and the significant
changes in expression also agreed. By these criteria 74%
(26 out of 35) of genes had the same pattern of expression
in the microarray experiment as in the qRT-PCR experi-
ment. Interestingly no relationship was observed between
the reproducibility of the expression pattern and the sig-
nificance of the microarray data as determined by
ANOVA.
Genes in different functional classes are expressed at
different times during fruit development
To examine the changes in gene function that were occur-
ring during fruit development, functional classes for the
apple genes were identified using the Arabidopsis protein
function classification defined by the Munich Informa-
tion center for Protein Sequences (MIPS, using the funcat-
1.3 scheme [27]). For all the apple genes represented on
the array, the Arabidopsis gene with the best sequence
similarity based on BLAST analysis was selected [28], with
a threshold expect value of 1 × e
-5
, and MIPS functional
categories for that Arabidopsis gene assigned to the apple
gene. This relatively non-stringent threshold was chosen
in order to obtain functional classifications for the major-
ity of apple genes on the array. Table 1 shows the number
of apple genes, the number of genes with Arabidopsis
matches, the number of matches to unique Arabidopsis
genes and the number of MIPS functional categories for
the entire array, for the 1986 features selected as changing
during fruit development, and for the clusters and sub-
clusters.
The distribution of functional categories for the entire
array is shown in Table 2 and compared with the distribu-
tion of the 1955 genes selected as changing significantly
during fruit development, the major clusters and the sub-
clusters. The distribution of MIPS functional categories
changes between the whole array and the genes selected as
changing during fruit development suggest that the genes
selected are not a random selection from the array as a
whole. For example, there appears to be a higher represen-
tation of genes associated with metabolism in the fruit
development genes (20.3% vs 16.1% for the whole array)
suggesting developing fruit are more active metabolically.
Interestingly, there is a slight increase in the unclassified
category in the selected fruit development genes 16.7% vs
15.7% for the whole array, while in the ripening cluster
the unclassified category is under-represented compared
to other clusters (15.2% vs 17.4 to 17.8%), which may
reflect the amount of research focused on identifying and
characterizing genes involved in the late stages of ripening
as compared with early events in fruit development.
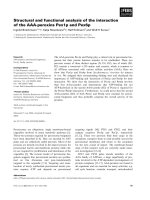
Clustering of genes changing during fruit developmentFigure 2
Clustering of genes changing during fruit develop-
ment. Cluster analysis of gene expression. A and B, Expres-
sion patterns for the whole array were clustered and then
plotted in 3-D space (MATLAB, version 6.0; The Math-
works). Genes with no expression changes or with greater
than 5 fold changes were excluded, leaving 8719 genes. y-axis
shows fold change. C, The 1955 developmentally regulated
genes selected by ANOVA (FDR = 0.01) were clustered by
their geometric means. Vertical lines represent transcript
level observed for each EST from 0 to 146 DAA, minimum
expression (yellow), maximum (red). Major clusters are: flo-
ral bud or full bloom (FB); early fruit development (EFD);
mid-development (MD); and ripening (R). The EFD and R
clusters were further sub-clustered and indicated by EFD1,
EFD2, R1, R2 and R3.
DAA
0
14
25
35
60
87
132
146
Selected genes
MD R
R2 R1 R3
FB EFD
EFD1 EFD2
0
-5
5
0
20
40
60
80
100
120
140
160
10000
8000
6000
4000
2000
0
A
0
5
-5
10000
8000
6000
4000
2000
0
0
20
40
60
80
100
120
140
160
B
C
-4 -3 -2 -1 0 1 2 3 4
Selected genes
DAA
Selected ge
nes
DAA
-4 -3 -2 -1 0 1 2 3 4
Fold change
Fold change
BMC Plant Biology 2008, 8:16 />Page 6 of 29
(page number not for citation purposes)
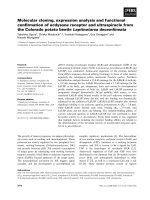
Validation of array expression patternsFigure 3
Validation of array expression patterns. The pattern of expression for a selection of ESTs was confirmed by quantitative
RT-PCR using primers designed close to the array oligo. Graphs show transcript levels from the array (solid lines) for Rep1
(filled diamonds) and Rep2 (open squares) compared with transcript levels from qRT-PCR (dashed lines, mean and standard
error for each sample) for Rep1 (filled diamonds) and Rep2 (open squares). X axes show DAA, the left Y axes show relative
qRT-PCR expression, the right Y axes show absolute array expression. The genbank accession is shown for each EST.
EB115521
0
5
10
15
20
25
30
35
050100
0
1
2
3
4
5
6
7
EE663834
0
20
40
60
80
100
120
140
160
050100
0.0
0.5
1.0
1.5
2.0
2.5
3.0
3.5
EBB142488
0
100
200
300
400
500
600
700
800
050100
0.0
0.5
1.0
1.5
2.0
2.5
3.0
3.5
4.0
CN883166
0
5
10
15
20
25
30
35
40
0 50 100
0.0
0.2
0.4
0.6
0.8
1.0
1.2
1.4
1.6
CNN87658
2
0.0
0.5
1.0
1.5
2.0
2.5
3.0
3.5
0 50 100
0.0
0.5
1.0
1.5
2.0
2.5
3.0
CN869994
0
5
10
15
20
25
30
0 50 100
0.0
0.2
0.4
0.6
0.8
1.0
1.2
1.4
1.6
CN878539
0
5
10
15
20
25
30
35
40
45
0 50 100
0.0
0.2
0.4
0.6
0.8
1.0
1.2
1.4
EB138209
0
20
40
60
80
100
120
050100
0
1
2
3
4
5
6
CN894184
0
5
10
15
20
25
30
35
40
45
50
0 50 100
0
1
2
3
4
5
6
EB140237
0
2
4
6
8
10
12
14
0 50 100
0.0
0.2
0.4
0.6
0.8
CN931994
0
1
2
3
4
5
6
7
8
9
10
0 50 100
0
1
2
3
4
5
6
7
CN874609
0
2
4
6
8
10
12
14
16
0 50 100
0.0
0.2
0.4
0.6
0.8
1.0
1.2
1.4
CN882408
0.0
0.5
1.0
1.5
2.0
2.5
3.0
050100
0.0
0.2
0.4
0.6
0.8
1.0
1.2
CN876312
0.0
0.5
1.0
1.5
2.0
2.5
3.0
3.5
050100
0
5
10
15
20
25
EB140203
0.0
0.5
1.0
1.5
2.0
2.5
3.0
3.5
050100
0
10
20
30
40
50
60
70
CN899848
0
5
10
15
20
25
30
35
050100
0.0
0.5
1.0
1.5
2.0
2.5
3.0
3.5
CN931474
0.0
0.5
1.0
1.5
2.0
2.5
050100
0.0
0.2
0.4
0.6
0.8
1.0
1.2
1.4
1.6
1.8
2.0
CN941270
0
2
4
6
8
10
12
14
16
0 50 100
0.0
0.2
0.4
0.6
0.8
1.0
1.2
1.4
EB134348
0
1
2
3
4
5
050100
0.0
0.5
1.0
1.5
2.0
2.5
EB122025
0
1
2
3
0 50 100
0
1
2
3
CN929977
0
1
2
3
4
0 50 100
0.0
0.5
1.0
1.5
2.0
2.5
EG631180
0
1
2
3
4
5
6
7
8
0 50 100
0
1
2
3
4
CN903005
0
1
2
3
4
0 50 100
0
1
2
3
CN946592
0
1
2
3
4
5
050100
0
1
2
3
CN940056
0
1
2
3
0 50 100
0.0
0.5
1.0
1.5
2.0
CN942749
0
1
2
3
4
5
6
7
0 50 100
0.0
0.2
0.4
0.6
EB143812
0
2
4
6
8
10
12
050100
0
2
4
6
8
10
EG631279
0
40
80
120
160
200
050100
0.0
0.5
1.0
1.5
EB116421
0
2
4
6
8
10
12
14
0 50 100
0
1
2
3
4
EG631302
0
1
2
3
4
5
0 50 100
0.0
0.5
1.0
1.5
2.0
2.5
CN893819
0.0
0.5
1.0
1.5
2.0
2.5
050100
0.0
0.2
0.4
0.6
0.8
CN911241
0
1
2
3
4
5
6
050100
0
1
2
3
CN945543
0
20
40
60
80
100
050100
0
5
10
15
20
25
CN903467
0
1
2
3
0 50 100
0.0
0.2
0.4
0.6
0.8
EB124137
0
40
80
120
160
200
0 50 100
0.0
0.4
0.8
1.2
1.6
2.0
BMC Plant Biology 2008, 8:16 />Page 7 of 29
(page number not for citation purposes)
Within the four major clusters, the genes with peak
expression in mid-development have a reduced represen-
tation of genes associated with metabolism (17.2% vs
20.1 to 21.5%) suggesting this stage of fruit development
might be less metabolically active or use fewer different
metabolic genes. In contrast, cellular transport and trans-
port mechanism functions are more highly represented in
the mid-development cluster (2.6% vs 1.6 to 1.8%) at the
time when fruit are taking up nutrients and water most
rapidly.
Control of cellular organization functions are represented
more in the EFD and MD clusters (3.8% and 4.6% vs
FB2.7% and R2.4%) consistent with this period being a
stage of fruit development where the structure of the fruit
cells is changing rapidly. In the ripening cluster there is an
over-representation of genes in the "energy" category
(4.5%) with the lowest representation in mid-develop-
ment (2.1%). In addition the R2 (peak expression at tree
ripe) sub-cluster is over-represented (compared with the
other ripening sub-clusters, R1 and R3) in the "metabo-
lism" category (25.4% vs 21.7 and 18.4%) correlating
with changes in energy and metabolism during late ripen-
ing.
One feature of note was the higher proportion of genes
with a cell cycle classification in the EFD cluster (FB 1.8%,
EFD 3.4%, MD 1.4%, R 1.9%). The EFD cluster contains
genes for which expression peaks in the first 30 days of
fruit development, the stage of development when cells
are dividing [17,18]. This developmental period involves
the division of specific cells to form the final apple fruit
shape and since there appeared to be an increase in cell
cycle associated genes during this period we identified the
genes associated with the cell cycle classification for each
cluster (FB 17 genes, EFD 61 genes, MD 8 genes, R 42
genes) and their annotations (Table 3). These lists are
likely to include those genes important in the regulation
of fruit size and shape. For example, analysis of these lists
identified three core cell cycle genes (see below), which
will be the focus of future research.
Expression of core cell cycle genes
From morphological studies apple fruit cells go through at
least four rounds of cell division during the first 30 days
after pollination with total cell number increasing 10 fold
[17,18]. At around 30 DAA the cells that make up the core
and cortex of the mature fruit stop dividing and the rate of
cell expansion increases. The control of cell division and
cell expansion is a key part of the developmental regula-
tion of fruit and is likely to affect final fruit size as well as
texture and the balance between tissue types.
Using an analysis of the Arabidopsis genome sequence,
Vanderpoele et al. [29] identified 61 core cell cycle genes;
this list has been expanded to 88 genes, including several
previously unrecognized groups [30]. Expression analysis
in Arabidopsis has demonstrated that many of these core
cell cycle genes have regulated steady state RNA levels
[30]. To determine if any of these core cell cycle genes
were regulated in fruit development, we identified apple
homologues and examined their expression. As fruit sam-
Table 1: Distribution of array features
Subset/cluster
a
ESTs
b
Apple genes
c
Apple genes with hit to Arabidopsis
d
Unique Arabidopsis genes
e
Functional categories
f
whole array 15726 15145 11949 8256 63732
Selected 1986 1983 1955 1442 1330 7523
FB 315 314 225 212 1141
EFD 819 812 603 566 3042
MD 169 168 126 124 653
R 681 668 495 474 2722
EFD1 326 320 236 220 1128
EFD2 493 493 368 356 1916
R1 70 70 54 53 300
R2 195 191 154 154 885
R3 408 406 284 277 1552
The table shows the number of genes on the whole array and within the clusters as well as the number of Arabidopsis homologues and the number
of MIPS function classifications identified.
a FB = full bloom; EFD = Early fruit development; MD = Mid-development; R = ripening; R1, R2, R3 = Ripening subclusters 1, 2 and 3; EFD1, EFD2
= early fruit development subclusters 1 and 2.
b The number of apple ESTs represented by the features on the array.
c The number of apple genes, tentative contigs or singletons identified by the ESTs on the array.
d Apple genes were compared with the Arabidopsis predicted protein set using BLASTx to identify similar Arabidopsis genes, the best match (with
expect value better than 1 × e
-5
) was used for subsequent functional analysis.
e The number of unique Arabidopsis genes identified by BLASTx using the apple genes, in many cases multiple apple genes had strongest similarity
to the same Arabidopsis gene, thus fewer Arabidopsis genes were identified than apple genes.
f Functional categories found for the Arabidopsis genes were identified using the MIPS dataset funcat 1.3.
BMC Plant Biology 2008, 8:16 />Page 8 of 29
(page number not for citation purposes)
ples were pooled from multiple fruit and because within
a fruit cell division is unlikely to be synchronized, we
would not expect to be able to detect variation of expres-
sion during the cell cycle. However any core cell cycle gene
that varied developmentally might be associated with the
control of cell division rates during fruit formation and
development.
Thirty-eight apple genes represented on the apple array
have strong sequence similarity to the 88 Arabidopsis cell
cycle genes identified by Menges et al. [30], using BLASTx
and manual examination of protein sequence alignments
(31 have expect value of 1 × e
-40
or better). Of these 38
apple genes, only three were in the 1955 genes selected by
ANOVA as changing significantly during fruit develop-
ment (Figure 4). ESTs 5126 (Genbank acc. EB107042
),
163128 (Genbank acc. CN943384
) and 173799 (Gen-
bank acc. EB141951
) all had high levels of expression
early in development which declined to relatively low lev-
els after 35 DAA. The three genes have sequence similarity
to the Arabidopsis genes At2g38620.1, At1g20930.1 and
At2g27960 (expect values of 1 × e
-146
, 1 × e
-150
and 6 × e
-
37
, respectively). At2G38620.1 is a CDKB1;2 homologue,
At1G20930.1 is a CDKB2;2 homologue and At2g27960 is
a CKS1 homologue, the two CDKB genes play roles in
progression of the cell cycle and the CKS gene is a mitosis
specific scaffold protein. At this level of sequence similar-
ity it is not possible to determine if the apple genes repre-
sent orthologues of these genes, although similarity of
function is likely.
Expression of genes associated with starch metabolism
Starch metabolism in apple fruit is a physiological process
with a well-defined developmental pattern [19]. However,
the mechanism by which starch levels are regulated in
plants is complex and little is known about how the activ-
ity and turnover of starch synthesis and degradation
enzymes are mediated in storage tissues such as fruits
(reviewed by Smith et al. [31]). To investigate whether
there is some regulation of starch metabolic enzymes at
the level of transcription in apple fruit, we examined the
patterns of expression for several enzymes involved in
starch metabolism. Arabidopsis enzymes involved in
starch turnover were identified from the starch and
Table 2: Functional classification
Mips code
a
Whole array
b
selected FB EFD MD R EFD1 EFD2 R1 R2 R3
Metabolism 1 16.1 20.3 21.5 20.1 17.2 20.9 18.3 21.1 21.7 25.4 18.4
Energy 2 2.9 3.4 3.0 2.8 2.1 4.5 2.2 3.1 3.0 5.0 4.4
Cell Cycle and DNA processing 3 2.9 2.5 1.8 3.4 1.4 1.9 3.3 3.5 0.7 1.9 2.4
Transcription 4 5.2 4.1 4.3 4.1 4.1 3.9 4.4 4.0 3.3 3.1 4.6
Protein synthesis 5 2.0 1.7 1.5 1.6 1.8 2.0 1.5 1.6 2.7 0.7 2.6
Protein fate 6 6.6 5.4 4.6 5.0 5.5 6.0 4.5 5.3 4.0 4.7 7.1
Cellular transport & mechanisms 8 2.4 1.7 1.8 1.6 2.6 1.7 2.1 1.3 0.7 1.7 1.8
Cellular comm/signaling 10 6.4 5.6 6.5 5.5 5.1 5.6 5.9 5.4 9.0 5.6 4.9
Cell rescue, defense & virulence 11 3.6 4.0 4.1 4.1 4.6 3.6 3.3 4.6 5.7 4.3 2.9
Regulation of/interaction with cellular
environment
13 1.7 1.6 2.1 1.7 2.8 1.1 1.7 1.7 0.3 1.1 1.3
Cell fate 14 3.2 2.6 2.3 2.5 1.5 3.2 2.4 2.6 3.7 2.6 3.3
Systemic regulation of/interaction with
environment
20 1.1 1.3 1.5 1.3 1.1 1.1 1.9 0.9 1.3 1.1 1.1
Development 25 1.0 1.2 1.2 1.4 1.1 0.9 1.2 1.5 2.0 0.6 0.8
Transposable elements, viral and plasmid
proteins
29 0.1 0.1 0.1 0.0 0.0 0.1 0.0 0.1 0.0 0.2 0.0
Control of cellular organisation 30 2.7 3.2 2.7 3.8 4.6 2.4 4.8 3.3 2.7 2.3 2.4
Subcellular localisation 40 19.1 18.1 15.9 17.4 19.8 19.2 17.5 17.4 16.0 18.0 20.5
Protein activity regulation 62 0.0 0.1 0.2 0.1 0.0 0.0 0.2 0.1 0.0 0.0 0.0
Protein with binding function or cofactor
requirement
63 3.2 2.9 2.7 2.8 4.4 2.8 2.3 3.1 2.3 3.1 2.7
Storage protein 65 0.1 0.0 0.1 0.0 0.0 0.0 0.1 0.0 0.0 0.1 0.0
Transport facilitation 67 3.9 3.6 4.4 3.2 2.9 3.7 3.4 3.1 3.0 4.3 3.7
Unclassified 98 or 99 15.7 16.7 17.8 17.4 17.5 15.2 19.1 16.4 18.0 14.2 15.1
The table shows the distribution of classifications as a percentage of the total number of classifications.
a Apple genes for each EST on the array were used to identify Arabidopsis homologues using BLAST with a cutoff of 1 e
-5
. Where a putative
homologue was identified, the Arabidopsis MIPS (Munich Information centre for Protein Sequences, funcat version 1.3) classification(s) for that gene
were applied to the apple EST.
b For the whole array, for the features selected as changing during fruit development, and for each of the clusters and sub-clusters the frequency of
occurrence for each functional category is shown as a percentage of the total number of functional categories for that cluster (or sub-cluster). FB =
Full bloom; EFD = early fruit development; MD = mid-development; R = ripening; R1, R2, R3 = the 3 ripening sub-clusters; EFD1, EFD2 = the 2
early fruit development sub-clusters.
BMC Plant Biology 2008, 8:16 />Page 9 of 29
(page number not for citation purposes)
Table 3: Annotation of cell cycle genes by cluster
FB cluster
EST Genbank acc. Best A. thaliana hit
a
e value Description
b
5019 CN936403 AT5G44680.1 1e-40 methyladenine glycosylase family protein
5126 EB107042
AT2G38620.1 9e-80 CDKB1;2 cell division control protein
33679 CN929052
AT2G47420.1 9e-18 dimethyladenosine transferase
59120 CN862228
AT5G42320.1 2e-12 zinc carboxypeptidase family protein
67405 CN864463
AT5G53000.1 3e-31 protein phosphatase 2A-associated 46 kDa protein
86932 EB119954
AT1G01490.1 2e-19 heavy-metal-associated domain-containing protein
124169 CN937737
AT1G18660.1 3e-67 zinc finger (C3HC4-type RING finger) family protein
134415 CN888558
AT3G62600.1 1e-153 DNAJ heat shock family protein
140667 CN938500
AT2G24490.1 8e-46 replication protein, putative
222173 CN876164
AT4G11010.1 9e-47 nucleoside diphosphate kinase 3, mitochondrial (NDK3)
226032 EG631233
AT3G08500.1 3e-48 myb family transcription factor (MYB83)
254247 CN912925
AT1G10290.1 3e-49 dynamin-like protein 6 (ADL6)
256645 EB151655
AT1G79350.1 1e-77 EMB1135 DNA-binding protein, putative
257305 CN908171
AT3G57550.1 3e-41 guanylate kinase 2 (GK-2)
258270 CN914773
AT2G30110.1 1e-179 ubiquitin activating enzyme 1 (UBA1)
264677 CN910366
AT3G48160.2 6e-68 E2F-like repressor E2L3 (E2L3)
264992 CN917058
AT5G23430.1 1e-53 transducin family protein/WD-40 repeat family protein
EFD cluster
EST Genbank acc. Best A. thaliana hit e value Description
12163 EB109178 AT3G28030.1 2e-27 UV hypersensitive protein (UVH3)
14094 CN931474
AT2G01440.1 6e-15 ATP-dependent DNA helicase, putative
15274 CN932236
AT3G25500.1 8e-26 FH2 domain-containing protein
19893 CN925129
AT1G73540.1 3e-11 ATNUDT21 MutT/nudix family protein
29516 EB111254
AT2G39730.1 9e-72 RuBisCO activase
31066 CN927871
AT3G23890.1 8e-13 DNA topoisomerase II
33027 CN928590
AT3G25500.1 3e-39 FH2 domain-containing protein
43417 EB113579
AT1G69770.1 3e-06 chromomethylase 3 (CMT3)
45185 CN857495
AT5G05510.1 2e-25 low similarity to SP:O60566 Mitotic checkpoint serine/threonine-protein kinase BUB1 β
62518 EB116342
AT3G08910.1 7e-67 DNAJ heat shock protein
64262 CN850169
AT2G30200.1 1e-148 T27E13_6
85474 CN869267
AT1G68760.1 6e-54 ATNUDT1 MutT/nudix family protein
91885 CN871666
AT1G10520.1 3e-15 DNA polymerase lambda (POLL)
93419 CN874495
AT5G26751.1 4e-58 shaggy-related protein kinase α/ASK-α (ASK1)
95093 CN875141
AT5G18110.1 5e-60 novel cap-binding protein (nCBP)
105540 CN886787
AT3G51770.1 1e-111 similar to tetratricopeptide repeat (TPR)-containing protein
111728 EB124553
AT1G44900.1 3e-50 DNA replication licensing factor
118006 EB125634
AT2G21790.1 8e-45 ribonucleoside-diphosphate reductase small chain, putative
119405 CN887179
AT1G68010.1 1e-81 glycerate dehydrogenase/NADH-dependent hydroxypyruvate reductase
120390 CN890521
AT1G21660.1 7e-12 low similarity to SP:O14976 Cyclin G-associated kinase
138266 CN937814
AT2G17120.1 3e-79 peptidoglycan-binding LysM domain-containing protein
142020 CN939277
AT2G38810.1 2e-48 histone H2A, putative
142920 EB127800
AT5G57850.1 2e-08 aminotransferase class IV family protein
148629 EB138792
AT3G22630.1 2e-36 20S proteasome β subunit D (PBD1) (PRGB)
149453 CN897394
AT5G55230.1 1e-118 ATMAP65-1 Binds and bundles microtubules
149668 CN897544
AT4G36080.1 1e-103 FAT domain-containing protein/phosphatidylinositol 3- and 4-kinase family protein
151134 EB139596
AT2G42580.1 5e-24 tetratricopeptide repeat (TPR)-containing protein
151602 CN898773
AT5G13780.1 8e-81 GCN5-related N-acetyltransferase, putative, similar to ARD1 subunit
152213 CN940414
AT2G35040.1 1e-112 AICARFT/IMPCHase bienzyme family protein
153604 EB140203
AT1G55350.1 0 EMB1275 calpain-type cysteine protease family
153992 CN900578
AT2G21790.1 1e-160 R1 ribonucleoside-diphosphate reductase small chain, putative
155385 CN901052
AT2G21790.1 2e-83 R1 ribonucleoside-diphosphate reductase small chain, putative
155966 CN901211
AT5G61060.1 2e-34 histone deacetylase family protein
159200 CN940759
AT2G14880.1 6e-36 SWIB complex BAF60b domain-containing protein
162529 CN942994
AT3G44110.1 1e-152 DNAJ heat shock protein, putative (J3)
BMC Plant Biology 2008, 8:16 />Page 10 of 29
(page number not for citation purposes)
163128 CN943384 AT1G20930.1 1e-102 CDKB2;2 cell division control protein, putative
163154 CN943405
AT5G61060.1 2e-84 histone deacetylase family protein
166835 EE663942
AT3G17880.1 1e-58 tetratricoredoxin (TDX)
170408 EB140959
AT3G08910.1 7e-59 DNAJ heat shock protein, putative
170963 CN882668
AT2G46225.1 2e-20 ABI1L1 Encodes a subunit of the WAVE complex
171493 CN883039
AT2G29570.1 1e-111 PCNA2 proliferating cell nuclear antigen 2 (PCNA2)
172325 CN883596
AT5G08020.1 7e-91 similar to replication protein A1 (Oryza sativa)
173799 EB141951
AT2G27960.1 6e-37 CKS1 cyclin-dependent kinase
180731 CN904791
AT1G75690.1 2e-55 chaperone protein dnaJ-related
181072 CN904980
AT3G18190.1 0 chaperonin, putative
184975 EB148197
AT5G44680.1 1e-90 methyladenine glycosylase family protein
186444 EB149644
AT3G19420.1 2e-12 MLD14.22
186960 EB150084
AT3G08690.1 9e-27 ubiquitin-conjugating enzyme 11 (UBC11), E2
213416 EB157314
AT1G62990.1 1e-126 homeodomain transcription factor (KNAT7)
220588 EB132350
AT3G48590.1 2e-15 CCAAT-box binding transcription factor Hap5a, putative
220604 CN948726
AT4G33260.1 8e-17 WD-40 repeat family protein
245977 CN903005
AT3G26730.1 1e-49 zinc finger (C3HC4-type RING finger) family protein
256235 CN913864
AT2G31320.1 0 NAD(+) ADP-ribosyltransferase, putative
256449 CN916743
AT3G22890.1 1e-165 sulfate adenylyltransferase 1/ATP-sulfurylase 1 (APS1)
257853 CN914478
AT5G52640.1 0 heat shock protein 81-1 (HSP81-1)
261756 CN908391
AT2G25050.1 5e-07 formin homology 2 domain-containing protein
264654 CN910347
AT5G67100.1 5e-87 DNA-directed DNA polymerase α catalytic subunit, putative
265667 CN910570
AT5G16270.1 3e-06 Rad21/Rec8-like family protein
266414 EB152178
AT5G40010.1 1e-112 AAA-type ATPase family protein
315707 CN915704
AT1G03080.1 4e-25 kinase interacting family protein
318786 CN949202
AT1G04820.1 4e-63 tubulin α-2/α-4 chain (TUA4)
Mid dev cluster
EST Genbank acc. Best A. thaliana hit e value Description
109011 CN880656 AT1G29400.1 4e-77 RNA recognition motif (RRM)-containing protein
144884 CN894104
AT1G03190.1 1e-33 DNA repair protein/transcription factor protein (UVH6)
146572 CN895134
AT2G15580.1 2e-14 zinc finger (C3HC4-type RING finger) family protein
167024 EG631355
AT5G66770.1 0 scarecrow transcription factor family protein
182020 EB143575
AT1G69840.1 3e-73 band 7 family protein
185452 EB148668
AT1G07350.1 1e-31 transformer serine/arginine-rich ribonucleoprotein, putative
214774 CN946063
AT1G26830.1 1e-75 CUL3 Cullin, putative, similar to Cullin homolog 3 (CUL-3)
268033 CN918413
AT5G64610.1 1e-142 histone acetyltransferase, putative
Ripening cluster
EST Genbank acc. Best A. thaliana hit e value Description
541 CN934040 AT3G57220.1 1e-113 UDP-GlcNAc:dolichol phosphate N-acetylglucosamine-1-phosphate transferase, putative,
11629 EB109003
AT1G34260.1 1e-07 phosphatidylinositol-4-phosphate 5-kinase family protein
15678 CN932487
AT5G51600.1 3e-85 microtubule associated protein (MAP65/ASE1) family protein
57477 CN860296
AT2G44270.1 1e-164 contains Pfam profile PF01171: PP-loop family
59442 CN862410
AT1G73460.1 1e-35 protein kinase family protein Pfam:PF00069
64262 CN850169
AT2G30200.1 1e-148 expressed protein T27E13_6
64821 CN863160
AT5G51570.1 1e-141 band 7 family protein
68274 CN864737
AT5G26940.1 3e-59 exonuclease family protein
89547 CN873630
AT3G61140.1 2e-09 COP9 signalosome complex subunit 1/CSN complex subunit 1
89732 EB121320
AT4G12600.1 8e-18 ribosomal protein L7Ae/L30e/S12e/Gadd45 family protein
93568 CN874587
AT3G10940.1 1e-108 similar to protein phosphatase PTPKIS1 protein
107778 CN871562
AT1G77600.1 6e-07 expressed protein, weak similarity to Pds5
111901 CN879476
AT1G14400.1 1e-39 ubiquitin-conjugating enzyme 1 (UBC1), E2
130406 CN891639
AT3G27180.1 5e-08 expressed protein MYF5.5
132758 CN892125
AT5G48330.1 9e-55 regulator of chromosome condensation (RCC1) family protein
134470 CN888599
AT2G29900.1 2e-35 presenilin family protein
141926 CN939221
AT5G50960.1 1e-163 similar to Nucleotide-binding protein 1 (NBP 1)
143463 CN890171
AT1G69670.1 9e-75 ATCUL3B cullin, putative
Table 3: Annotation of cell cycle genes by cluster (Continued)
BMC Plant Biology 2008, 8:16 />Page 11 of 29
(page number not for citation purposes)
146658 CN895184 AT5G12200.1 0 dihydropyrimidinase (PYD2)
147359 EB138102
AT1G05910.1 1e-111 cell division cycle protein 48-related/CDC48-related
147418 CN895629
AT3G18600.1 4e-32 DEAD/DEAH box helicase, putative
150678 CN898212
AT3G07760.1 3e-28 expressed protein MLP3.21
155382 CN901049
AT3G24320.1 3e-73 DNA mismatch repair MutS family (MSH1)
159868 EB128540
AT2G19770.1 5e-45 profilin 4 (PRO4) (PFN4)
172304 CN883582
AT3G48530.1 2e-72 CBS domain-containing protein
175286 CN904072
AT4G25130.1 1e-100 peptide methionine sulfoxide reductase, putative
184340 EB147575
AT3G13230.1 2e-77 expressed protein MDC11.5
185727 EB148939
AT5G21990.1 1e-107 tetratricopeptide repeat (TPR)-containing protein
186037 EB149246
AT4G25130.1 3e-71 peptide methionine sulfoxide reductase, putative
216840 CN947326
AT4G04955.1 3e-45 ATALN Encodes an allantoinase
219785 CN851874
AT2G30200.1 1e-148 expressed protein T27E13_6
221777 CN875931
AT5G17570.1 1e-115 tatD-related deoxyribonuclease family protein
221885 EB122552
AT1G55860.1 2e-19 ubiquitin-protein ligase 1 (UPL1)
225203 CN877466
AT1G68370.1 9e-74 gravity-responsive protein (ARG1)
228881 CN878128
AT1G77930.1 1e-105 DNAJ heat shock N-terminal domain-containing protein
229438 CN878271
AT1G20760.1 2e-30 calcium-binding EF hand family protein
229922 CN878558
AT1G20110.1 4e-73 zinc finger (FYVE type) family protein
257846 CN914471
AT1G15240.1 8e-26 phox (PX) domain-containing protein
266842 CN916307
AT2G45620.1 4e-09 nucleotidyltransferase family protein
267005 CN916212
AT4G28000.1 7e-51 AAA-type ATPase family protein
267748 CN918233
AT5G41370.1 4e-13 XPB1 involved in both DNA repair and transcription
289972 CN884487
AT3G23610.1 5e-60 dual specificity protein phosphatase (DsPTP1)
a ESTs that change during fruit development were used to identify apple genes and the best Arabidopsis homolog (by BLAST) was found for that
apple gene. Where a sequence similarity was better than 1 × e-5 the MIPS functional category for that Arabidopsis gene was determined.
b Genes with the functional category "Cell cycle and DNA processing" were identified in each array cluster and ESTs in those clusters and the
annotation of the Arabidopsis homolog is shown.
Table 3: Annotation of cell cycle genes by cluster (Continued)
sucrose metabolic pathway in the Kyoto Encyclopedia of
Genes and Genomes (KEGG) database [32]. Apple genes
with significant sequence similarity to the Arabidopsis
starch turnover genes (BLAST significance better than 1 ×
e
-100
) were included in the analysis (Table 4).
Genes which had constant expression during apple fruit
development, and hence did not show transcriptional reg-
ulation in this developmental process were not studied
further. Those with low-level expression were also
excluded due to the high variability observed where the
targets have low signal intensity on the microarray. α-
amylase is one example of an enzyme for which the tran-
script level detected was below the cut off value and con-
sequently was not analysed further. In total, ESTs for 15
apple genes with homology to starch metabolic enzymes
were identified with microarray expression profiles that
varied during fruit development (Table 4) and qRT-PCR
was performed to confirm these profiles. For nine of the
15 enzymes, the qRT-PCR analysis produced expression
profiles that strongly supported the patterns seen in the
microarray data (Figure 5). For the remaining six enzymes
the qRT-PCR pattern differed from the microarray pattern
possibly because the RT-PCR primers were amplifying dif-
ferent alleles or genes than those detected by the microar-
ray oligo.
Four distinct expression profiles were observed: I) for a β-
amylase gene (EB114557
), transcript levels were high at
anthesis and low for the rest of fruit development, sucrose
synthase (CN897963
) had a similar pattern of expression
although with a less rapid decline in expression; II) for
sucrose phosphatase (EB156512
) and a sucrose-phos-
phate synthase gene (EB123469
), transcript levels peaked
at the earliest and latest time points; III) for ADP-glucose
phosphorylase (CN884033
) and UDP-glucose pyrophos-
phorylase (EG631379
), transcript levels were lowest in
the bud and increased during fruit development to reach
a maximum in tree ripe apple; IV) for an α-glucosidase
(EE663791
) and a starch synthase (EB121923) transcript
levels were low both early and late in apple development
and peaked during early and mid development, respec-
tively.
Microarray data can potentially be used to identify regula-
tory genes associated with coordinating expression of
pathways such as starch metabolism. The similarity of the
profiles for sucrose phosphatase and sucrose-phosphate
synthase (Figure 5) suggested coordination of expression.
Using cluster analysis, a single domain Myb transcription
factor (EB129522
) was identified with a similar expres-
sion pattern to sucrose phosphatase and sucrose-phos-
phate synthase. Preliminary transient expression studies
in Nicotiana benthamiana leaves did not show activation of
BMC Plant Biology 2008, 8:16 />Page 12 of 29
(page number not for citation purposes)
promoter regions of the two starch metabolic genes using
this Myb gene alone (data not shown). Further analysis
using larger promoter regions and possible binding part-
ners for the Myb protein may identify a regulatory role for
this gene.
Expression of candidate fruit development genes in apple
While Arabidopsis does not produce a large fleshy fruit
and the post-pollination development of the fruiting
body is limited, the availability of excellent genetic
resources and genomic tools such as a complete genome
sequence and whole genome microarrays has allowed
identification of many important genes involved in floral
and fruit development. The development of floral organs
and the genes involved in production of mature carpels
prior to fertilization have been the subject of several
reviews [33]. Post-pollination development of the Arabi-
dopsis fruit is limited, and while it serves as a good model
for dehiscent fruit, it is not clear whether the genes
involved in Arabidopsis fruit development are important
in the development of fleshy fruit. In spite of this reserva-
tion, the importance of transcription factors such as aga-
mous, fruitful, AGL1/AGL5, spatula, crabs claw, and ettin in
specification of carpel identity and silique development
suggests that transcription factors such as these may play
significant roles in the development of fleshy fruit [33].
BLAST searches identified apple genes that had oligos on
the apple microarray for a spatula homologue
(At4g36930, apple EST289091 Genbank acc EB132541
,
expect value 8 × e
-41
); ettin/ARF3 (At2g33860, apple
EST250932, Genbank acc CN911459
, expect value 1 × e
-
163
); a fruitful/AGL8 homologue (At5g60910, apple
EST158712, Genbank acc EE663894
, expect value 7 × e
-60
)
and a crabs claw homologue (most homologous to yabby5
At2g26580, apple EST111296, Genbank acc EB124712
,
expect value 3 × e
-42
) and expression patterns for these
genes were plotted (Figure 6). The expression of the fruit-
ful/AGL8 homologue (Figure 6C), which has more simi-
larity to AP1 than fruitful, increases at the time when apple
fruit are enlarging (and down-regulated during cell divi-
sion) which is interesting given the short compact silique
of the fruitful mutant.
Comparison of apple and tomato fruit development
A recent study by Alba et al. [13] used an array of 12899
EST clones representing ~8500 tomato genes to examine
fruit development and ripening, with a particular focus on
the events occurring around ripening. While this study did
not include floral buds or the stages of tomato develop-
ment, where cell division is most active, it is the most
complete fruit development data set to date. In order to
identify genes involved in both apple and tomato fruit
development, we used the list of genes that change during
tomato fruit development to find apple genes on our
microarray.
Using MegaBLAST (word size 12, threshold 1 × e
-5
) the list
of 869 genes that change during tomato fruit develop-
ment from Alba et al. [13] was used to identify homolo-
gous apple genes that were present on the array used in
this work. Three hundred and thirty-six unique tomato
genes had homology to 479 unique apple genes by these
criteria. Of these apple genes, 102 were identified as hav-
ing significant changes in expression during apple fruit
development and hence are transcriptionally regulated in
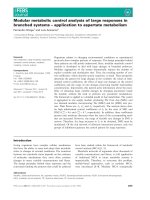
Expression of core cell cycle genesFigure 4
Expression of core cell cycle genes. Array expression
levels are shown for the three core cell cycle genes that
changed significantly during apple fruit development. A,
EB107042 a CDKB1;2 homologue, B, CN943384 a CDKB2;2
homologue, C, EB141951 a CKS1 homologue.
0
2
4
6
8
10
12
0 50 100 150
0
1
2
3
0 50 100 150
0
1
2
3
4
5
6
0 50 100 150
A
B
Da
y
s after anthesis
Microarray expression
C
BMC Plant Biology 2008, 8:16 />Page 13 of 29
(page number not for citation purposes)
both apple and tomato. We further filtered the list to
include only those genes in the apple EFD (41 genes), MD
(16 genes) and R (35 genes) clusters (Table 5). An addi-
tional 10 apple genes in the FB cluster were also identified
by homology with the developmentally regulated tomato
genes but not examined further since the tomato microar-
ray did not include a floral bud sample.
The expression data from both the apple and tomato
microarrays was plotted for several of the genes identified.
The top five genes in each cluster by quality of the BLAST
match between apple and tomato were plotted. Several
genes possibly involved in processes occurring during
early fruit development, mid development and ripening
were also plotted. And because microarrays have the
potential to identify genes involved in processes without
prior information, all the genes without annotation were
also plotted.
The development of apple and tomato fruit, from anthesis
to mature fruit differs in length, however we compared
patterns of expression during similar phases of develop-
ment, in particular the mid development phase when cells
are expanding in both apple and tomato (~8–35 DAA in
tomato and ~40–110 DAA in apple) and the ripening
phase (~40–50 DAA in tomato and ~130–150 DAA in
apple). Of the 47 genes for which expression patterns
were compared, 16 had similar patterns of expression in
Table 4: Enzymes involved in Starch metabolism
Enzyme EC # A. thaliana gene Genbank acc.
a
expect value
b
qPCR vs array
c
Localisation
Sucrose synthase 2.4.1.13 At3g43190 EB144194 0 + plastidic
At4g02280 CN897963
0 ++ unknown
At5g20830
At5g37180
At5g49190
UDP-glucose pyrophosphorylase 2.7.7.9 At5g17310 EG631379 1e-173 +++ endomembrane system
Starch synthase 2.4.1.21 At1g32900 EE663720 0 - plastidic
At3g01180 EB121923
0 +++ plastidic
ADP-glucose phosphorylase 2.7.7.27 At1g27680 CN884033 1e-167 +++ plastidic
At2g21590
At4g39210
At5g19220
At5g48300
At1g05610
Starch phosphorylase 2.4.1.1 At3g29320 EE663644 0 - plastidic
At3g46970 EB108842
1e-115 - unknown
Sucrose-phosphate synthase 2.4.1.14 At5g20280 EB112628 0 ++ unknown
At1g04920 EB123469
0 ++ unknown
At5g11110
At4g10120
β-amylase 3.2.1.2 At4g15210 EB114557 1e-116 +++ plastidic
At4g17090 EG631202
1e-104 - plastidic
α-glucosidase 3.2.1.20 At3g45940 EE663791 0 +++ endomembrane system
At5g11720 EE663790
0 - endomembrane system
At5g63840
Sucrose phosphatase 3.1.3.24 At2g35840 EB156512 0 +++ cytoplasm
Starch metabolism genes were identified and the expression of putative apple starch metabolism genes confirmed by qRT-PCR.
a The representative EST on the array is shown for the best apple gene match to the Arabidopsis gene.
b The significance of the BLAST comparison between the Arabidopsis gene and the best apple gene.
c The degree of correspondence between pattern of gene expression by microarray and the pattern by qPCR. - = no correspondence; + = more
than two points of divergence; ++ = good correspondence but some differences; +++ = strong correspondence
BMC Plant Biology 2008, 8:16 />Page 14 of 29
(page number not for citation purposes)
Expression of starch metabolism genesFigure 5
Expression of starch metabolism genes. Starch meta-
bolic enzymes identified from KEGG were used to identify
apple homologues. Where apple array expression varied and
gave reliable data the expression pattern was confirmed by
qRT-PCR. Of the 15 genes validated, 9 showed very similar
patterns of expression in both array and qRT-PCR. A to F,
The array data for Rep1 and Rep2 was combined and mean
and standard error is plotted (solid lines), qRT-PCR data is
shown for each Rep as mean and standard error for qRT-
PCR replicates, Rep1 short dashes, Rep2 long dashes. G, Dia-
gram showing fruit starch levels during fruit development as a
percentage of the maximum levels, adapted from Brookfield
et al. [19]. X axes show DAA, the left Y axes shows relative
qRT-PCR expression; the right Y axes shows absolute array
expression.
A
Beta-amylase
B Sucrose phosphatase
C Sucrose-phosphate synthase 1
D Sucrose phosphate synthase 2
E ADP-glucose phosphorylase
F UDP-glucose pyrophosphorylase
G Alpha-glucosidase
H Starch synthase
I Sucrose synthase
50
8
40
30
20
10
00
2
4
6
4
3
2
1
0
4
2
0
20
10
0
1.2
0.6
0
6
4
2
0
0.4
0.2
0
3
2
1
0
2
1
0
4
2
0
40
20
0
600
400
200
0
6
4
2
0
6
4
2
0
4
2
0
8
4
0
4
2
0
Da
y
s after anthesis
qPCR expression
Microarray expression
0
20 40 60 80 100 120 140
100
75
50
25
J Fruit starch
% max
Expression pattern for candidate fruit development genesFigure 6
Expression pattern for candidate fruit development
genes. Array expression patterns for apple homologues of
Arabidopsis fruit development genes A, Spatula homologue
EB132541, B, ettin/ARF3 homologue CN911459, C, Fruitfull/
AGL8 homologue EE663894, D, Yabby homologue
EB124712.
0
0.1
0.2
0.3
0.4
0.5
0 50 100 150
0
2
4
6
8
10
12
14
0 50 100 150
0
0.4
0.8
1.2
1.6
0 50 100 150
0
0.5
1
1.5
2
2.5
3
3.5
0 50 100 150
A
B
Microarray expression
C
D
Days after anthesis
BMC Plant Biology 2008, 8:16 />Page 15 of 29
(page number not for citation purposes)
Table 5: Comparison of tomato and apple fruit development genes
SGN-U ID (build 200607)
a
TOM1 SGN-M ID
b
Apple Genbank acc. Putative Annotation
c
e value
d
Early fruit development cluster
SGN-U313081 1-1-1.4.4.1 CN949202 Tubulin 4.00E-114
SGN-U334957 1-1-1.4.2.16 EG631180
dimethyllallyl pyrophosphate isomerase 2.00E-70
SGN-U313439 1-1-1.2.10.21 CN929316
Catalase isozyme 5.00E-67
SGN-U312411 1-1-3.1.20.8 CN929316
Catalase isozyme 1.00E-39
SGN-U314745 1-1-6.2.2.12 EB129157
Histone H2B family 5.00E-64
SGN-U315396 1-1-1.1.2.14 CN897140
Histone H2B family 1.00E-52
SGN-U320099 1-1-2.2.8.13 EB134184
homeodomain leucine zipper protein 5.00E-50
SGN-U312336 1-1-3.2.14.10 CN900880
Chlorophyll a/b binding protein CP24 8.00E-45
SGN-U316933 1-1-2.2.10.18 CN938965
SLT1 protein 1.00E-42
SGN-U312305 1-1-4.1.9.2 EB115858
Tubulin 5.00E-42
SGN-U312306 1-1-1.1.17.12 CN898685
Tubulin 3.00E-37
SGN-U312504 1-1-4.2.1.21 CN929029
Glycolate oxidase 5.00E-33
SGN-U312724 1-1-3.2.1.14 CN929029
Glycolate oxidase 9.00E-22
SGN-U313531 1-1-5.3.20.16 EB140736
multi-copper oxidase type I family protein 5.00E-33
SGN-U314489 1-1-5.4.1.13 EB128513
β-glucosidase 5.00E-30
SGN-U313179 1-1-3.3.12.5 EB149714
Photosystem I reaction center subunit N 3.00E-29
SGN-U313648 1-1-1.1.2.9 EB139544
multi-copper oxidase type I family protein 2.00E-26
SGN-U314548 1-1-1.1.14.13 EB128647
Peptidyl-prolyl cis-trans isomerase A 6.00E-25
SGN-U312538 1-1-1.3.12.16 EB130656
60 kDa chaperonin 2 (groEL protein 1) 8.00E-23
SGN-U312683 1-1-2.1.6.18 CN900931
Calreticulin precursor 9.00E-19
SGN-U319738 1-1-1.2.11.21 CN865336
zinc (C3HC4-type RING finger) family 3.00E-18
SGN-U314473 1-1-8.2.16.2 EB176490
MADS-box protein (AGL3) RIN 3.00E-17
SGN-U317999 1-1-4.3.10.21 CN945062
PGR5 related 8.00E-17
SGN-U318625 1-1-2.3.5.9 EB114733
kinase-activating protein 3.00E-16
SGN-U312874 1-1-1.3.11.19 CN909851
HMG protein 7.00E-16
SGN-U313470 1-1-2.1.19.16 CN940020
Hypothetical protein 2.00E-13
SGN-U333609 1-1-3.1.10.16 EB140812
expansin (EXP15) 7.00E-12
SGN-U313166 1-1-6.1.9.20 EB131083
Hypothetical protein 2.00E-11
SGN-U314384 1-1-5.4.4.11 EB132156
Lipid transfer protein (LTP1) 1.00E-10
SGN-U314386 1-1-5.1.15.12 EB132156
Lipid transfer protein (LTP1) 3.00E-07
SGN-U313194 1-1-2.3.4.21 EB131105
Photosystem I reaction center subunit psaK 3.00E-10
SGN-U313424 1-1-1.3.1.15 CN948056
seed storage/lipid transfer protein family 4.00E-10
SGN-U314489 1-1-5.4.1.13 EB141224
β-glucosidase, protein 1.00E-09
SGN-U312690 1-1-2.1.2.8 EB141004
Plastocyanin 2.00E-09
SGN-U336943 1-1-8.2.6.16 CN911937
hypothetical protein 7.00E-09
SGN-U331028 1-1-5.3.5.7 CN913037
Hypothetical protein 2.00E-08
SGN-U317844 1-1-8.4.6.17 EB140002
subtilase family protein 3.00E-07
SGN-U312690 1-1-2.1.2.8 EB127862
Glycolate oxidase
e
4.00E-07
SGN-U313570 1-1-1.1.12.3 CN909757
hypothetical protein
f
4.00E-07
SGN-U316057 1-1-6.4.13.2 CN882413
Aspartyl protease family protein 8.00E-07
SGN-U334601 1-1-8.4.10.14 CN887130
Aldehyde dehydrogenase 2B4 2.00E-06
SGN-U319033 1-1-3.2.20.7 EB133081
bZIP transcription factor 2.00E-06
SGN-U314713 1-1-1.2.1.20 CN918915
aldo/keto reductase family
g
2.00E-06
SGN-U314261 1-1-7.4.10.14 EB148186
photosystem I subunit III precursor 6.00E-06
Mid development cluster
SGN-U312527 1-1-4.2.20.9 EB130137 S-adenosylmethionine synthetase 8.00E-109
SGN-U312579 1-1-4.4.6.16 EB130137
S-adenosylmethionine synthetase 4.00E-70
SGN-U313529 1-1-6.3.1.18 EB130137
S-adenosylmethionine synthetase 6.00E-75
SGN-U313179 1-1-3.3.12.5 EB148119
Photosystem I reaction centre subunit N 4.00E-47
SGN-U312700 1-1-2.4.10.20 EB110724
Aquaporin PIP1.1 9.00E-46
SGN-U313179 1-1-3.3.12.5 EB138262
Photosystem I reaction center subunit) 2.00E-42
SGN-U313283 1-1-2.1.14.13 EB109090
Peptidyl-prolyl cis-trans isomerase 1.00E-37
SGN-U312814 1-1-3.3.9.20 CN943669
Plasma membrane intrinsic protein 5.00E-35
SGN-U316986 1-1-3.1.2.11 EG631337
class II heat shock protein 6.00E-33
SGN-U313962 1-1-5.2.4.10 EB143575
Hypersensitive induced response protein 7.00E-28
BMC Plant Biology 2008, 8:16 />Page 16 of 29
(page number not for citation purposes)
SGN-U312403 1-1-2.2.19.9 EE663740 Heat shock 70 kDa protein 1.00E-18
SGN-U313542 1-1-3.4.1.6 CN882970
plasma membrane protein 8.00E-18
SGN-U312953 1-1-3.3.3.13 EB129432
α-expansin precursor 4.00E-17
SGN-U333609 1-1-3.1.10.16 EB129432
α-expansin precursor 2.00E-06
SGN-U314790 1-1-6.3.18.20 CN913939
quinone-oxidoreductase protein 4.00E-17
SGN-U314793 1-1-2.3.17.10 CN913939
quinone-oxidoreductase protein 2.00E-10
SGN-U312450 1-1-7.3.19.9 EE663684
17.6 kDa class I heat shock protein 2.00E-12
SGN-U315846 1-1-3.2.11.11 CN866618
CBL-interacting protein kinase 2.00E-11
SGN-U314303 1-1-4.4.8.10 EB138124
Fatty aldehyde dehydrogenase 2.00E-10
SGN-U318440 1-1-8.1.15.21 CN875978
Hypothetical protein 4.00E-08
Ripening cluster
SGN-U312527 1-1-4.2.20.9 EB137890 S-adenosylmethionine synthetase 1 6.00E-88
SGN-U312579 1-1-4.4.6.16 EB137890
S-adenosylmethionine synthetase 1 5.00E-42
SGN-U313529 1-1-6.3.1.18 EB137890
S-adenosylmethionine synthetase 1 3.00E-86
SGN-U312306 1-1-1.1.17.12 CN943168
Tubulin 5.00E-54
SGN-U314314 1-1-5.2.14.12 CN907169
Hypothetical protein 4.00E-44
SGN-U315828 1-1-3.2.1.16 CN940740
Cytochrome C oxidase subunit protein 5.00E-41
SGN-U334905 1-1-4.1.6.7 EB130234
β-carotene hydroxylase 2.00E-39
SGN-U312904 1-1-1.3.13.18 EB150480
haloacid dehalogenase hydrolase family 6.00E-38
SGN-U314358 1-1-4.3.1.2 CN915191
Alcohol dehydrogenase 5.00E-33
SGN-U319942 1-1-4.4.2.20 CN874208
Membrane-anchored ubiquitin-fold protein 2.00E-24
SGN-U316057 1-1-6.4.13.2 CN879999
aspartyl protease family protein 3.00E-22
SGN-U317374 1-1-8.2.2.7 CN946592
Hypothetical protein 3.00E-19
SGN-U336133 1-1-1.4.10.1 EG631183
α-amylase 5.00E-19
SGN-U318901 1-1-1.3.6.2 CN876487
Hypothetical protein 2.00E-17
SGN-U316698 1-1-3.2.1.19 CN868148
Seed maturation protein 5.00E-17
SGN-U316057 1-1-6.4.13.2 CN894718
aspartyl protease family protein 9.00E-16
SGN-U313923 1-1-4.2.19.5 CN883582
SNF1 protein kinase regulatory gamma 9.00E-16
SGN-U314101 1-1-2.4.13.5 CN941714
Chaperone clpB 7.00E-15
SGN-U317462 1-1-2.4.16.8 CN884487
Dual specificity protein phosphatase 6 5.00E-13
SGN-U313514 1-1-4.2.3.20 EB152301
14-3-3 protein GF14 upsilon (GRF5) 2.00E-12
SGN-U313747 1-1-2.3.3.5 EB128426
vacuolar processing enzyme-1b 3.00E-12
SGN-U316038 1-1-3.1.9.11 EE663883
Expressed protein 9.00E-12
SGN-U314449 1-1-8.1.4.18 CN902741
hypothetical or unknown protein 2.00E-11
SGN-U314453 1-1-2.4.16.1 CN902741
hypothetical or unknown protein 4.00E-11
SGN-U313315 1-1-3.1.9.21 EG631213
Putative chloroplast-targeted β-amylase 1.00E-09
SGN-U328474 1-1-8.4.1.16 CN911230
NHL repeat-containing protein 2.00E-09
SGN-U314887 1-1-3.3.3.14 EB144737
Phytoene synthase 3.00E-09
SGN-U313474 1-1-3.1.12.20 CN898201
short chain dehydrogenase/reductase family 3.00E-08
SGN-U322411 1-1-6.1.18.17 EB137522
Homocysteine S methyltransferase 1 2.00E-07
SGN-U315858 1-1-5.3.11.3 CN895375
Universal stress protein 2.00E-07
SGN-U315671 1-1-1.2.16.10 CN929435
Ethylene-responsive DEAD box RNA helicase 3.00E-07
SGN-U312714 1-1-2.3.9.4 EG631274
Cytochrome P450 85A1 (C6-oxidase) 2.00E-07
SGN-U312715 1-1-1.1.15.15 EG631274
Cytochrome P450 85A1 (C6-oxidase) 3.00E-07
SGN-U313547 1-1-2.4.5.5 CN917878
Plasma membrane ATPase 1 (Proton pump 1) 4.00E-07
SGN-U312870 1-1-4.2.15.8 EE663893
Xyloglucan:xyloglucosyl transferase 6.00E-07
SGN-U316695 1-1-1.2.8.9 EB111007
Mitogen-activated protein kinase 3 7.00E-07
SGN-U320099 1-1-2.2.8.13 EB116421
Homeobox leucine zipper protein ATHB-4 2.00E-06
SGN-U312516 1-1-1.3.7.19 EG631323
N-benzoyltransferase protein 4.00E-06
SGN-U312884 1-1-8.3.6.6 CN862135
Hypothetical protein 6.00E-06
Genes identified as changing during tomato fruit development were used to identify apple genes present on the array that were also changing during
fruit development.
a Gene identifier for the tomato gene containing the sequence on the TOM1 array, from [53]
b Micrarray feature identifier from Alba et al. [13].
c Annotation of both the apple and tomato genes, based on BLAST comparison of genes with public databases.
d e value for the MegaBLAST comparison between the tomato gene and the apple gene that contain the sequence on the array.
e Annotation for tomato gene is: Plastocyanin, chloroplast precursor.
f Annotation for tomato gene is: Histone H4.
g Annotation for tomato gene is: protein transporter.
Table 5: Comparison of tomato and apple fruit development genes (Continued)
BMC Plant Biology 2008, 8:16 />Page 17 of 29
(page number not for citation purposes)
Comparison of apple and tomato expressionFigure 7
Comparison of apple and tomato expression. Expression of tomato and apple genes identified as changing during fruit
development and similar by sequence comparison. Expression for tomato genes is plotted relative to 7 DAA and for apple as
absolute expression; the x axes shows days after anthesis. Shaded areas in each graph correspond to the periods of cell expan-
sion and ripening for both tomato and apple. A, C, E, G, I, K, M, O, Q, S, U, W, Y, AA, AC, AE tomato genes B, D, F, H, J, L, N,
P, R, T, V, X, Z, AB, AD, AF apple genes. A and B, Tubulin homologues; C and D, IPP isomerase homologues; E and F, Catalase
homologues; G and H, Histone 2B homologues; I and J, MADS box (RIN) homologues; K and L, SAM synthase homologues; M
and N, PPIase homologues; O and P, plasma membrane protein; Q, and R, α-expansin homologues; S and T, β-carotene
hydroxylase homologues; U and V, Alcohol dehydrogenase homologues; W and X Phytoene synthase homologues; Y to AF
Unannotated proteins. A, solid line SGN-U313081, dashed line SGN-U312305, dotted line SGN-U312306; B, solid line
CN949202, dashed line EB115858, dotted line CN898685; C, SGN-U334957; D, EG631180; E, SGN-U313439; F, CN929316;
G, SGN-U315396; H, CN897140; I SGN-U314473; J, EB176490; K, solid line SGN-U312527, dashed line SGN-U312579, dot-
ted line SGN-U313529; L, EB130137; M, SGN-U313283; N, EB109090; O, SGN-U312814; P, CN943669; Q, solid line SGN-
U312953, dashed line SGN-U333609; R, EB129432; S, SGN-U334905; T, EB130234; U, SGN-U314358; V, CN915191; W,
SGN-U314887; X, EB144737; Y, SGN-U317999; Z, CN945062; AA, SGN-U313570; AB, CN909757; AC, SGN-U318901; AD,
CN876487; AE, solid line SGN-U314449, dashed line SGN-U314453; AF, CN902741.
0
5
10
15
20
25
30
0 50 100 150
0.0
0.5
1.0
1.5
2.0
2.5
3.0
3.5
0 102030405060
0
1
2
3
4
5
050100150
0
0.4
0.8
1.2
050100150
0.0
0.2
0.4
0.6
0.8
1.0
1.2
0 1020 30405060
0
5
10
15
20
25
30
35
0 50 100 150
0.0
0.2
0.4
0.6
0.8
1.0
1.2
1.4
0102030405060
0.0
0.2
0.4
0.6
0.8
1.0
1.2
1.4
1.6
1.8
0 102030405060
0.0
0.2
0.4
0.6
0.8
1.0
1.2
0 1020 30405060
AB
0.0
0.2
0.4
0.6
0.8
1.0
1.2
1.4
0 102030405060
C
0
1
2
3
0 50 100 150
D
0.0
0.2
0.4
0.6
0.8
1.0
1.2
1.4
1.6
0 102030405060
E
0
5
10
15
20
25
30
35
40
45
0 50 100 150
F
0
2
4
6
8
10
12
14
16
0 50 100 150
HG
0.0
0.5
1.0
1.5
2.0
2.5
3.0
3.5
4.0
0102030405060
I
32
36
40
0 50 100 150
J K
0
1
2
3
4
5
6
7
0 50 100 150
L
0
5
10
15
20
25
30
35
0 50 100 150
0.0
0.2
0.4
0.6
0.8
1.0
1.2
0 102030405060
MN OP
0.0
0.5
1.0
1.5
2.0
2.5
3.0
3.5
4.0
4.5
5.0
0 102030405060
0
5
10
15
20
25
30
35
0 50 100 150
0.0
0.5
1.0
1.5
2.0
2.5
3.0
0 1020 3040 5060
0
1
2
3
4
0 50 100 150
Q
RS
T
0
1
2
3
4
5
050100150
0.0
2.0
4.0
6.0
8.0
10.0
12.0
14.0
16.0
18.0
20.0
0102030405060
0.0
0.5
1.0
1.5
2.0
2.5
3.0
3.5
4.0
4.5
5.0
0 10 2030405060
U
VW
X
0
1
2
3
0 50 100 150
0.0
0.2
0.4
0.6
0.8
1.0
1.2
0 10 2030405060
Y
Z
AA
AB
0
0.4
0.8
1.2
0 50 100 150
0.0
0.5
1.0
1.5
2.0
2.5
3.0
0 102030405060
0
1
2
3
4
5
6
7
0 50 100 150
0.0
0.2
0.4
0.6
0.8
1.0
1.2
1.4
1.6
1.8
0 102030405060
AC
AD AE
AF
Tomato AppleTomatoApple
BMC Plant Biology 2008, 8:16 />Page 18 of 29
(page number not for citation purposes)
both apple and tomato and are shown in Figure 7, with
the cell expansion and ripening stages highlighted. A fur-
ther five genes had some similarity of expression but 26
had little or no similarity of expression (data not shown).
For genes such as Tubulin (Figure 7A and 7B), SAM syn-
thase (Figure 7K and 7L) and an expansin homologue
(Figure 7Q and 7R) more than one tomato sequence had
homology to an apple gene and in the case of the tubulin
genes to three apple genes. For the tubulin genes the pat-
terns of expression mostly differed between apple and
tomato but one of the tomato genes showed a steady
decrease in expression during cell expansion similar to the
apple genes. For the three tomato SAM synthase genes
only one (SGN-U312579) had a pattern of expression
similar to the apple gene suggesting this tomato gene may
have a similar function in apple and tomato. For the two
tomato expansin homologues with similarity to apple,
SGN-U312953 increased in expression during ripening
whereas SGN-U333609 and the apple expansin homo-
logue both increased during cell expansion and declined
in ripening, suggesting these genes may be orthologues
and have a role during cell enlargement but not in fruit
softening. Four genes without annotation were identified
as having similar patterns of expression in apple and
tomato fruit. Further bioinformatic analysis suggests that,
Table 6: Early apple fruit gene identified in 'Fuji' which change during 'Royal Gala' fruit development
EFD genes from Lee et al. (2007)
a
expect value
b
Genbank acc for array oligo Annotation
EFD cluster
DW248931 1.00E-155 CN900880 chlorophyll A-B binding protein (LHCI type I (CAB))
DW248987 0 EB127862
Glycolate oxidase
DW248917 1.00E-177 EB127279
lipid protein
DW248920 0 EB148186
Photosystem I reaction center subunit III
DW248842 0 CN929029
Glycolate oxidase
DW248924 0 EB115972
Ascorbate peroxidase
DW248835 0 EB140491
aquaporin TIP1.3
DW248922 0 EB149714
Photosystem I reaction center subunit N
DW248839 0 CN926591
NADH dehydrogenase
DW248976 0 EB112578
Trans-cinnamate 4-monooxygenase (Cytochrome P450 73)
DW248868 0 CN915536
rapid alkalinization factor
DW248881 1.00E-143 CN861574
phytol kinase 2
DW248942 0 CN861788
Photosystem I reaction center subunit V
MD cluster
DW248803 1.00E-87 CN913162 CP12 protein
DW248895 5.00E-95 EB148680
Oxygen-evolving enhancer protein
DW248912 5.00E-163 CN870279
16.9 kDa class I heat shock protein
DW248912 5.00E-163 EG631337
class I heat shock protein
Not selected in Royal Gala fruit development
DW248927 0 EB127218 Polyphenol oxidase
DW248967 0 EB127720
Ferredoxin-thioredoxin reductase
DW248839 0 CN894409
NADH dehydrogenase
DW248924 0 EB138975
Ascorbate peroxidase
DW248940 0 CN899704
oligouridylate binding protein
DW248833 0 EB128528
Hypothetical protein
DW248979 0 EB129884
α-expansin
DW248918 0 CN944949
Photosystem I reaction center subunit II
DW248941 0 CN884411
chlorophyll A-B binding protein
DW248844 0 EB148603
RuBisCO activase
DW248914 0 EB148603
RuBisCO activase
DW248854 1.00E-129 EB148750
Oxygen-evolving enhancer protein 2
DW248983 0 EB131218
fatty acid elongase 3-ketoacyl-CoA synthase 1
DW248994 0 CN912337
Glutamate-1-semialdehyde 2,1-aminomutase
Genes identified by [25] as up-regulated during EFD were used to identify apple genes present on the array.
a Genbank accession for those genes identified in Lee at al as up regulated in early fruit development with homologues present on our array.
b expect value for the BLAST comparison between the Fuji gene and the apple gene which contains the array oligo.
BMC Plant Biology 2008, 8:16 />Page 19 of 29
(page number not for citation purposes)
Table 7: Fruit ripening genes which respond to ethylene
Apple Genbank acc. Putative Annotation
a
Apple Genbank acc. Putative Annotation
a
Ripening sub-cluster R1
EB118159 Short chain dehydrogenase/reductase (SDR) EB140551 Hypothetical protein
CN860849
Ceramide kinase CN906574 Senescence associated protein
CN870499
Hypothetical protein EB122632 Thaumatin protein
EB127428
LEA family protein CN911315 DNA binding bromodomain protein
CN895403
Integral membrane family protein EB151414 Major latex protein (MLP)
Ripening sub-cluster R2 Ripening sub-cluster R3
EB106359 Hypothetical protein CN932083 Chloroplast 50S ribosomal protein L22
CN862135
Hypothetical protein CN860052 5-oxoprolinase
EB114937
β-glucosidase precursor CN860296 Hypothetical protein
CN862240
Transaldolase ToTAL2 CN862389 Stress-responsive protein
EB116078
(S)-acetone-cyanohydrin lyase CN864680 (S)-2-hydroxy-acid oxidase
EB118291
Mannitol dehydrogenase CN851072 Calcineurin B-like protein
CN849429
Hypothetical protein EB121320 Ribosomal protein
CN863631
Sugar transporter CN886293 Isoflavone reductase
EB117418
(1–4)-β-mannan endohydrolase EB135086 Carbonic anhydrase
CN864737
DNA polymerase III polC-type EB126988 C2H2-type zinc finger protein
EB115757
Flavonol synthase CN939170 Glycerol-3-phosphate dehydrogenase
EB121772
Hypothetical protein CN939718 Sad1/unc-84 protein
CN887217
Hypothetical protein CN890306 Transaldolase protein
CN890755
CBL-interacting protein kinase EB137446 Cytochrome P450
EB135512
F-box family protein CN894690 NADH dehydrogenase
CN893578
C-4 methyl sterol oxidase EB137890 S-adenosylmethionine synthetase
CN889902
Auxin/aluminum-responsive CN895673 2-oxoisovalerate dehydrogenase
CN895410
Hypothetical protein EB138408 Hypothetical protein
CN895502
Vacuolar sorting receptor EB140312 Ribose-5-phosphate isomerase A
EB138209
Xyloglucan endotransglycosylase EB142251 Pectinacetylesterase
EB138429
LEA family protein CN941807 DEAD box RNA helicase
CN940062
Harpin induced protein (HIN1) CN943134 Hypothetical protein
EB139752
Seed storage/lipid transfer protein EB129495 Stress-responsive protein
EB139896
Auxin-responsive protein CN943168 Tubulin
EB128540
Profilin EB129522 MYB transcription factor
CN943110
Syntaxin CN945056 Hypothetical protein
EE663937
Ethylene receptor (EIN4/ETR2) CN883038 Hypothetical protein
EB140933
6-phosphogluconolactonase EB150480 Haloacid dehalogenase hydrolase
EB141282
Lipoxygenase EE663647 Hypothetical protein
CN901620
Hypothetical protein EG631194 S-adenosyl-L-methionine:carboxyl methyltransferase protein
EB144781
Lipid transfer protein CN876100 SCARECROW gene regulator
EB148006
Fimbrin protein (FIM1) CN877052 Hypothetical protein
EG631181
Thaumatin protein CN878203 Copine I protein
EG631195
Transferase family protein CN902180 Amidase protein
EG631213
β-amylase CN902277 Hypothetical protein
EB157538
Hypothetical protein CN902592 Heavy-metal associated domain-containing protein
CN875931
tatD deoxyribonuclease family CN911536 Hypothetical protein
EG631252
UDP-glucoronosyl/UDP-glucosyl transferase EB154218 MADS-box protein
EE663809
Pyruvate kinase CN914798 Hypothetical protein
CN912930
Pentatricopeptide repeat protein CN914935 MATE efflux protein
CN913545
Hypothetical protein CN914950 2OG-Fe(II) oxygenase family protein
CN909301
Hypothetical protein CN917878 H(+)-transporting ATPase
CN917441
Dormancy/auxin associated EE663837 Hypothetical protein
EB152801
Xyloglucan endotransglycosylase CN916212 AAA-type ATPase family protein
CN915067
Sugar transporter family protein CN916137 Phytase
CN915323
Hypothetical protein EB153327 Isocitrate lyase
EE663891
Polygalacturonase CN915191 Alcohol dehydrogenase
EG631317
Cytochrome P450 EG631278 Cytochrome P450
Apple genes for which expression changed in response to ethylene treatment of mature apple fruit from an ACC oxidase knockout plant [22]
which also had significantly altered expression during fruit ripening in the fruit development array.
a Annotation of the apple genes, based on BLAST comparison of genes with public databases.
BMC Plant Biology 2008, 8:16 />Page 20 of 29
(page number not for citation purposes)
CN945062 may be a PGR5 homologue involved in pho-
tosynthesis, CN909757
is likely to be an F-box protein,
and CN876487
which is expressed during cell expansion
is similar to Sec5A and may be involved in exocytosis.
However CN902741
still remains unannotated. The role
of these genes in fruit development remains to be deter-
mined.
Comparison of gene expression between apple cultivars
A recent report has examined expression of apple genes
early in fruit development using an array of 3484 cDNAs
[25]. These authors identified 88 unique apple genes
expressed more in whole young fruit (21 DAA) than in
whole mature fruit (175 DAA) in the cultivar Fuji. Eighty-
four homologues of these genes were identified in our EST
database, 42 of these were represented on our microarray.
Of these 42 genes, 17 were selected as changing signifi-
cantly during fruit development, 13 in the EFD cluster and
four in the MD cluster (Table 6).
Since the criteria used to select significantly changing
genes was fairly stringent we plotted expression patterns
for all the matches between our data and the selected early
fruit development genes from Lee et al. [25] in order to
identify any additional genes with similar patterns of
expression (data not shown). Eighteen genes identified by
Lee et al. [25] as being up-regulated were not confirmed in
our microarray, however, an additional 13 genes were
identified with high expression early in Royal Gala fruit
development, and low expression in ripening (Table 6).
Identification of ethylene responsive fruit development
genes
The hormone ethylene plays a major role in fruit ripening
in many fruit, including apple, leading to the respiratory
burst and final fruit softening [20,21,34,35]. Recent work
has used a transgenic apple tree (expressing an antisense
copy of the ACC oxidase gene) which produces no detect-
able ethylene to examine gene expression changes and
production of volatile compounds associated with apple
aroma [22]. Fruit from this tree mature, but do not ripen
or soften, unless treated with exogenous ethylene. Schaf-
fer et al. [22] used the apple oligonucleotide array
described here to identify 944 apple cortex and skin genes
that respond to ethylene. Because the ripe fruit samples in
the fruit development experiment consisted of cortex tis-
sue only we identified only those genes that change by at
least 2-fold in cortex (after excluding 25 genes with very
low expression), giving a list of 456 genes that respond
strongly to ethylene in fruit cortex. Of these 456 ethylene-
responsive genes, 106 also changed significantly during
the ripening phase of normal fruit development. These
ethylene-responsive fruit-cortex ripening genes are shown
in Table 7 and are grouped by ripening sub-cluster. The
distribution of the genes was uneven between the three
clusters with a greater percentage of the R2 cluster also
identified as ethylene responsive (10 of 70 genes (14.3%)
in R1, 48 of 195 genes (24.6%) in R2 and 48 of 408 genes
(11.8%) in R3). Included amongst these genes was one
gene identified as a putative ethylene receptor, most sim-
ilar to the ETR2/EIN4 receptors from Arabidopsis (apple
EST166801, Genbank acc. EE663937
). The apple microar-
ray also contains oligonucleotide probes for four addi-
tional putative ethylene receptor genes. Expression of
three of these genes was not significantly changed during
the ethylene microarray experiment or during normal
fruit ripening (apple EST152541, Genbank acc.
CN898978
, apple EST248756, Genbank acc. CN910963,
apple EST244637, Genbank acc. CN902679
). The fourth
gene (apple EST166743, Genbank acc. EE663931
, most
similar to the ERS1/ETR1 receptors from Arabidopsis) was
selected as induced by ethylene, and although it was not
selected as significantly changing during fruit develop-
ment, it does show some induction in normal fruit ripen-
ing.
Discussion
Confirmation of microarray expression patterns by qRT-
PCR
At each of the steps used to produce microarray data, var-
iability can be introduced leading to potential errors. We
used qRTPCR of cDNA from the same samples of RNA
used in the microarray experiment itself to estimate the
overall accuracy of our data. Overall we found good corre-
lation between qRT-PCR and microarray results with 75%
of microarray expression patterns reproducible by qRT-
PCR. However, 25% of expression patterns for which the
qRT-PCR results did not match the microarray result. In
some cases (~5%), this difference seems to be associated
with genes where the genomic DNA reference sample gave
very high intensity binding. It is possible that this high
level of gDNA binding distorted the ratios observed or the
gDNA binding may have interfered with cDNA binding
for those genes. Another possible explanation for qRT-
PCR results disagreeing with microarray results is that the
oligo on the microarray was able to hybridise to more
than one allele of a gene in the sample, and qRT-PCR
primer binding was more specific. Alternatively the micro-
array oligo may be hybridizing to more than one member
of a gene family. These results would suggest that hybrid-
ization conditions on the microarray are not stringent
enough, however during initial optimization of the meth-
ods any increase in stringency resulted in a large loss of
signal intensity (data not shown). Furthermore, we have
approximately 20 oligos on the array that were designed
to EST sequences which when re-sequenced were shown
to have a single base mismatch to the consensus sequence,
these oligos do not bind labelled targets whereas perfect
match oligos to the same targets do produce good signal
BMC Plant Biology 2008, 8:16 />Page 21 of 29
(page number not for citation purposes)
(data not shown) suggesting hybridization stringencies
are close to optimal.
Different functional classes of genes are expressed at
different times during fruit growth
A comparison between the whole array and the selected
1955 genes identified differences in distribution of func-
tional categories, suggests that the genes selected as chang-
ing significantly is a non-random selection from the
whole array. The increases in "metabolism" and "energy"
classes as compared with the whole array are not unrea-
sonable given the large changes occurring in organ devel-
opment and the accumulation of starch and sugar and
later in ripening and production of flavour compounds.
The remaining functional classes show only minor differ-
ences between the whole array and the selected 1955 and
this may reflect some bias in the EST sequences [24]. Since
the majority of libraries used in the original EST sequenc-
ing were from fruit or floral buds, it is reasonable to expect
functional classification of the whole array to be similar to
the classification for those genes regulated in fruit devel-
opment.
When the functional classifications for the four major
clusters are compared, some interesting changes in the
proportions of genes in each category are observed,
although interpretation of these changes must be made
with caution since each cluster represents a different set of
genes. The proportion of metabolic and energy gene func-
tions is high in buds and declines during development
and then increases in ripening fruit. This late increase may
reflect an increase in secondary metabolite gene expres-
sion as flavour compounds are produced during ripening.
An indication of this can been seen when the functional
categories are examined in more detail. While the overall
"metabolism" classifications are similar for FB and ripen-
ing clusters (21.5% vs 20.9%) the MIPS category 01.06 for
lipid, fatty-acid and isoprenoid metabolism, which
include the known flavour components such as terpenes,
shifts from 2.6% in FB to 4.3% in the ripening cluster
(data not shown).
A limitation of functional analysis is that it can only pro-
vide information about genes for which some function
has been previously identified. While functional classifi-
cation of genes is a useful approach to analysis of micro-
arrays it is the combination of functional classification
with other approaches (e.g. clustering) that allows infor-
mation to be more easily identified in the data, for exam-
ple identifying genes associated with cell division that are
most highly expressed early in development.
Cell cycle genes are regulated at the transcriptional level
early in fruit development
The development of apple fruit involves an early period of
cell division that lasts for approximately 30 days after pol-
lination [17,18]. Regulation of cell cycle genes is complex
however it is possible that transcriptional regulation of
some of the core cell cycle genes are involved in the con-
trol of cell division during fruit development. Control of
the core plant cell cycle genes at the transcriptional level
has been associated with regulation of the cell cycle in
synchronised Arabidopsis and tobacco BY2 cell cultures
[30,36-38]. Because of the nature of our samples, we
would not be able to detect such cycle-dependent tran-
scriptional regulation. However, at least one of the core
cell cycle genes has been shown to be regulated develop-
mentally in plants; CDKB1;1 has been associated with
control of cell division in Arabidopsis leaf development,
and expression of CDKB1;1 declines as Arabidopsis leaves
get older [39,40]. Alteration of CDKB1;1 activity in leaves
by expression of a modified form of CDKB1;1 changes cell
size and endoreduplication. Two putative CDKB homo-
logues in the apple fruit development microarray changed
significantly, both of these apple genes decline in expres-
sion at the time that apple cell division stops suggesting a
role for these genes in the regulation of this process. The
third core cell cycle gene that changed significantly during
fruit development is a CKS1 homologue. CKS1 has been
shown to associate with CDKB proteins and has been pro-
posed to act as a docking protein for regulators of CDK
activity [41] and also has been shown to associate with the
SCF complex involved in degradation of kinase inhibitor
proteins (KIPs in animals, KRPs in plants, [41,42]). The
expression of these three cell cycle associated genes at the
time when apple fruit are undergoing cell division sug-
gests they are important developmental regulators in
apple. Altering expression of these genes would allow elu-
cidation of their function and perhaps lead to fruit with
altered cell numbers leading to changes in fruit texture
and size.
The G1 to S transition is an important control point in the
plant cell cycle and the CycD3;1 gene has been shown to
be limiting for this transition in Arabidopsis [43]. No
orthologue for this gene has been identified in apple
although three homologous genes are represented on the
array. None of these homologues varied significantly dur-
ing development but one (EB132575
) declined approxi-
mately 2-fold late in apple fruit development.
Endoreduplication has been associated with increases in
cell size in many plants [44]. Studies in Arabidopsis sug-
gest that inhibition of mitotic CDK complexes by the
kinase inhibitors KRP1 [45] and KRP2 [46] and the kinase
Wee1 [47] can lead to increased endoreduplication. Inter-
estingly, a recent report suggests there is no endoredupli-
BMC Plant Biology 2008, 8:16 />Page 22 of 29
(page number not for citation purposes)
cation in mature apple fruit [48]. Perhaps not surprisingly
then, apple homologues of these genes were not selected
as having changed significantly during fruit development,
however the apple Wee1 homologue does show some
increase in expression immediately after cell division
ceases. The role of these genes in regulation of endoredu-
plication in apple, if any, is not clear but it may be possi-
ble to induce endoreduplication in apples by altering
expression of these genes.
Starch metabolism is regulated at the transcriptional level
in fruit
Although the biochemical activities of many starch
enzymes have been defined, it is difficult to assign the
roles of different enzyme pathways in the regulation of
starch levels in fruit. Matching the gene expression pro-
files produced in this study to known changes in starch
content throughout apple development is one approach,
implicating certain pathways in these processes. While we
did not observe coordinated expression of complete path-
ways, there was co-expression of several genes in one
pathway. For example, the expression profiles of sucrose
phosphatase (EB156512
) and a sucrose-phosphate syn-
thase (EB123469
) mirrored the reduction in apple starch
content during both early fruit development and during
ripening [19], suggesting that these enzymes may be com-
ponents of the starch degradation pathway in fruit devel-
opment. However, it is also possible that distinct
pathways are responsible for these early and late starch
degradation events. The high transcript levels of β-amy-
lase (EB114557
) and α-glucosidase (EE663791) early in
development but not during ripening are evidence of a
starch degradation pathway that may be specific to early
development and not active in late development. These
results suggest that distinct starch metabolic pathways are
important and are regulated at the transcriptional level in
apple fruit development.
One observation made during the analysis of the starch
metabolism pathways was that for any given step there
were usually several candidate genes for a particular
enzyme. For example there are two plastidic starch syn-
thases in the Arabidopsis databases. Both have homo-
logues in the apple EST database, and one has homology
to two apple genes. Expression of only one of these candi-
date starch synthase genes in apple fruit (represented by
EB121923
, Figure 5) peaked at 87 DAA, just prior to the
peak in fruit starch content at 100 DAA [19]. This correla-
tion of expression data with the pattern of starch accumu-
lation during development suggests that this particular
starch synthase gene is involved in regulation of starch
levels during fruit development. These results show that
microarrays can be used to correlate transcript levels with
physiological and biochemical observations to identify
which member of a gene family, or even perhaps which
allele, is likely to be involved in the process of interest.
The expression profiles of nine starch enzymes (Figure 5)
showed that developmental regulation of the transcrip-
tion of these genes corresponds to observed changes in
starch levels throughout apple development. In a similar
study, Smith et al. [49] used Affymetrix microarrays to
observe εchanges in the expression of starch enzymes over
a diurnal cycle in Arabidopsis leaves. In leaves, starch is
synthesised in the light and degraded in the dark. These
authors observed distinct changes in the transcript levels
of enzymes such as starch synthase and β-amylase. It is
interesting that there is evidence of transcriptional regula-
tion of starch in both Arabidopsis leaves where light- and
sugar-regulated changes in starch occur over a 24-hr
period, and in apple fruit where developmental regulation
of starch takes place over a 146-day period. This transcrip-
tional regulation of starch in both source and sink tissues
may be required to coordinate the partitioning of carbo-
hydrates throughout a plant.
Comparison of microarray experiments examining fruit
development
Comparison of microarray experiments from different
species targeted to the same developmental process offers
the opportunity to compare gene expression patterns for a
large number of genes. The attraction of such a compari-
son is that it may identify processes common to different
fruit and hence important in the fundamental processes
occurring in all fruit. For some published studies however,
the size of the datasets and/or differences in samples stud-
ied make comparisons of limited value [11,15,25]. For
example, specific searches of the tomato microarray
results given by Lemaire-Chamley et al. [11] for genes
expressed in both apple (this work) and tomato [13] early
in fruit development did not identify similar genes, prob-
ably because these genes were not included in the
Lemaire-Chamley array of 1393 tomato cDNAs e.g. IPP
isomerase homologues (SGN-U334957 and EG631180),
catalase homologues (SGN-U313439 and CN929316
)
and Histone 2B homologues (SGN-U315396 and
CN897140
). Where the apple microarray identified a
CDKB2 gene as up-regulated early in fruit development
(dividing cells), a comparison of tomato locular (expand-
ing cells) and tomato pericarp (dividing cells) identified a
CDKB2;2 homologue as up-regulated in locular tissue
[11].
A microarray experiment using apple (3484 cDNAs, 'Fuji')
compared 21 DAA with fully ripe fruit [25]. Comparing
our data with that of Lee et al. [25] allows identification of
regulated genes that may be otherwise excluded as not sig-
nificantly changing in one of the two experiments. One
such gene is EB129884
an α-expansin homologue, identi-
BMC Plant Biology 2008, 8:16 />Page 23 of 29
(page number not for citation purposes)
fied as highly expressed in 21 DAA fruit in the Fuji micro-
array, was excluded from the Royal Gala microarray by
ANOVA analysis because two samples (132 and 146 DAA)
had no detectable expression. In the Royal Gala microar-
ray this α-expansin had strongest expression at 14 DAA
and maintains expression through to 87 DAA and then
has no detectable expression, making it a good candidate
for an expansin involved in the formation and expansion
of the fruit cells. Without the comparative analysis with
the data from the Fuji microarray this gene would not
have been identified.
Using a microarray containing 12899 ESTs representing
~8500 tomato genes Alba et al. [13] studied gene expres-
sion through tomato fruit development, focusing pre-
dominantly on ripening. It was perhaps surprising to find
only 102 genes in common between the tomato fruit
development microarray and the apple data presented
here. The differences in experimental design may be one
reason for this small overlap, with the tomato microarray
having more sampling around ripening and the apple
microarray more sampling of the floral bud and early fruit
development. It may also be an indicator of the differ-
ences between apple and tomato fruit development.
When expression patterns for the similar apple and
tomato genes were compared, only 16 out of 46 genes
studied had similar patterns of expression in both apple
and tomato. Since approximately 75% of apple microar-
ray expression patterns are reproducible in qRT-PCR, and
presumably the same is true for the tomato microarray, for
each pair of genes there is only an approximately 56%
chance that both patterns are reproducible. Thus at best
we would expect only 26 pairs to have the same pattern of
expression. In addition, since the sequence similarity
threshold used was fairly low it is also likely that some of
the pairs of genes examined are not orthologous genes.
Nevertheless it is likely that identifying only 16 pairs of
genes with similar expression patterns in both apple and
tomato is an underestimate of the actual similarity
between the fruit. Where patterns of expression do have
similarity between apple and tomato it is probable that
the microarray pattern of expression represents the actual
pattern of expression for those genes, since the expression
pattern has effectively been confirmed in another species.
It is probable that when more complete whole genome
arrays are used and when more closely matched sampling
is carried out, many more genes with similar expression
will be identified. As further microarray experiments are
performed in other fruiting species the inclusion of sam-
ples at standardized developmental stages will allow bet-
ter comparison of datasets and more common
fundamental processes to be identified.
Of the 16 pairs of tomato and apple genes identified,
seven show up-regulation in ripening and four showed
down-regulation. This almost certainly reflects the
emphasis on ripening samples in the tomato microarray.
Homologues of β-carotene hydroxylase, alcohol dehydro-
genase and phytoene synthase are all up-regulated during
ripening in both apple and tomato, suggesting these
enzymes play significant roles in formation of the colour
and flavour compounds associated with ripening fruit.
However, carotenoids are not typically high in apple fruit
flesh [50] suggesting either that production of carotenoids
in apples is blocked at another step in the biosynthetic
pathway or that the products of these enzymes are further
processed into forms that have not yet been measured in
apples. While homologues of IPP isomerase, catalase, His-
tone 2B and the RIN MADS-box gene are all up-regulated
in ripening in both apple and tomato they were all also
selected in the apple microarray as up-regulated early in
fruit development, although for the MADS-box gene the
up-regulation may be more associated with high expres-
sion in floral buds. The role of this early expression for
these genes is uncertain but it would be interesting to see
if they were also highly expressed early in tomato fruit
development. One integral plasma membrane protein
homologue and one expansin homologue showed similar
patterns of expression in both apple and tomato and were
selected in the mid development cluster in the apple
microarray. This result suggests these two genes play
important roles in cell expansion during fruit develop-
ment. We also identified genes without annotation that
have similar patterns of expression in both apple and
tomato fruit. Such comparisons are valuable in order to
find genes for which the function is conserved for a partic-
ular process that may not be identified by other methods.
Further work will allow us to determine whether these
genes indeed play an important role in fruit development.
Intersections between different apple microarray
experiments
A comparison between two apple experiments using the
same microarray was useful to identify genes involved in
both fruit ripening and the ethylene response. The combi-
nation of the two datasets provides more information
than each experiment on its own. The importance of eth-
ylene in apple fruit ripening is demonstrated by the lack
of ripening in ACC oxidase knockout fruit [22]. When we
compared datasets from the ethylene induction and the
fruit development microarray, 106 of the ethylene
induced genes (in cortex) were found in the ripening clus-
ter (668 genes) of the developmental microarray. The
observation that 350 of the ethylene induced genes were
not identified as having altered expression during the
endogenous ripening process implies that these genes do
not have roles in normal fruit ripening, or that the induc-
tion of these genes is below the level of significance used
BMC Plant Biology 2008, 8:16 />Page 24 of 29
(page number not for citation purposes)
to select genes in this work. These results suggest that
while ethylene is a major regulator of gene expression in
fruit ripening, a large portion of fruit ripening occurs in
the absence of ethylene. Using this comparative approach
it is possible to identify fruit ripening events that are both
ethylene dependent and independent.
Conclusion
The data presented here provide a picture of the molecular
events occurring throughout the development of the
apple fruit and provide a resource for future study of fruit
development. We have identified genes that are likely to
be important in some of the major processes. Comparison
of the apple data with other fruiting plants identified 16
genes that may play fundamental roles in fruit develop-
ment. Comparisons between experiments in apple allows
differentiation between ethylene dependent and inde-
pendent ripening. Future work will determine the specific
function of these genes. Functional analysis of CDKB and
CKS expression in fruit tissue early in development may
reveal the mechanisms that control the growth of the cor-
tex tissue to surround the core. Manipulation of expres-
sion of these genes may alter cell size and number in fruit,
perhaps affecting fruit shape, size and texture. These data
allow us to begin to develop an understanding of the
molecular events that lead to the division and expansion
of tissues surrounding a developing seed to form a fruit.
Methods
Growth and maintenance of trees and sampling
Apple (Malus × domestica Borkh. also known as M. pumila)
trees from 'Royal Gala' were grown on M9 rootstocks and
managed according to standard orchard practices (except
that no chemical fruit thinning was allowed to take place).
For the 0 DAA sample, buds were stripped of petal and
petiole but otherwise not further dissected. For samples
taken at 14, 25, 35 and 60 DAA, whole fruit were sampled
with only the petiole removed. For each sample at least 10
individual whole fruit were pooled. For samples taken at
87, 132 and 146 DAA cortex tissue only was dissected
from at least 10 fruit and pooled. All samples were frozen
in liquid nitrogen at time of harvest and then stored at -70
°C.
RNA extraction
Total RNA was extracted from 6 g of each tissue ground
under liquid N
2
conditions using a modified method of
Chang et al. [51]. The protocol was amended with a 1 min
polytron step after addition of the extraction buffer, the
aqueous phase after the first chloroform extraction was fil-
tered through autoclaved Mira cloth, and the total concen-
tration of LiCl was 2 M. Isolated RNA was column purified
(using RNAeasy Mini Kit, Qiagen, Hilden, Germany) and
the quality and purity was checked using an Agilent 2100
Bioanalyser (Agilent, Palo Alto, CA). RNA was ethanol
precipitated and resuspended to 12.5 µg/µL.
Array design
Apple ESTs were grouped into non-redundant sequences
and unigenes as described in Newcomb et al. [24]. For
each EST, oligonucleotides were designed using an in-
house algorithm, with a Tm of 74°C ± 2°C and length
between 45 and 55 bases. Oligos with inverted or direct
repeats and runs of more than 5 identical nucleotides
were eliminated. A single oligo was selected for each uni-
gene from the EST closest to the 3' end of the unigene and
where more than one possible oligo was available for an
EST, the 3' most oligo selected. As a final selection crite-
rion unigenes were compared (using BLAST) with the
database of apple unigenes and to the Arabidopsis protein
database. For apple unigenes with high sequence similar-
ity to other apple unigenes or where two apple unigenes
had high sequence similarity to the same Arabidopsis pro-
tein only a single representative apple unigene was
selected for oligo design. Using these criteria 15726 apple
oligos were designed corresponding to 15145 apple uni-
genes (Table 1). Comparison of the apple unigenes with
Arabidopsis and other plants suggests that the array con-
tains approximately 13000 different genes. Oligos were
synthesized commercially (5000 by Operon and 10726
by Illumina). Oligos were resuspended in 150 mM
NaPO4 pH 8.5 containing 0.00001% SDS to a final con-
centration of 20 µM and printed on epoxy array slides
(Quantifoil) using a MicroGrid TAS arrayer using 16
microspot 2500 pins for a total of 32 blocks. Since oligos
were selected and synthesized in random order, no addi-
tional randomization of the array was necessary.
In addition to the sample oligos, each block contains four
types of control oligos (Table 8). Group 1, apple oligos
designed from: the 3', middle and 5' ends of an apple
actin unigene (MdAC1–3, EST3793, Genbank acc.
CN935584
), an apple ubiquitin unigene (MdAC4–6,
EST14223, Genbank acc. EB109811
) and an apple elon-
gation factor-1-α gene (Md AC7–9, EST704, Genbank acc.
CN934151
); oligos from apple rubsico small subunit
(MdAC10, EST 59854, CN862467); an apple homeobox
unigene, 5' end (MdAC11, EST87558, Genbank acc.
CN870331
), 3' end (MdAC12 EST29626, Genbank acc.
EB111272
) and conserved domain (MdAC13, EST29626,
Genbank acc. EB111272
); an apple MADS-box gene, 3'
untranslated region (MdAC14, EST58802, Genbank acc.
EB175510
), 3' coding region (MdAC15, EST64768, Gen-
bank acc. EB116541
) and MADS domain (MdAC16,
EST15992, Genbank acc. EB114519
).
Group 2, control oligos associated with transgenic plants:
Bacillus thuringiensis cry1Ac (BtAC17, Genbank acc.
U89872
); Streptomyces hygroscopicus phosphinothrycin
BMC Plant Biology 2008, 8:16 />Page 25 of 29
(page number not for citation purposes)
acetyl transferase (ShAC18, Genbank acc. X17220); GFP
(Av AC19, Genbank acc. AF078810
); Homo sapiens hemo-
globin (HsAC20, Genbank acc. NM_000518
); GUS
(EcAC21, Genbank acc. A00196
); E. coli hygromycin B
phosphotransferase (EcAC22, Genbank acc. K01193
);
luciferase (PpAC23, Genbank acc. X65316
); Neomycin
phosphotransferase (EcAC24, Genbank acc. V00618
).
Group 3, control oligos from human genes not expected
to be expressed in plants: B-cell receptor protein
(HsAC25, Genbank acc. AF126021
); Mysoin heavy chain
(HsAC26, Genbank acc. X13988
); Myosin reg. light chain
2 (HsAC27, Genbank acc. M21812
); Insulin-like growth
factor (HsAC28, Genbank acc. X07868
); cDNA
FLJ10917fis (HsAC29, Genbank acc. AK001779
);
HSPC120 (HsAC30, Genbank acc. AF161469
); β2
microglobulin (HsAC31, Genbank acc. NM_004048
);
Phosphoglycerate kinase (HsAC32, Genbank acc.
NM_000291
); Tyrosine phosphatase (HsAC33, Genbank
acc. L11329
); G10 homolog edg-2 (HsAC34, Genbank
acc. U11861
).
Group 4, control oligos expected to have the same level of
expression in all tissues based on analysis of Arabidopsis
Table 8: Control oligos
Control name Apple EST Genbank Acc. TAIR acc.
MdAC1 1412 EB106245 CGAACCAACACCAAAGGCCCTCAAGGCGGGCAGCATCACTACCAT
MdAC2 1412 EB106245
GCTCTTCCACATGCCATCTTGAGGCTTGACCTTGCAGGTCGTGAT
MdAC3 1412 EB106245
TACTTAAAATGTCTGGATTCTATGAGTTTGTAGGTTTGCCGCTGG
MdAC4 14223 EB109811
CTTCAATCTGAAAAATCTTCCTTCAAATTCTCTTTCCAAGCTTCTTCAGCC
MdAC5 14223 EB109811
TGAGGTGGAGAGCTCCGACACCATAGACAACGTGAAGGCCAAGATTCAAG
MdAC6 14223 EB109811
AATGGTACTGTTTTTGCCTCCTAAGATGAGGCATCTGGGCAAGTTTGTG
MdAC7 704 CN934151
CAACATCGTGGTCATTGGCCATGTCGACTCCGGCAAGTCGACCAC
MdAC8 704 CN934151
TGTTGAGACTGGTATCGTCAAGCCTGGTATGGTTGTGACTTTTGG
MdAC9 704 CN934151
GGTGGTGACCCATCAAGTTTATGTTGTGTCGATTCCGCCTTCTGA
MdAC10 59854 CN862467
GTGTTATGTATGCATAAGGAAGGTTATGGTTTATGCTGCTCCCTG
MdAC11 8626 CN923132
GCCATAAGCTTTAAGCTCTTCTCTCTGATTTCTCACAATTCAACTCGC
MdAC12 29626 EB111272
ACGAGCCTTGCACCAACCTTAATTTGAAAAGAAGTAATGCAAGTG
MdAC13 29626 EB111272
AAGACGATAAACAACTGGTTCATCAATCAGCGGAAGAGGAACTGG
MdAC14 58802 EB175510
CCTGGGTGGATGCTTTGACTTTGTTTGTGCCTAATAATAATACCC
MdAC15 64768 EB116541
GACTCTGGAACCATTATATGAATGCCATCTCGGATGCTTTGCTGC
MdAC16 15992 EB114519
ACGAATCGAGAACACGATAAGCAGGCAAGTGACATTCTCAAAGAG
BtAC17 U89872
TTCCAATTCACTTCCCATCGACATCTACCAGATATCGAGTTCGTG
ShAC18 X17220
CACCATCGTCAACCACTACATCGAGACAAGCACGGTCAACTTCCG
AvAC19 AF078810
GCCCTGTCCTTTTACCAGACAACCATTACCTGTCCACACAATCTG
HsAC20 NM_000518
GTGTGGCTAATGCCCTGGCCCACAAGTATCACTAAGCTCGCTTTC
EcAC21 A00196
TAACAAGAAAGGGATCTTCACTCGCGACCGCAAACCGAAGTCGGC
EcAC22 K01193
GTCTGGACCGATGGCTGTGTAGAAGTACTCGCCGATAGTGGAAAC
PpAC23 X65316
AGAGAGATCCTCATAAAGGCCAAGAAGGGCGGAAAGTCCAAATTG
EcAC24 V00618
TCGCAGCGCATCGCCTTCTATCGCCTTCTTGACGAGTTCTTCTGA
HsAC25 AF126021
CAGTGTTGTTCCCTCCCTCAAGGCTGGGAGGAGATAAACACCAAC
HsAC26 X13988
AAGAGTGAGCCAGCCCTTCTGGAGCAGGAGCAGGACAGAAGATAT
HsAC27 M21812
CACGCAGTGTGACCGCTTCTCCCAGGAGGAGATCAAGAACATGTG
HsAC28 X07868
TCAGCTCCTTTAACGCTAATATTTCCGGCAAAATCCCATGCTTGG
HsAC29 AK001779
GTGCCGGACTTACCTTTCATTGAACATGCTGCCATAACTTAGATT
HsAC30 AF161469
ATGCTTAAGATTCAACTGGGAGCATACCAGGGATGCTCTCTAACG
HsAC31 NM_004048
TGGCAACTTAGAGGTGGGGAGCAGAGAATTCTCTTATCCAACATC
HsAC32 NM_000291
GCTCATCTTCACTGCACCCTGGATTTGCATACATTCTTCAAGATC
HsAC33 L11329
GTGTCATGTTGCGTGTGTCTGTCTGTGAGCCTTTCACACCTGTGC
HsAC34 U11861
GAGTTGGAGCACGGTCTCTATGGGGAAGCGTTCGCTGTCTATCAG
Aunc1 At1g14400 GCTAACTCCTGATGGAGAGCTTTCGAAAATCAGTTGAATCAACCTCTGTT
Aunc2 At1g16210 GTCGATTTCATCATCATGTCCACCGATGTGCATTTGCAATTTGAAACGCAT
Aunc3 At1g43900 CCGGCTCAGAGTAAGGACTTGGATTCCTACCTTATTGGTAGGGTGGCGGTGC
Aunc4 At3g13060 GCCTGCCCGTGACGAGAGCGGTGCTACTATTAGGCATTTTACGAGTTAGCC
Aunc5 At3g19420 ATGCCTCCGTTTTCTCGTTTGGAGATGACGAGGACTCTGAAAGTGAGTAAAC
AAGG
Aunc6 At3g19760 CACAGAATTGGTCGTAGTGGACGTTTTGGAAGGAAGGGTGTTGCCATCAACT
TCG
Aunc7 At4g00660 GCCGGTGATTGGTGGTGGAGAACCTTGATGTGACAGCAATGATGGGATGA