báo cáo khoa học: " Construction of nested genetic core collections to optimize the exploitation of natural diversity in Vitis vinifera L. subsp. sativa" ppt
Bạn đang xem bản rút gọn của tài liệu. Xem và tải ngay bản đầy đủ của tài liệu tại đây (418.74 KB, 12 trang )
BioMed Central
Page 1 of 12
(page number not for citation purposes)
BMC Plant Biology
Open Access
Research article
Construction of nested genetic core collections to optimize the
exploitation of natural diversity in Vitis vinifera L. subsp. sativa
Loïc Le Cunff*
1
, Alexandre Fournier-Level
1
, Valérie Laucou
1
, Silvia Vezzulli
2
,
Thierry Lacombe
1
, Anne-Françoise Adam-Blondon
3
, Jean-Michel Boursiquot
1
and Patrice This
1
Address:
1
UMR 1097 DIA-PC, Equipe « génétique Vigne », INRA-Supagro, 2 place Viala, F-34060 Montpellier, France,
2
IASMA Research Center,
38010 San Michele all'Adige (TN), Italy and
3
UMR 1165 INRA-CNRS-Université d'Evry Génomique Végétale, 2, rue Gaston Crémieux CP 5708, F-
91057 EVRY cedex, France
Email: Loïc Le Cunff* - ; Alexandre Fournier-Level - ; Valérie Laucou - ;
Silvia Vezzulli - ; Thierry Lacombe - ; Anne-Françoise Adam-Blondon - ; Jean-
Michel Boursiquot - ; Patrice This -
* Corresponding author
Abstract
Background: The first high quality draft of the grape genome sequence has just been published.
This is a critical step in accessing all the genes of this species and increases the chances of exploiting
the natural genetic diversity through association genetics. However, our basic knowledge of the
extent of allelic variation within the species is still not sufficient. Towards this goal, we constructed
nested genetic core collections (G-cores) to capture the simple sequence repeat (SSR) diversity of
the grape cultivated compartment (Vitis vinifera L. subsp. sativa) from the world's largest germplasm
collection (Domaine de Vassal, INRA Hérault, France), containing 2262 unique genotypes.
Results: Sub-samples of 12, 24, 48 and 92 varieties of V. vinifera L. were selected based on their
genotypes for 20 SSR markers using the M-strategy. They represent respectively 58%, 73%, 83%
and 100% of total SSR diversity. The capture of allelic diversity was analyzed by sequencing three
genes scattered throughout the genome on 233 individuals: 41 single nucleotide polymorphisms
(SNPs) were identified using the G-92 core (one SNP for every 49 nucleotides) while only 25 were
observed using a larger sample of 141 individuals selected on the basis of 50 morphological traits,
thus demonstrating the reliability of the approach.
Conclusion: The G-12 and G-24 core-collections displayed respectively 78% and 88% of the SNPs
respectively, and are therefore of great interest for SNP discovery studies. Furthermore, the
nested genetic core collections satisfactorily reflected the geographic and the genetic diversity of
grape, which are also of great interest for the study of gene evolution in this species.
Background
The study of natural allelic diversity has proved fruitful in
understanding the genetic basis of complex traits [1-6].
However, exploiting it successfully through association
genetics requires basic knowledge of the extent of allelic
variation within a species. One of the most interesting
Published: 2 April 2008
BMC Plant Biology 2008, 8:31 doi:10.1186/1471-2229-8-31
Received: 26 November 2007
Accepted: 2 April 2008
This article is available from: />© 2008 Le Cunff et al; licensee BioMed Central Ltd.
This is an Open Access article distributed under the terms of the Creative Commons Attribution License ( />),
which permits unrestricted use, distribution, and reproduction in any medium, provided the original work is properly cited.
BMC Plant Biology 2008, 8:31 />Page 2 of 12
(page number not for citation purposes)
ways to achieve this goal consists of developing high-den-
sity diversity maps like the those developed in human and
chicken, which allow the identification of causal poly-
morphisms for important traits [7-10]. The recent publi-
cation of the first high quality draft of the grapevine
genome sequence opens the way to building such a diver-
sity map [11]. Like in animals or in other perennial plant
species where genetic approaches based on the study of
segregating populations are hampered by a long biologi-
cal cycle, association genetics is of particular interest in
grapevine.
The development of diversity map relies on the discovery
of sequence polymorphisms in the genome in a small set
of genotypes that are as representative as possible of avail-
able genetic diversity. Such a concept was first proposed
by Frankel and Brown under the name of core collection
[12]. Core collections can be built using different types of
markers. For example, molecular markers were used for
rice, wheat and potato, while for yam a core collection was
built using the origin of cultivars, eating quality, tuber
shape, tuber flesh colour, and morphotype [13-16]. Dif-
ferent strategies have been proposed to assist the construc-
tion of core collections including the M-Method
developed by Schoen and Brown and implemented in the
software MSTRAT [17-20]. This strategy has been success-
fully used for the construction of core collections in Arabi-
dopsis thaliana and Medicago truncatula and was also
proposed as a preliminary step in association genetics [21-
24].
Large collections of genetic resources are available for
grapevine especially in Europe [25]. The largest one is
held by INRA in France at the domain of Vassal: this col-
lection contains 7000 accessions of Vitis genus of world-
wide origin [26]. The genotyping of the whole collection
using 20 well-scattered SSR markers is complete Laucou et
al. (in prep). The cultivated compartment (V. vinifera L.
subsp. sativa) is represented by 3900 accessions corre-
sponding to 2262 unique genotypes (Laucou et al, in
prep), from 38 different countries. It represents about a
half of the known grapevine cultivars [27]. The Vassal col-
lection was highly diverse for V. vinifera L. subsp. sativa,
exhibiting a total of 326 alleles for the 20 SSRs markers
with an average of 16.3 SSR alleles per locus (Laucou et al,
in prep). Moreover a large proportion of these alleles
(17%) were present at very low frequency (freq < 0.05%).
A first core collection (M-core) in grape was recently
developed based on 50 morphological traits on 1759
accessions from the Vassal collection [28]. It was used for
a preliminary study of the extent of linkage disequilib-
rium (LD) in V. vinifera L. as well as for association studies
[28,29]. However, the size of the M-core (141 individuals)
limits its use for the analysis of wide sequence diversity.
Here we present the use of the data set obtained by Laucou
et al. (in prep) to develop four nested genetic core collec-
tions (G-cores) suitable for the search for allelic diversity.
The ability of retaining the SSR genetic diversity using dif-
ferent sample sizes was studied and compared to the SSR
diversity present in the M-core and in the Vassal collec-
tion. Finally, the allelic diversity captured at the sequence
level in the different sub-cores was analysed by sequenc-
ing three gene fragments. This work provides the founda-
tion required for the development of a detailed map of
haplotypic diversity in grapevine.
Results
Construction of nested core collections representing the
available germplasm diversity of cultivated V. vinifera L
We first determined the optimal size of a core collection
by retaining the 271 alleles showing a frequency above
0.05%. Forty-eight cultivars were necessary to capture
100% of the 271 alleles (Figure 1A). Within this core col-
lection of 48 cultivars (G-48), we then determined the two
most diverse samples of 12 (G-12) and 24 (G-24) cultivars
(Table 1). In order to assess the robustness of these nested
core collections, we calculated the percentage of identical
varieties among the G-12, G-24 and G-48 core collections
Table 1: SSR diversity within each sample of the G-core compared to the Vassal collection with and without the rare allele (Restricted
Vassal collection).
Sample Name Size Number
of alleles
Nei's indices Observed
heterozygosity
Percentage of total
SSR diversity
Percentage of
restricted SSR
diversity
Correlation of SSR
frequency with Vassal
collection (R
2
)
Vassal collection 2262 326 0.76 0.75 100% 100%
Restricted Vassal
collection
2262 271 0.76 0.75 83% 100% 1
G-12 core 12 191 0.83 0.80 58% 70% 0.77
G-24 core 24 239 0.83 0.81 73% 88% 0.85
G-48 core 48 271 0.82 0.80 83% 100% 0.92
G-92 core 92 326 0.81 0.78 100% 100% 0.94
M-core 141 227 0.76 0.75 70% 81% 0.98
BMC Plant Biology 2008, 8:31 />Page 3 of 12
(page number not for citation purposes)
obtained in the second run using the same process, which
corresponded to 83.3% (10) of the varieties selected in the
two G-12 to 83.3% (20) of the varieties selected in the two
G-24 and to 60.24% (29) of the varieties selected in the
two G-48. Among these two sets of samples, the G-48 core
collection presenting the highest Nei's index was chosen
as the reference core collection (Table 2).
The G-48 core was used as a core to build the final core
collection retaining the 326 alleles found in the cultivated
compartment of Vitis vinifera L. represented in the Vassal
collection by Laucou et al. (in prep). The optimal size of
this final core collection was 92 individuals (Fig. 1B). The
cultivars added at this step contained only rare alleles
(freq < 0.05%, present on less than 3 copies), which cor-
responded to less choice for the selection of varieties.
Indeed, only two alternative samples were proposed by
MSTRAT, with only one individual differing between the
two samples: Rich baba rose faux versus Kizil. Again, we
selected the G-92 presenting the highest value for the
Nei's index as the reference core collection for the culti-
vated compartment of V. vinifera L; the resulting final core
collection is listed in Table 2.
In order to estimate the gain of SSR allelic diversity, we
compared the number of alleles captured in samples
obtained by the M-method and by random sampling. In
each case, when using the M-method, we observed a gain
(Table 3), the greatest of which being obtained for the
selection of the G-48.
Analysis of the diversity retained in the nested core
collections using different descriptors
The reference nested core collections for the cultivated
compartment of Vitis vinifera were described for several
characteristics and compared to the Vassal collection and
to the M-core collection (141 individuals) defined by Bar-
naud et al. [28].
SSR diversity
The nested core collections represented 58% to 100% of
the total SSR diversity of the Vassal collection and 70% to
100% of the restricted SSR diversity of the Vassal collec-
tion (only considering alleles with frequencies higher
than 0.05%) (Table 1). All the SSR alleles with a frequency
of more than 5% within the Vassal collection are present
in the G-12 core and all those with a frequency of more
than 3.5% within the Vassal collection are present in the
G-24. The values of the unbiased Nei's diversity index and
the level of unbiased observed heterozygosity for the G-12
core, G-24 core and G-48 core collection were quite simi-
lar and slightly higher than those calculated for the G-92
core collection. These values were slightly higher than
those of the Vassal collection and of the M-core (Table 1).
We also compared allele frequencies of the SSR markers in
the three G-cores and in the M-core with the frequencies
observed in the Vassal collection: the best correlation was
obtained between the Vassal collection and the M-core (r2
= 0.98) and the G-92 (r2 = 0.92) core collections (Table
1).
Geographic origin and final uses
The definition of the true geographical origin of grapevine
cultivars is sometimes difficult due to many migration
events with humans [30]. Based on current knowledge,
the cultivars held in the Vassal collection originated from
38 countries, with about half of them from Western
Europe (France, Iberian Peninsula and Italy). The cultivars
selected in the nested core collection originated from 27
different countries (Table 2). However 10 varieties of the
G-92 sample could not be assigned to a precise geograph-
ical origin. Among them, 9 varieties were recent crosses
between varieties from different countries (indicated by *
in the Table 2) and one have an unknown origin (Mosca-
tel de Oeiras faux). Moscatel de Oeiras faux microsatellite
data seemed to indicate a Western Europe origin when
compared to the whole collection. The origins of the 82
remaining varieties were well distributed (Figure 2): 21
(25%) came from the Caspian region (Dagestan, Georgia,
Armenia and Azerbaijan) and the Middle East (Iran)
which corresponds to the center of domestication, and 35
(42%) came from Western Europe and North Africa (Ibe-
rian Peninsula, Morocco, Algeria, Tunisia, Italy and
France) (Table 4). Interestingly, five varieties (6% of the
G-92) originated from Central Asia and Asia despite their
very limited representation in the whole collection (less
than 2%).
No differences were observed between the M-core (22
countries) and the Vassal collection (Table 4) whereas all
the G-cores differed from the Vassal collection. Indeed the
number of cultivars from Western Europe and the center
of domestication were more balanced in the G-92 core
with a very good representation of the whole set of geo-
graphic origins. The same trend was observed in the differ-
ent sub-cores (Table 4).
We also compared the G-92 core collection, the M-core
and the Vassal collection with respect to the final use of
the cultivars: wine making (wine cultivars), fruit con-
sumption (table cultivars) or both (wine/table cultivars).
The M-core and the different G-cores all resembled the
Vassal collection (Table 4).
Evaluation of the capture of unlinked diversity in the
nested core collections
Next, we assessed the ability of the nested G-core samples
to capture diversity unlinked to the SSR markers used to
build the nested core collection. Barnaud et al. estimated
using 38 SSR markers mapped on five different linkage
BMC Plant Biology 2008, 8:31 />Page 4 of 12
(page number not for citation purposes)
Table 2: Nested genetic core collection of 12 to 92 varieties.* Varieties bred from cultivars of different geographical origin: the
countries listed are breeding locations.
Size Variety name Variety number Country Nbr of alleles
12 Tsolikouri 2668 Georgia
12 Voskeat 2511 Armenia
12 Kapistoni tétri hermaphrodite (Coll. Kichinev) 3242 Georgia
12 Lameiro 3380 Portugal
12 Médouar 3381 Israel
12 Chirai obak 1186 Tajikistan
12 Espadeiro tinto 1498 Portugal
12 Araklinos 1805 Greece
12 Plant du Maroc E (Coll. Meknès) 2158 Morocco
12 César 225 France
12 Orlovi nokti 2461 Russia
12 Tsitsa Kaprei 2471 Moldavia 191
24 Variété d'oasis Bou Chemma 46 3281 Tunisia
24 Uburebekur 3270 Romania
24 Chouchillon 192 France
24 Mehdik 2082 Iran
24 Assyl kara 2505 Russia
24 Pervenetz praskoveïsky 2651 Russia
24 Pletchistik 2652 Russia
24 Ak ouzioum tagapskii 2897 Kyrgyzstan
24 Orbois 294 France
24 Cabernet franc 324 France
24 Katta-kourgan 556 Uzbekistan
24 Kichmich tcherni 3264 Turkey 239
48 Tandanya faux 3279 Australia*
48 Veltliner rot 284 Austria
48 Yapincack faux 3292 Turkey
48 Frühe Meraner 3183 Italy
48 Kisilovy 3349 Russia
48 Lumassina 3312 Italy
48 Mourisco (Coll. EVV Amandio Galhano) 3379 Portugal
48 Raisin banane noir 3384 Algeria
48 Riesling bleu 3073 France
48 Frappato di Vittoria 1318 Italy
48 Tinto Cao 1488 Portugal
48 Ag isioum 1563 Dagestan
48 Orangetraube 1569 Germany
48 Onusta 1980 Italy*
48 Malvasia di Sardegna 2166 Italy
48 Armenia 2267 Armenia*
48 Jo Rizling 2563 Hungary*
48 Krakhouna 2638 Georgia
48 Portan 2796 France*
48 Misguli kara 2917 Ukraine
48 Bayadi du Liban 2998 Lebanon
48 Bakarka 3008 Hungary
48 Catanese nero 2398 Italy
48 Retagliado bianco 67 Italy 271
92 Istchak rouge 3272 Uzbekistan
92 Verdelho tinto 3205 Portugal
92 Fantasy seedless 3051 USA*
92 Kaisi baladi 3219 Syria
92 Malahy 3238 Iran
92 Koutlaksky belyi 3160 Ukraine
92 Variété d'oasis Tozeur 17 3228 Tunisia
BMC Plant Biology 2008, 8:31 />Page 5 of 12
(page number not for citation purposes)
groups (LG) with a maximum distance of 30 cM that LD
in grape extends only within LG and is around 16.8 cM
maximum [28]. We analysed the polymorphism of three
gene fragments mapped further than 16.8 cM from the
SSR markers in the same linkage group. DFR mapped in
LG 18, 25.3 cM from the SSR marker VVIn16; L-DOX
mapped in LG 8, 26 cM from the SSR marker VMC1b11
and BURP mapped in LG 3, 26 cM from the SSR marker
VVMD28.
Forty-one nucleotide polymorphisms (40 substitutions
and 1 in/del) were observed in the G-92, ranging from 12
to 15 depending on the gene fragment (Table 5). The total
polymorphism is thus one SNP for 49 nucleotides. The
number of SNPs per base also varied between the three
gene fragments: one SNP for every 58 nucleotides for DFR,
one SNP for every 42 nucleotides for L-DOX and one SNP
for every 50 nucleotides for BURP. The difference of
genetic diversity between coding and non coding region
of the sequences was estimated only for the DFR sequence
which has a quite similar length of the two types of
regions. For this gene the polymorphism was different
between coding and non-coding regions with a ratio of
3.2 (one SNP for every 127 nucleotides for coding region
versus one SNP for every 39 nucleotides for non-coding
region). Considering all genes together, the number of
SNPs detected increased from 32 to 36 between the G-12
and the G-24 cores and from 36 to 40 between the G-24
and the G-48 cores. Only one more SNP was discovered in
the G-92 core than in the G-48 core for the L-DOX gene
fragment (this SNP is present in two varieties: Œil de
Dragon and Badagui). The higher number of SNPs in the
G-24 than in the G-48 cores was due to two genotypes:
Yapincack with three additional SNPs in the DFR gene
fragment and Kisilowy with one additional SNP in the L-
DOX gene fragment.
92 Long Yan 3142 China
92 Plant de Querol 98-N-2 (Coll. Torres SA) 3304 Spain
92 Albarola rossa faux (Coll. Pisa) 3329 Italy
92 Barbera selvatico del Grosseto 3320 Italy
92 Doppel Augen 3151 Azerbaijan
92 Duc de Magenta 819 France*
92 Graeco 3224 Tunisia
92 Lambrusco del Caset 3181 Italy
92 Badagui 3156 Georgia
92 Moscatel de Oeiras faux (Coll. Bordeaux) 3266 unknown
92 Nero grosso 3176 Italy
92 Agoumastos 3386 Greece
92 Rich baba rose faux 3154 Russia
92 Colorino 1353 Italy
92 Uva de Rey 1395 Spain
92 Tinta castellõa 1540 Portugal
92 Alburla 1606 Ukraine
92 Korithi aspro 1766 Greece
92 Canner seedless 1833 USA*
92 Agourane 1898 Algeria
92 Morlin gris 2067 France
92 Askari 2081 Iran
92 Bogazkere 2104 Turkey
92 Jeludovii 2253 Romania
92 Tchilar 2274 Armenia
92 Peygamber üzümü 2340 Turkey
92 Lambrusco viadanese 2351 Italy
92 Vernaccia di San Gimignano 2360 Italy
92 Alexandroouli 2500 Georgia
92 Malaga II (Dumas) 2570 France*
92 Sapéré otskhanouri 2655 Georgia
92 Khindogny 2664 Iran
92 Yapincak 2768 Turkey
92 Arna-guirna 2899 Azerbaijan
92 Romorantin 304 France
92 Mandilaria 341 Greece
92 Mauzac faux de Cahuzac 357 France 326
Table 2: Nested genetic core collection of 12 to 92 varieties.* Varieties bred from cultivars of different geographical origin: the
countries listed are breeding locations. (Continued)
BMC Plant Biology 2008, 8:31 />Page 6 of 12
(page number not for citation purposes)
Estimation of the ability to capture unlinked diversity of
the G-24 core and G-12 core was performed by comparing
their SNP diversity with SNP diversity in five random sam-
ples of 24 individuals in the G-48 core and 12 individuals
in the G-24 core. The number of SNPs in the different ran-
dom samples varied from 35 to 37 SNPs for the five ran-
dom samples of 24 individuals and from 30 to 34 SNP for
the five random samples of 12 individuals. In order to
compare SNP distribution, we also calculated the unbi-
ased Nei's index, which varied from 0.24 to 0.25 for the
five random samples of 24 individuals and from 0.30 to
0.32 for the five random samples of 12 individuals. The
unbiased Nei's index of the G-24 and G-12 cores was
respectively 0.28 and 0.33.
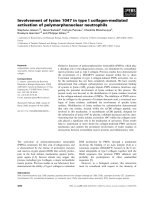
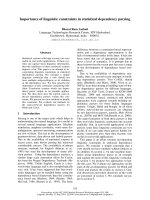
Redundancy curves obtained using MSTRAT softwareFigure 1
Redundancy curves obtained using MSTRAT software. Redundancy curves with standard deviation obtained using
MSTRAT software (five independent samplings). Determination of the optimal size allowed the capture of all alleles of the orig-
inal sample. A. For the 271 alleles of the restricted Vassal collection using the M-method (blue dot) and random sampling
method (pink dot). B. For the 326 alleles of the Vassal collection using the G-48 core as core using the M-method (blue dot)
and random sampling method (pink dot).
0
50
100
150
200
250
271
185
48 individuals
2262 individuals
A.
277
287
297
307
317
326
278
92 individuals
2262 individuals
B.
Table 3: Gain obtained using the M-method at each step of the construction of the nested core collection versus random sampling.
Original collection Sample size M-method
(mean number of alleles for 5 runs)
Random sampling
(mean number of alleles for 5 runs)
Gain using
M-method
Vassal with G-48 used as core 92 individuals 326 278.2 (+/- 1.3) 15%
Restricted Vassal collection
(without rare alleles freq < 0.05%)
48 individuals 269.8 (+/- 1.6) 185.2 (+/- 5.7) 31%
G-48 (without rare alleles freq < 0.05%) 24 individuals 238.2 (+/- 0.4) 218.8 (+/- 6.5) 8%
G-24 (without rare alleles freq < 0.05%) 12 individuals 190.8 (+/- 0.4) 177.8 (+/- 1.6) 6%
BMC Plant Biology 2008, 8:31 />Page 7 of 12
(page number not for citation purposes)
Estimating the unlinked diversity within the whole Vassal
collection (2262 cultivars) would have been very fastidi-
ous. Consequently we compared the capture of unlinked
diversity in the nested core collections and in the M-core
developed only on morphological traits. The total
number of SNPs in the M-core (25 SNPs; Table 5) was
smaller than in any of the nested G-core samples, even the
G-12 core (32 SNPs; Table 5). Moreover, none of the SNPs
observed in the M-core was new compared to those found
in the nested core collections.
Discussion
In the present work, we developed a set of nested core col-
lections from the cultivated compartment of the Vassal
collection, using the M-method and SSR diversity data
obtained on 2262 unique genotypes. However, in this
way we did not take into account the somatic variants
present within V. vinifera L. cultivated germplasm. The
usefulness of core collections is due to their ability to cap-
ture the diversity of the whole species. Even the smallest
nested core collections were more efficient in capturing
allelic diversity than the M-core with its 141 accessions.
Table 4: Distribution of the geographical origin and the final use of the cultivars in the different samples
Region or
Final uses
Western Europe
and North Africa
Center of
domestication
Asia and
central Asia
Other area Wine cultivars Table cultivars Wine and table
cultivars
Vassal collection 56% 3% 1.6% 39.4% 55% 36% 9%
M-core 58% 7.2% 0.9% 33.9% 63% 30% 7%
G-12 core 33% 33% 8% 26% 67% 33% 0%
G-24 core 33% 33% 12.5% 21.5% 58.5% 37.5% 4%
G-48 core 37.5% 23% 6.25% 33.25% 56% 31% 12.5%
G-92 core 42% 25% 6% 27% 56% 32% 12%
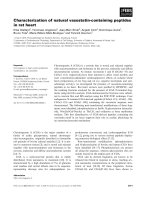
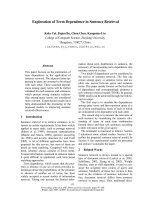
Probable geographic origin of the varieties contained in the nested genetic core collectionsFigure 2
Probable geographic origin of the varieties contained in the nested genetic core collections. Each triangle corre-
sponds to one variety, red triangles correspond to the first sub-sample of the nested genetic core collection (G-12), yellow tri-
angles to the second sub-sample (G-24), black triangles to the third sub-sample (G-48) and green triangles to the fourth sub-
sample (G-92). Ten varieties belonging to the Core G-92 did not have a precise geographical origin and are not shown on this
map.
ChinaChina
BMC Plant Biology 2008, 8:31 />Page 8 of 12
(page number not for citation purposes)
The Vassal collection, which formed the basis of this work,
includes around 3900 cultivars which correspond to 2262
unique SSR genotypes from 38 countries, including from
the main domestication area. This represents more than
half the varieties found world wide [27]. A core collection
developed from Vassal collection is thus of major interest
for the scientific community, and thanks to the vegetative
propagation ability of grape, could be easily multiplied
and distributed.
Construction of the core collections
The first result of our work is the fact that only a small
number of cultivars (92 individuals, 4% of the Vassal col-
lection) are needed to represent the whole diversity and
an even smaller number of cultivars are needed to capture
all the most frequent alleles (48 individuals, 2.1%). The
comparison with other models is not easy, as they have
different biological characteristics, the original collection
did not reach the same global diversity of the species, and
the analyses are seldom performed in the same way. Nev-
ertheless, the core collections developed for A. thaliana
(18%) or M. truncatula (31%) using the same method
required higher percentages of individuals selected to rep-
resent all the genetic diversity [21,22]. In our study we
only considered the cultivated compartment which tends
to be less diverse than wild compartments [31]. But the
high level of heterozygosity of the grapevine is probably
also one of the factors that allow a lower number of indi-
viduals than homozygous species like the two plant spe-
cies mentioned above. Finally, the small number of
individuals needed to represent the genetic diversity of the
cultivated grapevine also pinpointed the high redundancy
of the Vassal collection where many kingroups were high-
lighted and the interest in using such core collections to
optimize the study of the phenotypic and genetic diversity
in grapevine [32,33].
Nested core collections are of great interest for identifying
the sequence diversity that exists in the cultivated
compartment of the V. vinifera species
The total genetic diversity revealed in the sequences of
three gene fragments (2010 bp) in the G-92 core was quite
high with 41 SNPs, i.e. one SNP for every 49 nucleotides.
This is substantially higher than the level of genetic diver-
sity observed in the M-core on the same gene set. Moreo-
ver, it is higher that the level of genetic diversity observed
on an other set of 25 gene fragments totalling 12 kilobases
sequenced on seven cultivated individuals (one SNP for
every 118 nucleotides) by Salmaso et al. and on a set of
230 gene fragments, what represents the analysis of over 1
Mb of grape DNA sequence 11 grape genotypes (one SNP
for every 64 nucleotides) by Lijavetzky et al. [34,35]. This
comparison thus emphasises the interest of such a core
collection for the discovery of genetic diversity.
Among cultivated species, polymorphism in grape is rela-
tively high compared to Zea mays (one SNP every 100
nucleotides), Pinus pinaster (one SNP for every 102 nucle-
otides) and Hordeum vulgare (one SNP for every 78 nucle-
otides), while it is relatively low compared to wild species
such as A. thaliana (one SNP for every 32 nucleotides)
[21,36-38].
G-48 core is highly diverse and non-redundant
The G-92 core was built taking into account extremely rare
alleles. Considering the rapid evolution of SSR markers,
we assumed that the alleles present in two cultivars or less
in the collection did not adequately represent gene diver-
sity and they were thus removed when we built the G-48
core [39-41]. Indeed, only one additional SNP was
revealed in the G-92 sample (present in two cultivars and
not in the M-core) compared to the G-48, thus validating
our assumption. On one hand, the gain in the unlinked
diversity was high in the G-48, probably due to the
decrease in redundancy compared to the Vassal collection
(revealed by the number of kingroups). On the other
hand, when compared to a random sampling, the gain
was much higher using the M-method. The final G-48
core is highly non-redundant and highly diverse. Moreo-
ver the G-48 core optimized the unlinked diversity in the
three different regions sequenced compared to the M-
core, whose individuals coming from Vassal collection
were not selected based on their genotypes, by consequent
they could be consider as a less optimized sampling
within the Vassal collection.
Table 5: Number of polymorphic bases (SNP or insertion deletions found in the DNA fragments)
Core collection studied
Gene Total size
(exon size/intron size)
G-12 G-24 G-48 G-92 M core Total number
in exon
Total number
in intron
Total
number
DFR (gi 499017) 810 nt (380 nt/430 nt) 10 11 14 14 7 3 11 14
L-DOX (gi 22010674) 500 nt (459 nt/41 nt) 9 10 11 12 8 12 0 12
BURP (gi 22014825) 700 nt (700 nt/0 nt) 13 15 15 15 10 15 0 15
Total 2010 nt (1539 nt/471 nt) 32 36 40 41 25 30 11 41
BMC Plant Biology 2008, 8:31 />Page 9 of 12
(page number not for citation purposes)
The G-12 and G-24 cores already include respectively 78%
and 88% of the SNPs markers present in the G-92 core
(80% and 90% of the G-48 core). They also include 58%
and 73% of all the SSRs markers identified within the Vas-
sal collection, representing a gain of 6% to 8% compared
to random sampling from the G-48 or G-24 core. From a
technical point of view, the size of the G-12 and G-24
cores is better suited for high throughput genomic studies
and consequently highly suitable for ambitious projects
of SNP discovery.
Geographic origin and final uses of the varieties within the
G-core
Interestingly the nested core collections constructed in the
present work reflect the distribution of grapes in Europe
and around the Mediterranean Sea but with over-repre-
sentation of the cultivars originating from the Caspian
region and Middle East, and under-representation of the
cultivars from Western Europe (Iberian peninsula, France
and Italy) compared to the Vassal collection. We com-
pared the SSR allele frequencies of the nested core collec-
tions and of the Vassal collection and found low
correlations. This result further emphasizes the decrease
in redundancy in the core collections compared with the
Vassal collection, but also reflected the relative high
number of cultivars originating from Western Europe in
the Vassal collection, whereas the main domestication
center is the Middle East [30]. These two regions may thus
represent important sources of genetic diversity for the V.
vinifera L. species. They represent the cradle of viticulture
and the first migration of cultivars by Greeks and Etrus-
cans, and a second domestication center in Western Med-
iterranean region [42]. Finally, despite their low
representation in the Vassal collection, the presence of
cultivars from Asia and Central Asia in the nested core col-
lections could also indicate an underexploited center of
diversification worthy of prospection and analysis.
The proportion of table varieties, wine varieties and table/
wine varieties was very well conserved in the nested core
collections compared to the M-core and to the Vassal col-
lection. The distinction between these three categories of
cultivars is based on morphological traits such as berry
size, bunch size and compacity but also on other traits
such as the sugar/acid balance at maturity [43]. Previous
studies have shown that there is strong genetic differenti-
ation between these three groups of varieties that may be
due either to divergent selection based on the same gene
pool or to the use of specific gene pools for the develop-
ment of the three types of varieties [44,27].
As a consequence, if the samples are well suited for analy-
sis of allelic diversity, other uses can also be proposed for
the cores, for example, the nested core collection could
help understand the evolution of grape. Both G-12 and G-
24 cores contained more frequent alleles representing
ancient alleles while G-48 and G-92 may constitute subse-
quent diversification of cultivars in recent periods.
Conclusion
In the present work, we developed a set of robust nested
core collections of V. vinifera L. (cultivated compartment)
that will facilitate the discovery of allelic diversity by the
scientific community. Moreover, this is an important
basic tool for the development of projects of association
mapping in grapevine. In conclusion, even if these nested
core collections are statistically too small to study correla-
tions between phenotype and nucleotide diversity, their
use for preliminary tests of hypothesis will speed up the
selection of suitable candidates (for example by discard-
ing unsuitable candidates) and for SNP discovery. Due to
the perennial nature of grape and the ease of vegetative
propagation, these nested core collections could easily be
disseminated worldwide for analyses (by simple request
at ).
Methods
Plant material and DNA extraction
For each genotype of the four nested core collections, an
accession of the Vassal collection (Domain de Vassal, Her-
ault, France) was selected (Table 1) and a batch of young
leaves was collected and lyophilized for long-term conser-
vation. Lyophilized leaves were ground twice for 1 min at
20 Hz using a Qiagen-Retsch MM300 crusher. DNA was
extracted using the Qiagen DNeasy Plant mini kit (Qia-
gen) following the manufacturer's instructions with
minor modifications: addition of 1% w/v of PVP-40 to the
AP1 solution, addition of 180 µl AP2 instead of 130 µl
and an additional step of 10 minutes centrifugation at
6000 rpm after incubation on ice, which enabled the
majority of the cellular remains and aggregates formed
after the addition of AP2 to be pelleted.
Methods for the construction of the core collection
The dataset obtained by Laucou et al. (in prep) on the
2262 unique genotypes from the Vassal collection was
used. The M-method proposed by Schoen and Brown and
implemented in the MSTRAT software by Gouesnard at al.
was used to generate the nested genetic core collections
that maximize the number of observed alleles in the SSR
data set [19,20]. The efficiency of the sampling strategy
was assessed by comparing the total number of alleles
captured using MSTRAT in samples of increasing size with
the number of alleles captured in randomly chosen collec-
tions of the same size (five independent samplings). After
having determined the optimal size of the nested core col-
lections, 200 core collections were generated independ-
ently for each sample size. Putative core collections
exhibiting the same allelic richness (determined by the
BMC Plant Biology 2008, 8:31 />Page 10 of 12
(page number not for citation purposes)
total number of alleles represented) were ranked using
Nei's index as the second criterion [45].
PCR primer design
The gene sequences that were analysed were derived from
three genes located on three separate chromosomes
(Table 6). Two were involved in the anthocyanin meta-
bolic pathway: the dihydroflavonol 4-reductase (DFR, gi
499017) present in one copy in the genome of V. vinifera
L. and the leucoanthocyanidin dioxygenase (L-DOX gi
22010674) present at least in three copies in the genome
of V. vinifera L. based on the NCBI database. The third
gene codes for a BURP domain protein presenting a differ-
ential expression in a natural mutant of berry develop-
ment compared to the wild type (VvBURP1; gi 22014825)
[46-48]. Specific PCR primers (Table 2) were designed for
the amplification of fragments of these three genes using
Primer3 software and tested for amplification on the
genomic DNA of the 12 individuals of the core G-12 [49].
PCR amplification, sequencing, sequence analysis and SNP
detection
The 25 µl PCR reaction mixtures contained 20 ng of
genomic DNA, 50 mM KCl, 10 mM TRIS-HCl (pH 8.3),
0.4 mM of each primer, 125 µM of each dNTP, 1.5 mM
MgCl2 and 2.5 U of Taq polymerase (Qiagen). PCR
amplifications were performed in a MJ Research PTC 100
Thermal Cycler programmed as follows: 5 min denatura-
tion at 94°C, 35 cycles of 94°C for 30 s, 52°C for 45 s, and
72°C for 1 min, followed by an extension step at 72°C for
8 min. The PCR products were purified using the Agen-
court AMPure method (Beckman Coulter) and directly
sequenced in the two ways using the Big Dye Sequencing
kit according to the manufacturer's specifications
(Applied Biosystems Inc.). The sequence products were
purified using the Agencourt CleanSEQ method (Beck-
man Coulter) and loaded onto an ABI PRISM
®
3130 XL
(Applera) capillary sequencer. The DNA sequences were
analysed using the Staden Package [50]. Heterozygous
SNPs were identified as double pics on the chromato-
grams and coded according to international codes (nucle-
otide codes of the International Union of Biochemistry).
Insertion/Deletions were easily identified by overlapping
sequences. Sequencing both strands enable to deal with
such events. Only SNPs present on both forward and
reverse sequences were validated.
Statistical analysis
Different indices were used in this study. The selection of
reference core collections among those constructed using
MSTRAT and exhibiting the same allelic richness (deter-
mined by the total number of alleles represented) was per-
formed using Nei's index (Nei, 1987) as the second
criterion. Nei's index is given for one locus by: I
Neij
= 1-
∑p
ij
2
where pij represents the i allele frequency of the j
locus. The Nei diversity index for all the loci is the sum of
indices for each locus given by I
Nei
= ∑
j
I
Neij
2
. The more the
allelic frequencies are equilibrated within a sample, the
higher the value of Nei's index
As the samples compared were of different size (M-core,
nested core collections and the whole collection) the com-
parison was performed using the unbiased observed het-
erozygosity and the unbiased Nei's index [45]. The
unbiased Nei's index for the locus j is given by: H
Neij
= (2n/
2n-1) (1-∑p
ij
2
) where n represents the number of individ-
uals and where pij represents the i allele frequency of the
j locus, the unbiased Nei diversity index for all the loci
studied is given by H
Nei
= (1/C) ∑
j
H
Neij
2
where C is the
number of loci studied. The more the allelic frequencies
are equilibrated within a sample, the higher the value of
the unbiased Nei's index. The observed heterozygosity for
the j locus is given by H
obsj
= 1-∑x
ij
2
where x
ij
represents the
homozygote frequency for i allele of the j locus. The unbi-
ased observed heterozygosity for the j locus is: H
unobsj
=
(2n/2n-1) (1-∑x
ij
2
) >where n represents the number of
individuals and the unbiased observed heterozygosity for
all loci studied is H
unobs
= (1/C) ∑
j
H
unobsj
2
where C is the
number of loci studied.
We compared the SSR frequencies found in the M-core
and the nested G core-collections with those of the Vassal
collection using the R
2
correlation coefficient. R
2
is given
by R
2
= (Cov
ij
/
σ
i
σ
j)
2
where Covij is the covariance between
the two samples compared and
σ
i and
σ
j are the variance
of samples i and j respectively.
Table 6: Localisation of the genes chosen for partial re-sequencing, specific PCR primers used and size of the gene fragment re-
sequenced
DNA fragment (GenbanK) LG located Size Primer forward (5'→3' sequence) Primer reverse (5'→3' sequence)
DFR (X75964) 18 810 nt CAAGCTGCATGGAAGTATGC TTGGGCCATTCCGTTTTATTA
L-DOX (BQ795708
) 8 500 nt TTGAGCCCAATCATATTAGTTCC GTGGCATGACCATTCTCCTC
BURP (BQ799859
) 3 700 nt CGAAAAGGGACACACAGAG GTTCAGAGTAGGCCTCGGAA
Total 2010 nt
BMC Plant Biology 2008, 8:31 />Page 11 of 12
(page number not for citation purposes)
Authors' contributions
LLC carried out the sequence, participated in the sequence
alignment, performed the statistical analysis and drafted
the manuscript. AF-L carried out the sequence and partic-
ipated in the sequence alignment. VL carried out the SSR
analysis. SV carried out the sequence. TL participated in
the design of the study and performed the ampelographic
analysis. A-FA participated in the design and coordination
of the study and helped to draft the manuscript. J-MB par-
ticipated in the design of the study and performed the
ampelographic analysis. PT conceived of the study, partic-
ipated in the design and coordination of the study and
helped to draft the manuscript. All authors read and
approved the final manuscript
Acknowledgements
This project (Trilateral project TRI017 CoreGrapeGen) was funded by
Genoplante, the French Ministry of Research, the INRA Genetic and Breed-
ing Department, and the region of Languedoc-Roussillon. We thank D.
Vares and the technical staff of the Vassal domain for plant management and
also A. Doligez and T. Bataillon for critical reading of the manuscript. We
acknowledge Daphne Goodfellow for improving the English.
References
1. Roses AD: A model for susceptibility polymorphisms for com-
plex diseases: apolipoprotein E and Alzheimer disease. Neu-
rogenetics 1997, 1:3-11.
2. Hugot JP, Chamaillard M, Zouali H, Lesage S, Cezard JP, Belaiche J,
Almer S, Tysk C, O'Morain CA, Gassull M, Binder V, Finkel Y, Cortot
A, Modigliani R, Laurent-Puig P, Gower-Rousseau C, Macry J,
Colombel JF, Sahbatou M, Thomas G: Association of NOD2 leu-
cine-rich repeat variants with susceptibility to Crohn's dis-
ease. Nature 2001, 411(6837):599-603.
3. Ogura Y, Bonen DK, Inohara N, Nicolae DL, Chen FF, Ramos R, Brit-
ton H, Moran T, Karaliuskas R, Duerr RH, Achkar JP, Brant SR, Bay-
less TM, Kirschner BS, Hanauer SB, Nunez G, Cho JH: A frameshift
mutation in NOD2 associated with susceptibility to Crohn's
disease. Nature 2001, 411(6837):603-6.
4. Maloof JN, Borevitz JO, Dabi T, Lutes J, Nehring RB, Redfern JL,
Trainer GT, Wilson JM, Asami T, Berry CC, Weigel D, Chory J: Nat-
ural variation in light sensitivity of Arabidopsis. Nat Genet
2001, 29(4):441-6.
5. Thornsberry JM, Goodman MM, Doebley J, Kresovich S, Nielsen D,
Buckler ES: Dwarf8 polymorphisms associate with variation in
flowering time. Nat Genet 2001, 28:286-289.
6. Szalma SJ, Buckler ES, Snook ME, McMullen MD: Association anal-
ysis of candidate genes for maysin and chlorogenic acid accu-
mulation in maize silks. Theor Appl Genet 2005, 110:1324-1333.
7. The international HapMap Project. Nature 2003, 426:789-796.
8. International Chicken Polymorphism Map Consortium: A genetic
variation map for chicken with 2.8 million single-nucleotide
polymorphisms. Nature 2004, 432:717-22.
9. Glinsky GV: Integration of HapMap-based SNP pattern analy-
sis and gene expression profiling reveals common SNP pro-
files for cancer therapy outcome predictor genes. Cell Cycle
2006, 5(22):2613-25.
10. Pal P, Xi H, Sun G, Kaushal R, Meeks JJ, Thaxton CS, Guha S, Jin CH,
Suarez BK, Catalona WJ, Deka R: Tagging SNPs in the kallikrein
genes 3 and 2 on 19q13 and their associations with prostate
cancer in men of European origin. Hum Genet 2007, 122((3–
4)):251-9.
11. Jaillon O, Aury JM, Noel B, Policriti A, Clepet C, Casagrande A,
Choisne N, Aubourg S, Vitulo N, Jubin C, Vezzi A, Legeai F, Hugueney
P, Dasilva C, Horner D, Mica E, Jublot D, Poulain J, Bruyère C, Billault
A, Segurens B, Gouyvenoux M, Ugarte E, Cattonaro F, Anthouard V,
Vico V, Del Fabbro C, Alaux M, Di Gaspero G, Dumas V, Felice N,
Paillard S, Juman I, Moroldo M, Scalabrin S, Canaguier A, Le Clainche
I, Malacrida G, Durand E, Pesole G, Laucou V, Chatelet P, Merdinoglu
D, Delledonne M, Pezzotti M, Lecharny A, Scarpelli C, Artiguenave F,
Pè ME, Valle G, Morgante M, Caboche M, Adam-Blondon AF, Weis-
senbach J, Quétier F, Wincker P, French-Italian Public Consortium for
Grapevine Genome Characterization: The grapevine genome
sequence suggests ancestral hexaploidization in major
angiosperm phyla. Nature 2007, 449(7161):463-7.
12. Frankel OH, Brown AHD: Plant genetic resources today: a crit-
ical appraisal. In Crop Genetic Resources: Conservation and Evaluation
Edited by: Holden JHW, Williams JT. London Georges Allen & Unwin
Ltd; 1984:249-257.
13. Zhang H, Sun J, Wang M, Liao D, Zeng Y, Shen S, Yu P, Mu P, Wang
X, Li Z: Genetic structure and phylogeography of rice lan-
draces in Yunnan, China, revealed by SSR. Genome 2007,
50(1):72-83.
14. Hao CY, Zhang XY, Wang LF, Dong YS, Shang XW, Jia JZ: Genetic
diversity and core collection evaluations in common wheat
germplasm from the Northwestern Spring Wheat Region in
China. Molecular Breeding 2006, 17:69-77.
15. Ghislain M, Andrade D, Rodríguez F, Hijmans RJ, Spooner DM:
Genetic analysis of the cultivated potato Solanum tubero-
sum L. Phureja Group using RAPDs and nuclear SSRs. Theor
Appl Genet 2006, 113(8):1515-27.
16. Lebot V, Malapa R, Molisale T, Marchand JL: Physico-chemical
characterisation of yam (Dioscorea alata L.) tubers from
Vanuatu. Genet Resour Crop Evol 2005, 53:1199-1208.
17. Wang JC, Hu J, Liu NN, Xu HM, Zhang S: Investigation of Com-
bining Plant Genotypic Values and Molecular Marker Infor-
mation for Constructing Core Subsets. J Int Plant Biol 2006,
48(11):1371-1378.
18. Jansen J, van Hintum T: Genetic distance sampling: a novel sam-
pling method for obtaining core collections using genetic dis-
tances with an application to cultivated lettuce. Theor Appl
Genet 2007, 114:421-428.
19. Schoen DJ, Brown AHD: Conservation of allelic richness in wild
crop relatives is aided by assessment of genetic markers. Proc
Natl Acad Sci 1993, 90:10623-10627.
20. Gouesnard B, Bataillon TM, Decoux G, Rozale C, Schoen DJ, David
JL: MSTRAT: an algorithm for building germplasm core col-
lections by maximizing allelic or phenotypic richness. J Hered
2001, 92:93-4.
21. McKhann HI, Camilleri C, Berard A, Bataillon T, David JL, Reboud X,
Le Corre V, Caloustian C, Gut IG, Brunel D: Nested core collec-
tions maximizing genetic diversity in Arabidopsis thaliana.
Plant J 2004, 38(1):193-202.
22. Ellwood SR, D'Souza NK, Kamphuis LG, Burgess TI, Nair RM, Oliver
RP: SSR analysis of the Medicago truncatula SARDI core col-
lection reveals substantial diversity and unusual genotype
dispersal throughout the Mediterranean basin. Theor Appl
Genet 2006, 112(5):977-83.
23. Ronfort J, Bataillon T, Santoni S, Delalande M, David JL, Prosperi JM:
Microsatellite diversity and broad scale geographic structure
in a model legume: building a set of nested core collection
for studying naturally occurring variation in Medicago trun-
catula. BMC Plant Biol 2006, 13:6-28.
24. Whitt SR, Buckler ES: Using natural allelic diversity to evaluate
gene function. In Methods in Molecular Biology, Plant Functional
Genomics: Methods and Protocols Volume 236. Edited by: Grotewald E.
Totowa, NJ: Humana Press Inc; 2003:123-139.
25. Bioversity International [
]
26. Domaine de Vassal [ />]
27. This P, Lacombe T, Thomas MR: Historical origins and genetic
diversity of wine grapes. Trends Genet 2006, 22(9):511-9.
28. Barnaud A, Lacombe T, Doligez A: Linkage disequilibrium in cul-
tivated grapevine, Vitis vinifera L. Theor Appl Genet 2006,
112(4):708-716.
29. This P, Lacombe T, Cadle-Davidson M, Owens CL: Wine grape
(Vitis vinifera L.) color associates with allelic variation in the
domestication gene VvmybA1. Theor Appl Genet 2007,
114(4):723-730.
30. Mc Govern PE: Ancient Wine: the search for the origins of viniculture Prin-
ceton: Princeton University Press; 2003.
31. Bartsch D, Lehnen M, Clegg J, Pohl-Orf M, Schuphan II, Ellstrand NC:
Impact of gene flow from cultivated beet on genetic diversity
of wild sea beet populations. Mol Eco 1999, 8(10):1733-41.
32. Bowers J, Boursiquot JM, This P, Chu K, Johansson H, Meredith C:
Historical Genetics: The Parentage of Chardonnay, Gamay,
Publish with BioMed Central and every
scientist can read your work free of charge
"BioMed Central will be the most significant development for
disseminating the results of biomedical research in our lifetime."
Sir Paul Nurse, Cancer Research UK
Your research papers will be:
available free of charge to the entire biomedical community
peer reviewed and published immediately upon acceptance
cited in PubMed and archived on PubMed Central
yours — you keep the copyright
Submit your manuscript here:
/>BioMedcentral
BMC Plant Biology 2008, 8:31 />Page 12 of 12
(page number not for citation purposes)
and Other Wine Grapes of Northeastern France. Science
1999, 285(5433):1562-1565.
33. Staraz DM, Bandinelli R, Boselli M, This P, Boursiquot JM, Laucou V,
Lacombe T, Varès D: Genetic Structuring and Parentage Anal-
ysis for Evolutionary Studies in Grapevine: Kin Group and
Origin of the Cultivar Sangiovese Revealed. J Am Soc Hortic Sci
2007, 132:514-524.
34. Salmaso M, Faes G, Segala C, Stefanini M, Salakhutdinov I, Zyprian E,
Toepfer R, Stella Grando M, Velasco R: Genome diversity and
gene haplotypes in the grapevine (Vitis vinifera L.) as revealed
by single nucleotide polymorphisms. Molecular Breeding 2004,
14:385-395.
35. Lijavetzky D, Cabezas JA, Ibáñez A, Rodríguez V, Martínez-Zapater
JM: High throughput SNP discovery and genotyping in grape-
vine (Vitis vinifera L.) by combining a re-sequencing approach
and SNPlex technology. BMC Genomics 2007, 8:424-434.
36. Ching A, Caldwell KS, Jung M, Dolan M, Smith OS, Tingey S, Morgante
M, Rafalski AJ: SNP frequency, haplotype structure and linkage
disequilibrium in elite maize inbred lines. BMC Genet 2002,
7:3-19.
37. Dantec LL, Chagné D, Pot D, Cantin O, Garnier-Géré P, Bedon F,
Frigerio JM, Chaumeil P, Léger P, Garcia V, Laigret F, De Daruvar A,
Plomion C: Automated SNP detection in expressed sequence
tags: statistical considerations and application to maritime
pine sequences. Plant Mol Biol 2004, 54(3):461-70.
38. Russell J, Booth A, Fuller J, Harrower B, Hedley P, Machray G, Powell
W: A comparison of sequence-based polymorphism and hap-
lotype content in transcribed and anonymous regions of the
barley genome. Genome 2004, 47(2):389-98.
39. Thuillet AC, Bru D, David J, Roumet P, Santoni S, Sourdille P, Bataillon
T: Direct estimation of mutation rate for 10 microsatellite
loci in durum wheat, Triticum turgidum (L.) Thell. ssp
durum desf. Mol Biol Evol 2002, 19(1):122-5.
40. Donnelly P: The coalescent and microsatellite variability. In
Microsatellites – evolution and applications Edited by: Goldstein DB,
Schlötterer C. Oxford: Oxford University Press; 1999:116-128.
41. Valdes AM, Slatkin M, Freiner NB: Allele frequencies at micros-
atellite loci: the stepwise mutation model revisited. Genetics
1993, 133:737-749.
42. Arroyo-García R, Ruiz-García L, Bolling L, Ocete R, López MA,
Arnold C, Ergul A, Söylemezoğlu G, Uzun HI, Cabello F, Ibáñez J,
Aradhya MK, Atanassov A, Atanassov I, Balint S, Cenis JL, Costantini
L, Goris-Lavets S, Grando MS, Klein BY, McGovern PE, Merdinoglu D,
Pejic I, Pelsy F, Primikirios N, Risovannaya V, Roubelakis-Angelakis
KA, Snoussi H, Sotiri P, Tamhankar S, This P, Troshin L, Malpica JM,
Lefort F, Martinez-Zapater JM: Multiple origins of cultivated
grapevine (Vitis vinifera L. ssp. sativa) based on chloroplast
DNA polymorphisms. Mol Eco 2006, 15(12):3707-14.
43. Boursiquot JM, Dessup M, Rennes C: Distribution of the Main
Phenological, Agronomical and Technological Characters of
Vitis-Vinifera L. Vitis 1995, 34(1):31-35.
44. Aradhya MK, Dangl GS, Prins BH, Boursiquot JM, Walker MA,
Meredith CP, Simon CJ: Genetic structure and differentiation in
cultivated grape, Vitis vinifera L. Genet Res 2003, 81(3):179-92.
45. Nei M: Molecular Evolutionary Genetics New York: Columbia University
Press; 1987.
46. Boss PK, Davies C, Robinson SP: Expression of anthocyanin bio-
synthesis pathway in red and white grapes. Plant Mol Biol 1996,
32:565-569.
47. Gollop R, Even S, Colova-Tsolova V, Perl A: Expression of the
grape dihydroflavonol reductase gene and analysis of its pro-
moter region. Journ Exp Bot 2002, 373(53):1397-1409.
48. Fernandez L, Torregrosa L, Terrier N, Sreekantan L, Grimplet J, Dav-
ies C, Thomas MR, Romieu C, Ageorges A: Identification of genes
associated with flesh morphogenesis during grapevine fruit
development. Plant Mol Biol 2007, 63(3):307-23.
49. Rozen S, Skaletsky H: Primer3 on the WWW for general users
and for biologist programmers. Methods Mol Biol 2000,
132:365-86.
50. Bonfield JK, Smith KF, Staden RA: new DNA sequence assembly
program. Nucleic Acids Research 1995, 23:4992-4999.