báo cáo khoa học: " Gene expression analyses in maize inbreds and hybrids with varying levels of heterosis" ppt
Bạn đang xem bản rút gọn của tài liệu. Xem và tải ngay bản đầy đủ của tài liệu tại đây (779.54 KB, 19 trang )
BioMed Central
Page 1 of 19
(page number not for citation purposes)
BMC Plant Biology
Open Access
Research article
Gene expression analyses in maize inbreds and hybrids with varying
levels of heterosis
Robert M Stupar
1,3
, Jack M Gardiner
2
, Aaron G Oldre
1
, William J Haun
1
,
Vicki L Chandler
2
and Nathan M Springer*
1
Address:
1
Center for Plant and Microbial Genomics, Department of Plant Biology, University of Minnesota, Saint Paul MN 55108, USA,
2
Department of Plant Science, and BIO5 Institute, University of Arizona, Tucson, AZ 85721, USA and
3
Department of Agronomy and Plant
Genetics, University of Minnesota, Saint Paul MN 55108, USA
Email: Robert M Stupar - ; Jack M Gardiner - ; Aaron G Oldre - ;
William J Haun - ; Vicki L Chandler - ; Nathan M Springer* -
* Corresponding author
Abstract
Background: Heterosis is the superior performance of F
1
hybrid progeny relative to the parental
phenotypes. Maize exhibits heterosis for a wide range of traits, however the magnitude of heterosis
is highly variable depending on the choice of parents and the trait(s) measured. We have used
expression profiling to determine whether the level, or types, of non-additive gene expression vary
in maize hybrids with different levels of genetic diversity or heterosis.
Results: We observed that the distributions of better parent heterosis among a series of 25 maize
hybrids generally do not exhibit significant correlations between different traits. Expression
profiling analyses for six of these hybrids, chosen to represent diversity in genotypes and heterosis
responses, revealed a correlation between genetic diversity and transcriptional variation. The
majority of differentially expressed genes in each of the six different hybrids exhibited additive
expression patterns, and ~25% exhibited statistically significant non-additive expression profiles.
Among the non-additive profiles, ~80% exhibited hybrid expression levels between the parental
levels, ~20% exhibited hybrid expression levels at the parental levels and ~1% exhibited hybrid
levels outside the parental range.
Conclusion: We have found that maize inbred genetic diversity is correlated with transcriptional
variation. However, sampling of seedling tissues indicated that the frequencies of additive and non-
additive expression patterns are very similar across a range of hybrid lines. These findings suggest
that heterosis is probably not a consequence of higher levels of additive or non-additive expression,
but may be related to transcriptional variation between parents. The lack of correlation between
better parent heterosis levels for different traits suggests that transcriptional diversity at specific
sets of genes may influence heterosis for different traits.
Background
Heterosis is the phenomenon in which F
1
hybrids exhibit
phenotypes that are superior to their parents [1,2]. Plant
breeders have utilized heterosis for the development of
superior yielding varieties in many important crop species
without fully understanding the molecular basis of heter-
Published: 10 April 2008
BMC Plant Biology 2008, 8:33 doi:10.1186/1471-2229-8-33
Received: 3 January 2008
Accepted: 10 April 2008
This article is available from: />© 2008 Stupar et al; licensee BioMed Central Ltd.
This is an Open Access article distributed under the terms of the Creative Commons Attribution License ( />),
which permits unrestricted use, distribution, and reproduction in any medium, provided the original work is properly cited.
BMC Plant Biology 2008, 8:33 />Page 2 of 19
(page number not for citation purposes)
osis. Researchers frequently discuss the magnitude of yield
heterosis for a particular hybrid. In maize, the different
inbred lines have been divided into "heterotic groups"
based upon the level of grain yield heterosis [3]. Gener-
ally, crosses within heterotic groups have lower grain yield
heterosis than crosses between groups. However, heterotic
groups are used as a general tool and not as a precise pre-
dictor of heterotic response [4]. There is a correlation
between grain yield heterosis and genetic diversity such
that increasing genetic diversity produces increasing level
of grain yield heterosis [5]. However, when the parents
become highly diverse this relationship is no longer
observed [3,6].
Although heterosis in crop plants is most commonly dis-
cussed in terms of yield, numerous other phenotypic traits
also display heterosis. Maize exhibits high levels of heter-
osis for many traits such as root growth, height, ear node,
leaf width, seedling biomass and other traits [7-11].
Within a given hybrid, the amount of heterosis can vary
widely for different traits [9,12].
While it is widely agreed that parental genetic diversity
serves as the basis of heterosis, the specific aspects of
genetic diversity and how these contribute to heterotic
phenotypes remains to be determined. The molecular
mechanism(s) driving heterotic phenotypes remains a
subject of wide interest and debate [12,13]. The availabil-
ity of high-throughput gene expression profiling technol-
ogies has allowed researchers to study the gene expression
profile of hybrid plants relative to the inbred parents
[11,14-21]. In general, most of these studies have focused
on characterizing gene expression patterns in a single het-
erotic hybrid compared to the two parents. Many of these
studies have addressed similar topics regarding gene
expression and heterosis, such as the relative frequencies
of additive and non-additive expression levels in the
hybrid. Additive expression occurs when the hybrid
expression level is equivalent to the mid-parent values
while non-additive expression occurs whenever the
hybrid expression level deviates from the mid-parent level
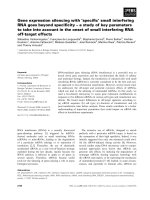
(Figure 1). It is worth noting that non-additive expression
phenotypes can include expression levels between the
mid-parent and parental values, expression levels equiva-
lent to one of the parents or expression levels outside the
parental range. The identity and frequency of genes exhib-
iting hybrid gene expression levels outside of the parental
range have been of particular interest in these studies.
The hybrid expression profiling studies have utilized a
variety of expression profiling platforms, experimental
designs and tissues. Several studies have found that the
majority (~75%) of genes exhibit additive expression in
the hybrid and that only small numbers of the non-addi-
tively expressed genes exhibit expression levels outside the
parental range [11,15,17]. Other studies have found
much higher levels of non-additive expression and
numerous examples of expression outside the parental
range [21-23]. It is unclear whether these differences are
caused by biological differences between tissues, geno-
types, or differences in the expression profiling platforms.
In this study we have investigated the heterosis and gene
expression profiles for a set of maize hybrids with varying
levels of parental genetic diversity. In addition, gene
expression profiling was performed using several different
technologies enabling the assessment of whether hybrids
that generally exhibit lower levels of heterosis exhibit
lower levels of non-additive expression or expression lev-
els outside the parental range.
Results
Different maize hybrids show a range of heterotic
responses that vary among traits
The primary objective of this study was to identify, and
compare levels of, non-additive gene expression in several
maize hybrids with varying levels of heterosis. There is a
substantial amount of prior research on the levels of het-
erosis for grain yield in various maize hybrids. However,
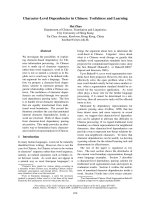
Schematic diagram of potential patterns of hybrid gene expressionFigure 1
Schematic diagram of potential patterns of hybrid
gene expression. This hypothetical gene exhibits higher
expression in parent 2 than in parent 1. Five different poten-
tial patterns of hybrid expression (A-E) are diagrammed. The
hybrid could exhibit (A) below-low parent expression (BLP);
(B) low parent-like expression (LP); (C) mid-parent expres-
sion; (D) high parent-like expression (HP); or (E) above high
parent expression (AHP). Only mid-parent expression is
classified as additive. The BLP, LP-like, HP-like and AHP
expression patterns would all be examples of non-additive
expression.
0
1
2
3
4
5
6
12345678
Expression level
Parent 1 Parent 2
Potential hybrid expression levels
A
B
C
D
E
A
d
d
i
t
i
v
e
N
o
n
-
a
d
d
i
t
i
v
e
N
o
n
-
a
d
d
i
t
i
v
e
Mid-parent
High
Parent-like
Above
High parent
Below
Low Parent
Low
Parent-like
BMC Plant Biology 2008, 8:33 />Page 3 of 19
(page number not for citation purposes)
our expression profiling was performed with seedling tis-
sue and this tissue may not be directly related to grain
yield phenotypes. Therefore, we monitored maize inbreds
and hybrids to assess the levels of b
etter parent heterosis
(BPH) for five different phenotypes, including two differ-
ent seedling phenotypes. BPH is represented as the per-
cent phenotypic increase in the hybrid relative to the
better parent phenotype (see Methods for BPH equation).
Our goal was to identify whether the levels of heterosis for
different hybrid genotypes were correlated among a vari-
ety of traits, thus allowing us to determine which hybrids
exhibit higher or lower "overall" heterosis.
We measured the mature plant height, 50-seed weight,
days to flowering, seedling plant height and seedling bio-
mass BPH levels for a series of hybrids. The inbred lines
B73 or Mo17 were used as paternal parents in all hybrids
studied. The phenotypic values for each replicate of all five
traits are provided in Additional file 1 and the BPH values
are available in Figure 1 and Additional file 2. The relative
BPH levels were quite variable among the different traits
(Figure 2). For example, Oh43 × B73 exhibited the highest
BPH for seed weight, but the fifth lowest BPH for days to
flowering (Figure 2; see Additional file 2). We tested
whether there was a correlation in the level of BPH among
hybrids for any two traits [see Additional file 3]. Seedling
height and seedling biomass exhibited a strong correla-
tion (p < 0.0001) while plant height and days to flowering
exhibited a weaker, but significant, correlation (p =
0.013). The other eight trait comparisons did not show
significant correlations. Thus, in general, the level of BPH
heterosis for one trait is a poor predictor of the level of
heterosis for another trait.
We assessed whether the concept of heterotic groups,
which was developed as a tool to enable breeding for
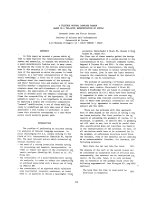
Heterosis for non-yield traitsFigure 2
Heterosis for non-yield traits. The percent BPH is shown for all traits and all hybrids scored in this study. The numerical
BPH values are available in Additional file 2. Red bars represent BPH for hybrids generated between SS and NSS inbreds, blue
bars represent BPH for hybrids generated within SS and NSS inbreds, and grey bars represent BPH for hybrids derived from an
inbred line with mixed origin (F2).
-10%
-5%
0%
5%
Days to flowering
-10%
0%
10%
20%
-15%
0%
15%
30%
-20%
0%
20%
40%
60%
80%
100%
-15%
0%
15%
30%
A
1
8
8
x
B7
3
B
8
4
x
M
o
1
7
H
1
0
0
x
M
o
1
7
B
3
7
x
M
o
1
7
A
1
8
8
x
M
o
1
7
P
a
9
1
x
M
o
1
7
O
h
4
3
x
M
o
1
7
O
h
4
3
x
B
7
3
B
1
4
a
x
M
o
1
7
B
3
7
x
B
7
3
B
7
3
x
M
o
1
7
B
1
4
a
x
B7
3
W
f
9
x
M
o
1
7
W
6
4
a
x
B
7
3
H
9
9
x
M
o
1
7
W
2
2
x
B
7
3
B
7
7
x
B
7
3
M
o
1
7
x
B
7
3
B
7
7
x
M
o
1
7
W
f
9
x
B
7
3
H
9
9
x
B
7
3
B
8
4
x
B
7
3
H
1
0
0
x
B
7
3
F
2
x
B
7
3
F
2
x
M
o
1
7
Plant height
Seed weightSeedling heightSeedling biomass
Percent BPH
N/A N/A N/AN/A
BMC Plant Biology 2008, 8:33 />Page 4 of 19
(page number not for citation purposes)
grain yield [4], would predict heterosis levels for other
traits. The concept of heterotic groups predicts that crosses
within a heterotic group will generally exhibit less hetero-
sis than crosses between heterotic groups. For all five traits
we monitored, there were multiple intra-heterotic group
crosses that exhibited higher levels of heterosis than sev-
eral of the inter-heterotic group hybrids. For example,
while B37 × B73 is an intra-heterotic group cross it dis-
played heterosis levels among traits that were similar to,
and sometimes superior to, inter-heterotic group hybrids
made between more distant parental genotypes (Figure 2,
3). It is worth noting that heterotic groups are not entirely
defined based upon heterosis but are often influenced by
relatedness and other factors [4].
We investigated the correlation between the levels of BPH
and the genetic distance (based on Nei SNP genetic dis-
tances calculated by Hamblin et al. [24]) between the par-
ent lines for each of the five traits. Four out of the five
traits exhibited positive correlation values, however only
seedling biomass was statistically significant (p = 0.013).
The days to flowering phenotype exhibited a non-signifi-
cant negative correlation. The hybrid line with the lowest
parental genetic diversity, B84 × B73, consistently exhib-
ited low levels of relative BPH (Figure 3). However, the
lines with moderate to high levels of parental genetic
diversity did not consistently show a strong correlation
between heterosis levels and genetic distance.
A set of six hybrid genotypes were used for gene expres-
sion profiling. These hybrids represent intra- and inter-
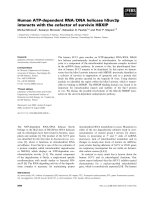
Relationship between parental genetic diversity and hybrid heterosis among traits and hybridsFigure 3
Relationship between parental genetic diversity and hybrid heterosis among traits and hybrids. The percentage
better parent heterosis (BPH) for each hybrid is plotted against the genetic distance between parents. The 25 hybrids were
scored based on percentage BPH for five traits (plant final height, days to flowering, weight of 50 seeds, 11-day height and 11-
day biomass). Traits measured on field-grown plants are shown in (A) and traits measured on greenhouse-grown plants are
shown in (B). Average percent BPH is shown based on two field replicates (A) and three greenhouse replicates (B). Spots rep-
resenting crosses between stiff stalk (SS) and non-stiff stalk (NSS) groups are shown in red, and spots representing crosses
within either group are shown in blue. The Pearson's R correlation value and p-value of the regression are shown for each
trait. The six hybrids that were used for expression profiling are labelled in each of the five plots.
0.20 0.25 0.30 0.35 0.20 0.25 0.30 0.35 0.20 0.25 0.30 0.35
0.20 0.25 0.30 0.35 0.20 0.25 0.30 0.35
30%
20%
10%
0%
-10%
30%
20%
10%
0%
-10%
20%
10%
0%
25%
15%
5%
6%
4%
2%
0%
-2%
20%
0%
-20%
100%
80%
60%
40%
Weight of 50 seedsDays to floweringPlant height
Seedling biomassSeedling height
Nei genetic distance between parents
Percent BPHPercent BPH
Crosses within SS or NSS
Crosses between SS and NSS
A)
B)
B84xB73
B37xB73
Oh43xB73
Oh43xB73
Oh43xB73
Oh43xB73
Oh43xB73
B84xB73
B84xB73
B84xB73
B84xB73
B37xB73
B37xB73
B37xB73
B73xMo17
B73xMo17
B73xMo17
B73xMo17
B73xMo17
Mo17xB73
Mo17xB73
Mo17xB73
Mo17xB73
Mo17xB73
Oh43xMo17
Oh43xMo17
Oh43xMo17
Oh43xMo17
Oh43xMo17
R = 0.214
p = 0.350
R = -0.216
p = 0.346
R = 0.243
p = 0.332
R = 0.324
p = 0.152
R = 0.532
p = 0.013
Nei genetic distance between parents Nei genetic distance between parents
Nei genetic distance between parents Nei genetic distance between parents
BMC Plant Biology 2008, 8:33 />Page 5 of 19
(page number not for citation purposes)
heterotic group crosses with a range of low to high genetic
diversity between the parents and exhibit a substantial
range of BPH phenotypes (the data points for these six
hybrids are labelled in Figure 3). Hybrids B84 × B73 and
B37 × B73 represent crosses made between members of
the Stiff Stalk Synthetic heterotic group and the Oh43 ×
Mo17 hybrid is a cross between non-Stiff Stalk inbred
lines. The other three crosses (Oh43 × B73, B73 × Mo17
and Mo17 × B73) represent hybrids derived by crossing
parents from the two heterotic groups. These hybrids rep-
resent a range of genetic diversity (based on 847 SNPs
measured by Hamblin et al. [24]). The B84-B73 parents
have a relatively low level of genetic diversity while the
B37-B73 parents encompass a moderate level of genetic
diversity. The other hybrids, B73-Mo17, Oh43-B73 and
Oh43-Mo17, all have higher levels of genetic diversity
[24] [see Additional file 2].
Identification of differentially expressed genes
Total RNA was isolated from above ground 11-day seed-
ling tissues for hybrids B84 × B73, B37 × B73, Oh43 ×
B73, Oh43 × Mo17 and their respective inbred parental
lines. RNA samples were collected for three biological rep-
lications and were processed for microarray analyses using
the Affymetrix maize 18 K GeneChip platform. The 18 K
maize Affymetrix array contains 17,622 probe sets that are
designed to detect the expression of 13,495 genes. Some
genes are represented by multiple probes sets designed to
detect sense and anti-sense expression or the expression of
alternative transcripts. Previously obtained Affymetrix
microarray data for 11-day seedlings from genotypes B73,
Mo17, B73 × Mo17 and Mo17 × B73 [17] were included
in downstream analyses for comparative purposes. A com-
parison of the expression profile of the inbred lines, B73
and Mo17, indicated that the profiles obtained in both
experiments are quite comparable.
Genes that were differentially expressed (DE) among gen-
otypes were identified within each inbred-hybrid group,
based on an ANOVA FDR < 0.05 (and minimum signal
and fold-change filters; see Methods). The numbers of DE
genes were variable among the inbred-hybrid groups
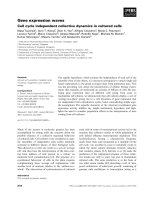
(Table 1). There was a strong correlation between the
number of DE genes and the level of genetic distance
between the parents (Figure 4). The comparison between
inbred B84, inbred B73 and hybrid B84 × B73 identified
290 DE genes, by far the lowest number of any group. The
comparison between inbred B37, inbred B73 and hybrid
B37 × B73 identified 655 DE genes, and the remaining
comparisons generated between 885–1071 DE genes
(Table 1; Figure 4).
The use of microarray expression profiling for intraspecific
comparisons can be complicated by the presence of
sequence polymorphisms within different inbred lines
[25]. We assessed the frequency of false-positive DE genes
in our Affymetrix dataset by validating the microarray data
using two independent methodologies. First, the Seque-
nom MassArray platform was used to validate calls of dif-
ferential expression between different inbred lines. We
had previously used the MassArray platform to measure
allele-specific expression levels for a set of ~300 genes
using the same RNA samples as were used in the Affyme-
trix analyses [26]. The MassArray platform can detect the
relative allelic proportions for a given gene in a mix of
parental RNAs. The relative proportion detected for each
allele can be compared with the proportion predicted
based on the Affymetrix data, as was demonstrated in
Stupar and Springer [17]. Fifty-six genes that were DE in
the Affymetrix data were subjected to MassArray valida-
tion (this includes six genes that were DE in two different
inbred-hybrid groups, resulting in validation assays for 62
DE profiles). The correlation between the Affymetrix and
MassArray data was strong, with 58 of the 62 examples
showing similar directionality of biased expression in
Table 1: Classification of differentially expressed genes based on Affymetrix microarrays
B84 × B73 B37 × B73 Oh43 × B73 Oh43 × Mo17 Mo17 × B73 B73 × Mo17
#DE genes* 326 726 1407 993 1180 1144
# Pass filtration** 290 655 1071 885 1064 1055
#Nonadditive*** 88 (30.3%) 159 (24.3%) 296 (27.6%) 233 (26.3%) 247 (23.2%) 266 (25.2%)
HP or LP**** 5 32 58 47 44 55
AHP***** 0 1 3 1 0 1
BLP****** 0 2 3 1 2 1
*Differentially expressed genes (based on ANOVA FDR < 0.05)
**filters: 1) at least one genotype avg signal > 50; fold-change of at least 1.2 between any two genotypes (parent1-parent2 or parent1-hybrid or
parent2-hybrid comparisons)
***based on two-tailed t-test between midparent and hybrid (p < 0.05)
****based on two-tailed t-tests (p < 0.05); hybrid must be significantly different than midparent and not significantly different from either high or low
parent
*****AHP: above high parent; based on one-tailed t-test between high parent and hybrid (p < 0.05) and d/a > 1
******BLP: below low parent; based on one-tailed t-test between low parent and hybrid (p < 0.05) and d/a < -1
BMC Plant Biology 2008, 8:33 />Page 6 of 19
(page number not for citation purposes)
both platforms (Figure 5A). A statistical analysis indicated
that 74% (46/62) of the genes exhibit significant differen-
tial expression in the MassArray dataset. Second, we uti-
lized a maize 70-mer oligonucleotide microarray platform
[27] to validate the DE genes observed in the Affymetrix
dataset. The same sets of RNA samples were labelled and
hybridized to the 70-mer oligonucleotide microarray con-
taining ~43,000 features. We identified a set of 13,874 fea-
tures on this platform that are expected to detect the same
transcripts as the Affymetrix platform. For all Affymetrix
DE genes that are present on the 70-mer oligonucleotide
microarray we compared the log
2
expression differences
between parental inbred lines on both platforms (Figure
5B). Pearson R values indicated significant correlations (p
< 0.0001) for all of the comparisons (R = 0.697 for B84
versus B73; R = 0.679 for B37 versus B73; R = 0.720 for
Oh43 versus B73; R = 0.750 for Oh43 versus Mo17). The
70-mer oligonucleotide microarray platform confirmed
the directionality of the expression differences between
parental inbred genotypes for the vast majority of the
genes identified by Affymetrix (Figure 5B; ~91% for B84
versus B73; ~84% for B37 versus B73; ~84% for Oh43 ver-
sus B73; ~91% for Oh43 versus Mo17). While there are
some examples in which differential expression is only
detected using one of the platforms, the majority of genes
exhibited similar differential expression in both microar-
ray platforms. Both the Sequenom MassArray and 70-mer
oligonucleotide microarray analyses indicate that the
majority of the DE profiles identified using the Affymetrix
microarrays were valid.
Relationship between parental genetic diversity and differential gene expressionFigure 4
Relationship between parental genetic diversity and differential gene expression. The number of differentially
expressed genes identified for each inbred-hybrid group based on stringent statistical criteria is plotted against the genetic dis-
tance between parents. Spots representing crosses between stiff stalk (SS) and non-stiff stalk (NSS) groups are shown in red,
and spots representing crosses within either group are shown in blue. The Pearson's R correlation value and p-value of the
regression are shown.
BMC Plant Biology 2008, 8:33 />Page 7 of 19
(page number not for citation purposes)
Assessment of hybrid expression additivity
We compared the levels of additive and non-additive
expression in this series of six hybrid genotypes. An initial
visual assessment using clustered heat map expression
profiles indicated that the six hybrids were exhibiting
additive or near-additive expression levels compared to
the respective parental genotypes [see Additional file 4].
To assess the proportions of statistically additive and non-
additive expression patterns in the hybrids, we conducted
t-tests of the hybrid expression values versus the inbred
mid-parent values for all DE genes. A substantial propor-
tion of the DE genes exhibited non-additive expression
patterns, however, the proportions were very similar
among the six different hybrids (23.2–30.3%; Table 1).
No obvious trend was identified between parental genetic
diversity and non-additive expression. In fact, the hybrid
with the least amount of genetic diversity, B84 × B73,
exhibited the greatest (30.3%) proportion of non-additive
genes relative to the other hybrids.
We proceeded to assess the specific classes of non-additive
expression that were exhibited in these maize hybrids. A
non-additive gene could exhibit expression levels that are
statistically between the mid-parent and high or low
parental values (hereafter referred to as 'between parent
non-additive' expression), expression levels equivalent to
the high parent (HP) or low parental (LP) values, or at lev-
els above high parent (AHP) or below low parent (BLP)
(Figure 1). We assessed the number of parent-like (HP or
LP), AHP and BLP hybrid expression patterns within the
subset of non-additively expressed genes in each of the six
hybrids (Table 1). Expression profiles were assigned to the
Validation of differential expression using MassArray and 70-mer platformsFigure 5
Validation of differential expression using MassArray and 70-mer platforms. The magnitude of differential expres-
sion between inbred lines based on the Affymetrix data was compared to the magnitude of differential expression detected
using the MassArray platform and 70-mer microarray platform. The subset of the genes identified as differentially expressed on
the Affymetrix platform (FDR < 0.05, and additional quality control filters; see Methods) was used for these analyses. The color
coding of the data points indicates the inbred genotype comparison. (A) The same inbred RNA samples used for Affymetrix
microarray analyses were mixed in a pairwise 1:1 ratio and subjected to MassArray relative allelic quantification [25]. The cor-
relation between the MassArray proportions and the proportions calculated from the Affymetrix dataset (inbred 1 signal
divided by the sum of the two inbred signals) are shown. Each spot represents the proportion of one allele per inbred-inbred
comparison. The B73 and Mo17 sequence SNPs were used to design the assays, thus this comparison is most highly repre-
sented in this analysis. (B) Many genes that were determined to be differentially expressed in the Affymetrix dataset were also
present on the 70-mer microarray platform. The correlation of the inbred expression fold-differences on the 70-mer oligonu-
cleotide microarray and the Affymetrix microarray are shown. Each spot represents the fold-differences of one gene per
inbred-inbred comparison. The 70-mer microarray data validated the directionality of the Affymetrix microarray patterns in
84–91% of the differentially expressed profiles (see main text).
70-mer oligonucleotide array fold-change (log
2
)
Affymetrix array fold-change (log
2
)
Affymetrix data: Proportion of
transcripts from inbred 1
MassArray data: Proportion of transcripts from
inbred 1 in a 1:1 mix of inbred RNA
B73 - Mo17
Oh43 - B73
Oh43 - Mo17
B37 - B73
B84 - B73
Oh43 - B73
Oh43 - Mo17
B37 - B73
B84 - B73
A) B)
BMC Plant Biology 2008, 8:33 />Page 8 of 19
(page number not for citation purposes)
parent-like category whenever hybrid expression levels
were not significantly different from either the high or low
parent (based on two-tailed t-tests, P < 0.05). Expression
profiles were assigned to the AHP or BLP categories when-
ever hybrid expression levels were significantly above the
high parent or below the low parent, respectively (one-
tailed t-test, P < 0.05). The remaining genes with non-
additive expression exhibited between parent non-addi-
tive expression levels. Very few genes (15 total genes
among the six hybrids) were AHP or BLP using these cri-
teria. A larger fraction of the non-additively expressed
genes (18.7% among the six hybrids) exhibited parental-
like expression levels. The majority (~80.1% among the
six hybrids) of the non-additively expressed genes exhib-
ited between parent non-additive expression levels, such
that the hybrids expressed these genes at levels that are
between the two parents but are statistically different from
the mid-parent and parental levels. An assessment of AHP
and BLP patterns applying more liberal criteria are pre-
sented below in section Hybrid expression patterns outside of
the parental range.
In addition to using statistical tests to determine the types
and frequencies of non-additive expression, we also uti-
lized a variety of plots using d/a values to visualize the dis-
tribution of hybrid expression values relative to the
parental expression levels. In our application of the d/a
calculation (described in the Methods section), a d/a
value of zero indicated additive hybrid expression, d/a
values of 1 or -1 indicated hybrid expression levels equal
to one of the parents, and d/a values > 1 or <-1 indicated
hybrid expression levels outside of the parental range.
We performed the d/a calculations in two different ways
(see Methods for calculation details). The first d/a calcula-
tion (hereafter termed 'd/a type I') assesses the hybrid
expression levels relative to the high parent and low par-
ent for each gene. The second d/a calculation (hereafter
termed 'd/a type II') assesses the hybrid expression levels
relative to the maternal parent and paternal parent, allow-
ing for the identification of maternal or paternal effects on
gene expression in the hybrid. The distributions of the d/
a values for the six different inbred-hybrid groups were
strikingly similar (Figure 6A–B). The d/a type I distribu-
tion for all six hybrids is centered at approximately zero,
and the distribution tails consistently flattened within the
parental range (between -1.0 and 1.0) (Figure 6A). We did
note that the center of the d/a type I distribution is skewed
slightly towards the low parent. We suspected that the
slight deviation of d/a type I values from the mid-parent
levels may be caused by technical rather than biological
factors. We found that genes with lower expression signals
exhibited greater deviation from zero than genes with
high expression signals [see Additional file 5]. The d/a
Distribution of d/a values for Affymetrix differentially expressed genesFigure 6
Distribution of d/a values for Affymetrix differentially expressed genes. Distributions of d/a ratios for differentially
expressed genes based on Affymetrix microarray data. (A) d/a type I values indicate the hybrid expression levels relative to the
low-parent and high-parent levels. The distributions are very similar for the six different hybrids. Hybrid expression patterns
center approximately around the mid-parent level with very flat distributions outside of the parental range. (B) d/a type II val-
ues indicate the hybrid expression levels relative to the maternal-parent and paternal-parent levels. Again, all six hybrids exhibit
similar distributions peaking around mid-parent levels, indicating no maternal or paternal expression biases. (C) The distribu-
tions of d/a type II values for the subset of differentially expressed genes that exhibited non-additive hybrid expression profiles.
The distributions indicate that the non-additive patterns for most genes are still within the parental range, and are oftentimes
observed near the mid-parent (additive) values.
Low-parent
level
High-parent
level
Mid-parent
level
Prop. of genes in each d/a bin
<-2.0 -1.0 0 1.0 >2.0
Maternal-parent
level
Paternal-parent
level
Mid-parent
level
d/a ratio
(type I)
d/a ratio
(type II)
A) All DE genes B) All DE genes C) Non-additive genes
B84xB73
B37xB73
Oh43xB73
Oh43xMo17
Mo17xB73
B73xMo17
B84xB73
B37xB73
Oh43xB73
Oh43xMo17
Mo17xB73
B73xMo17
B84xB73
B37xB73
Oh43xB73
Oh43xMo17
Mo17xB73
B73xMo17
<-2.0 -1.0 0 1.0 >2.0 <-2.0 -1.0 0 1.0 >2.0
Maternal-parent
level
Paternal-parent
level
Mid-parent
level
d/a ratio
(type II)
BMC Plant Biology 2008, 8:33 />Page 9 of 19
(page number not for citation purposes)
type I distribution for genes with at least one genotype sig-
nal > 10000 units exhibited no deviation from zero for all
six hybrids [see Additional file 5]. These findings suggest
that technical factors, such as a slightly non-linear
dynamic range among the lower microarray signal inten-
sities, may be causing the slightly skewed distributions.
Similar to the d/a type I findings, the d/a type II distribu-
tions also displayed a remarkably consistent distribution
among the six hybrids patterns, as they each peaked at
approximately zero and the tails flattened within the
parental range (Figure 6B). There is no evidence for skew-
ing of the d/a type II distribution, indicating that hybrid
expression did not consistently favor the maternal or
paternal parent. A previous study had noted an intriguing
transcriptional parental effect in which the hybrid tissues
collected from the immature ears of 16 different hybrids
generally exhibited paternal-like expression patterns for
genes that were more highly expressed in the maternal ver-
sus the paternal parent [15]. Genes that were more highly
expressed in the paternal parent tended to exhibit mid-
parent expression patterns in the hybrids [15]. We
attempted to replicate the Guo et al. [15] analysis using
the 'd/a type II' calculation on our Affymetrix dataset [see
Additional file 5]. No such unidirectional skewing was
observed in our dataset; the two gene subsets were equally
skewed towards the respective low parent levels, which is
simply a reflection of the low-parent skewing observed in
Figure 6A. It is possible that the explanation for the differ-
ences between these two studies is because of the different
tissues used, immature ears [15] versus seedlings (this
study).
The d/a type II distribution for the subset of non-additive
genes exhibited a bi-modal distribution, with the trough
located around the additive d/a value of zero (Figure 6C).
The distribution indicated that most non-additively
expressed genes exhibited hybrid expression values
between the parental levels, with only a small proportion
of genes found outside of the d/a parental range of -1.0 to
1.0 (Figure 6C). This distribution confirms the conclu-
sions based on statistical tests described above.
We also identified DE genes and calculated d/a type I val-
ues using the 70-mer oligonucleotide microarray data (see
Methods for details on statistical analyses). The distribu-
tion of the d/a plots from 70-mer oligonucleotide micro-
array data are very similar to the plots generated from the
Affymetrix data (Figure 7A). The d/a type I distribution for
all four hybrids are similarly shaped, with each centered
near zero (Figure 7A). However, the 70-mer oligonucle-
otide microarray d/a plots indicated that a substantial
proportion of genes have hybrid expression levels outside
of the parental range. This is evidenced by the fact that
many of the genes exhibit d/a type I values greater than
1.0 or less than -1.0 (Figure 7A). In total, 20.6% of the DE
patterns exhibited d/a values outside the parental range in
the 70-mer oligonucleotide microarray data. By compari-
son, the Affymetrix d/a distributions were nearly flat out-
side of these values and only 1.3% of the DE patterns
exhibited d/a values outside the parental range (Figure 6).
It is not clear why the two microarray platforms exhibited
differences in the fraction of genes with d/a values outside
the parental range. We considered the possibility that the
different sets of genes represented on either platform may
result in different rates of non-additive profiles. To
address this, we generated a d/a plot (type I) of the 70-mer
oligonucleotide microarray data using only the DE fea-
tures that are also represented on the Affymetrix platform
(Figure 7B). The resulting d/a distribution is very similar
to the d/a distribution generated by all DE genes (Figure
7A), indicating that platform feature biases are not caus-
ing the differences in non-additive profiles observed
between the microarray platforms.
It is important to remember that these d/a values are a
composite of multiple biological replicates and they do
not include estimates of variation. A closer inspection of
several genes with d/a values above 1.0 or below -1.0
revealed that while the average d/a values are outside the
parental range, they are often not statistically significant.
We estimated the degree of variation within each platform
by comparing the signal intensity variation among the
biological replicates within each genotype. For each DE
gene, we divided the standard deviation of the three bio-
logical replicates by the mean of the three biological rep-
licates. These calculations indicated that the 70-mer
oligonucleotide microarray data generated approximately
twice as much signal variation among replicates than the
Affymetrix platform [see Additional file 6]. This higher
level of signal variation likely contributes to the wider dis-
tributions of d/a values observed in Figure 7.
Overall, the Affymetrix data d/a plots indicated that the
hybrid expression distributions were similar for all six
hybrids, with peaks at approximately zero and very few
genes exhibiting hybrid expression patterns outside of the
parental range (d/a > 1.0 or <-1.0) (Figure 6). This is in
strong agreement with the clustered heat maps [see Addi-
tional file 4] and statistical analyses of additivity (Table
1). In general, the hybrids exhibited additive expression
and the majority of genes with non-additive expression
still exhibited expression levels within the parental range.
Hybrid expression patterns outside of the parental range
The analyses of Affymetrix microarray data described in
the previous section applied relatively stringent statistical
significance parameters. The Affymetrix results identified
5020 DE patterns among the parents and hybrids of six
BMC Plant Biology 2008, 8:33 />Page 10 of 19
(page number not for citation purposes)
Distribution of d/a values for 70-mer array differentially expressed genesFigure 7
Distribution of d/a values for 70-mer array differentially expressed genes. Distributions of d/a (type I) ratios for dif-
ferentially expressed genes based on the 70-mer oligonucleotide microarray data. (A) The d/a distributions for all differentially
expressed genes. The distributions of the four hybrids are very similar to one another and peak at approximately zero, as was
observed in Affymetrix microarray data. (B) The d/a distributions for the subset of differentially expressed genes that are also
represented with features on the Affymetrix platform. The distributions are similar to those in (A). In both (A) and (B), the
proportion of DE genes with d/a values above 3.0 or below -3.0 are all plotted as a single data point. The proportion of d/a val-
ues above 3.0 and below -3.0 for hybrid B84 × B73 plotted beyond the range of the displays and are not shown.
Low-parent
level
High-parent
level
Mid-parent
level
Prop. of genes in each d/a bin
<-3.0 -2.0 -1.0 0 1.0 2.0 >3.0
d/a ratio (type I)
<-3.0 -2.0 -1.0 0 1.0 2.0 >3.0
Prop. of genes in each d/a bin
B84xB73
B37xB73
Oh43xB73
Oh43xMo17
B84xB73
B37xB73
Oh43xB73
Oh43xMo17
A)
B)
BMC Plant Biology 2008, 8:33 />Page 11 of 19
(page number not for citation purposes)
crosses, however only 15 hybrid gene expression patterns
were found to be significantly outside of the parental
ranges. Several other groups have reported observing
much higher frequencies of hybrid expression outside the
parental range [21-23]. In this section, we have applied
more liberal statistical significance and fold-change
thresholds to the Affymetrix data in order to identify
hybrid expression patterns outside of the parental range
that may have been missed when applying the stringent
statistical criteria.
The number of DE genes was substantially increased when
applying an ANOVA FDR < 0.15 (as opposed to 0.05 in
Table 1). This identified a total of 13,280 DE patterns
among the six hybrids (Table 2 and 3). We then deter-
mined the number of patterns that exhibited expression
above (318) or below (538) the parental range. Only
6.4% of all DE patterns exhibited expression levels out-
side the parental range. Of the 856 examples of expression
outside the parental range, only 221 patterns are statisti-
cally different from the near-parent levels (Table 2 and 3).
These 221 patterns represent 213 genes (eight genes
exhibited AHP or BLP in two of the six inbred-hybrid
groups). The majority of these genes showed less than 1.1-
fold differences from the near-parent, and successively
higher fold-change stringency thresholds rapidly filtered
the remaining genes; only nine genes showed greater than
2-fold changes outside of the parental range (Table 2 and
3). These data indicate that for the vast majority of AHP
and BLP genes, the expression divergence from near-par-
ent levels is relatively small. Several methods were used to
validate these AHP and BLP expression patterns. We
began by comparing the d/a values for these 221 examples
of AHP or BLP expression in the Affymetrix data to the d/
a values for these genes in the 70-mer oligonucleotide
microarray data [see Additional file 7]. The 70-mer oligo-
nucleotide microarray data supported AHP or BLP expres-
sion for 53 of the 127 genes (42%) with available data.
Thus, the 70-mer oligonucleotide microarray data vali-
dated some of the examples of AHP or BLP expression, but
also indicated that some of these profiles may be false-
positives. Quantitative real-time PCR analyses validated
the AHP or BLP expression for six of eight of the genes
tested (these 8 genes were selected due to the availability
of good sequence and the ability to design gene-specific
primers) [see Additional file 7]. We also noted that many
of the 213 AHP or BLP genes tend to exhibit low levels of
AHP or BLP expression in multiple hybrids, suggesting
potential conservation of the AHP or BLP patterns [see
Additional files 7 and 8]. Our results indicate that a small
fraction of genes display significant AHP and BLP expres-
sion in hybrid maize seedlings. Furthermore, compari-
sons of the different inbred-hybrid combinations provide
evidence that many of these genes are consistently
expressed outside of the parental range across different
hybrid lines.
Gene ontology analyses
We compared the relative representation of gene ontology
(GO) categories for the DE genes versus the total number
of probe sets present on the Affymetrix microarray. For
this analysis, the DE genes from the stringent Affymetrix
analysis (FDR < 0.05, and minimum signal and fold-
change filters; see Methods) were combined from the six
inbred-hybrid groups. We did not identify any substantial
divergence or overrepresentation of any specific GO anno-
tation in the DE genes (Figure 8A). We also tested the full
set of genes with additive or non-additive expression and
did not find enrichment for any GO annotations within
these lists of genes (Figure 8A). The relative proportion of
each category approximately matched the proportion
present on the microarray, suggesting that differential
expression and additivity occur at equal rates for all func-
tional types of genes.
We also compared the GO representation for the AHP and
BLP genes versus the total number of probe sets present
on the Affymetrix microarray. In this case, we did identify
some obvious over- and under-represented categories
(Figure 8B). Most obviously, the AHP genes appeared to
Table 2: Identification of above-high parent (AHP) expression patterns
B84 × B73 B37 × B73 Oh43 × B73 Oh43 × Mo17 Mo17 × B73 B73 × Mo17 Total (%)
#DE Genes* 920 1979 2851 2430 2570 2530 13280
#DE Genes F1>HP** 9 32 139 62 24 52 318 (2.39%)
#DE Genes F1>HP (p <
0.05)***
1 8 47 14 7 16 93 (0.70%)
AHP fold-change #Sig. genes w/ F1/HP 1.0–1.1 1 3 16 8 5 6 39 (0.29%)
#Sig. genes w/ F1/HP 1.1–1.2 0 3 24 2 1 6 36 (0.27%)
#Sig. genes w/ F1/HP 1.2–1.5 0 0 5 2 0 2 9 (0.07%)
#Sig. genes w/ F1/HP 1.5–2.0 0 1 0 1 1 1 4 (0.03%)
#Sig. genes w/ F1/HP > 2.0 0 1 2 1 0 1 5 (0.04%)
*Based on FDR < 0.15 and at least one genotype (parent and/or hybrid) average microarray signal > 50
**Subset of DE genes with microarray signal intensities outside of the parental range (AHP or BLP, respectively)
***Subset of DE genes with microarray signal intensities significantly outside of the parental range (based on one-tailed t-tests)
BMC Plant Biology 2008, 8:33 />Page 12 of 19
(page number not for citation purposes)
be over-represented by electron transport and energy
pathway processes, plastid and ribosome components,
and structural molecular functions. The AHP genes were
under-represented in nucleus components and several
molecular function categories, including transcription fac-
tor activities. Generally, the BLP genes exhibited less fre-
quent over- or under-representations than the AHP genes.
Over-represented BLP categories included hydrolase and
transferase molecular functions.
The biological meaning of the over- and under-repre-
sented AHP and BLP categories remains unclear. The func-
tion of these gene classes may be particularly important in
conferring heterosis. However, because the number of
AHP and BLP genes is relatively small (only ~1.6% of the
total microarray features), frequency analyses of these
genes are more susceptible to sampling and stochastic
effects.
Discussion
Linking maize genetic diversity and transcriptional
variation
It is especially important to recognize that genetic and
transcriptional assessments of natural variation apply dif-
ferent experimental procedures and analysis tools.
Sequence-based genetic diversity studies utilize a stable
character for scoring variation, typically DNA sequence
polymorphisms. Studying transcriptional diversity
involves measuring an unstable unit, mRNA, that is sub-
ject to change based on developmental and environmen-
tal cues. Multiple sources of variation in gene expression
datasets may increase the measurement variance among
replicates, thereby reducing statistical power.
In the present study, we compared the transcriptional
diversity of six different maize inbred-hybrid combina-
tions. We found that the number of DE genes identified
for each inbred-hybrid group strongly correlated with the
genetic diversity between inbred lines, as estimated by
SNP-based sequence analyses [23]. A comparison of the
number of DE genes for each of the 10 possible pairs of
inbred genotypes also revealed a strong correlation
between transcriptional and genetic diversity (data not
shown). Our previous work using allele-specific expres-
sion assays indicated that maize intraspecific transcrip-
tional variation is primarily driven by cis-acting sources of
variation [17,26]. It is possible that increased levels of
sequence polymorphism linked to genes may be at least
partially responsible for the higher rates of transcriptional
variation observed in more genetically distant inbreds.
Indeed, the intergenic space in the maize genome is
known to be highly polymorphic among inbred lines
[12,28], and these structural and nucleotide polymor-
phisms may drive transcriptional variation of certain
maize genes.
Implications of non-additive expression patterns
We were also interested in identifying possible links
between transcriptional profiles and heterotic perform-
ance. A higher number of differentially expressed genes
were identified in the inbred-hybrid combinations repre-
senting more distantly related genotypes. The hybrids
derived from more genetically diverse inbred parents
exhibited higher numbers of both additive and non-addi-
tive gene expression patterns. However, the proportion of
non-additive hybrid expression profiles among the DE
genes was similar for all six hybrids. Additionally, the rel-
ative proportions of genes that display different types of
non-additive expression were similar in the six hybrids.
These data suggest that the prevalence of non-additive
expression in seedling tissue is not correlated with differ-
ent heterosis levels.
It is tempting to infer that non-additive hybrid expression
patterns imply novel hybrid regulation or may be associ-
ated with heterosis. However, it is important to consider
that non-additive expression patterns include both pre-
dictable and unpredictable patterns. Using the "expres-
sion level" as a phenotype, we can describe non-additive
expression patterns using dominance terminology. The
Table 3: Identification of below-low parent (BLP) expression patterns
B84 × B73 B37 × B73 Oh43 × B73 Oh43 × Mo17 Mo17 × B73 B73 × Mo17 Total (%)
#DE Genes* 920 1979 2851 2430 2570 2530 13280
#DE Genes F1<LP** 9 98 150 111 86 84 538 (4.05%)
#DE Genes F1<LP (p < 0.05)*** 1 26 41 31 20 9 128 (0.96%)
BLP fold-change #Sig. genes w/ LP/F1 1.0–1.1 0 6 9 12 6 5 38 (0.29%)
#Sig. genes w/ LP/F1 1.1–1.2 1 10 24 11 7 2 55 (0.41%)
#Sig. genes w/ LP/F1 1.2–1.5 0 8 5 6 7 1 27 (0.20%)
#Sig. genes w/ LP/F1 1.5–2.0 0 1 1 2 0 0 4 (0.03%)
#Sig. genes w/ LP/F1 > 2.0 0 1 2 0 0 1 4 (0.03%)
*Based on FDR < 0.15 and at least one genotype (parent and/or hybrid) average microarray signal > 50
**Subset of DE genes with microarray signal intensities outside of the parental range (AHP or BLP, respectively)
***Subset of DE genes with microarray signal intensities significantly outside of the parental range (based on one-tailed t-tests)
BMC Plant Biology 2008, 8:33 />Page 13 of 19
(page number not for citation purposes)
genes with between-parent non-additive expression can
be described as partially dominant while genes with HP or
LP expression can be described as dominant. Classical
genetics provides many examples of partial or complete
dominance in an F
1
hybrid and in many cases the molec-
ular mechanisms for this type of inheritance have been
determined. In our study, even when we applied liberal
statistical criteria for DE gene identification, > 98% of the
non-additively expressed genes exhibited expression phe-
notypes that could be described as partial or complete
dominance.
Many studies of intraspecific F
1
hybrid gene expression
have focused upon the identification of genes with expres-
sion levels outside the parental range, including studies in
Drosophila [29], Arabidopsis [14] and oyster [30], among
others. Such patterns (termed AHP or BLP in this study)
have often been described as over- or under-dominant.
These are unpredictable hybrid expression patterns and
may be caused by novel hybrid-specific regulatory mecha-
nisms. The importance of AHP or BLP expression patterns
in heterosis is unclear. It is possible that the AHP or BLP
expression patterns may play a role in driving heterosis.
However, it is also possible that the AHP or BLP expres-
sion patterns are a consequence, not a cause, of heterosis.
The previous study by Swanson-Wagner et al. [11] had
documented evidence that while additive expression was
most common, all potential modes of hybrid gene expres-
sion were observed in the B73 × Mo17 hybrid. In this
Distribution of DE, AHP and BLP genes among gene ontologiesFigure 8
Distribution of DE, AHP and BLP genes among gene ontologies. (A) The distributions of GO terms assigned for the
entire Affymetrix microarray, the differentially expressed genes, and the subsets of additive and non-additive differentially
expressed genes are compared. (B) The distributions of GO terms assigned for the entire Affymetrix microarray, the AHP sub-
set and the BLP subset are compared. In both (A) and (B), the GO terms are ordered on the graph from highest frequency on
the microarray (left) to lowest frequency on the microarray (right) within the Biological process, Cellular component, and
Molecular function categories, respectively.
0%
5%
10%
15%
20%
25%
Array genes
AHP genes
BLP genes
o
t
h
e
r
m
e
t
a
b
o
l
i
c
p
r
o
c
e
s
s
e
s
o
t
h
e
r
c
e
l
l
u
l
a
r
p
r
o
c
e
s
s
e
s
u
n
k
n
o
w
n
b
i
o
l
o
g
i
c
a
l
p
r
o
c
e
s
s
e
s
p
r
o
t
e
i
n
m
e
t
a
b
o
l
i
s
m
c
e
l
l
o
r
g
a
n
i
z
a
t
i
o
n
a
n
d
b
i
o
g
e
n
e
s
i
s
t
r
a
n
s
p
o
r
t
r
e
s
p
o
n
s
e
t
o
a
b
i
o
t
i
c
o
r
b
i
o
t
i
c
s
t
i
m
u
l
u
s
d
e
v
e
l
o
p
m
e
n
t
a
l
p
r
o
c
e
s
s
e
s
r
e
s
p
o
n
s
e
t
o
s
t
r
e
s
s
o
t
h
e
r
b
i
o
l
o
g
i
c
a
l
p
r
o
c
e
s
s
e
s
t
r
a
n
s
c
r
i
p
t
i
o
n
s
i
g
n
a
l
t
r
a
n
s
d
u
c
t
i
o
n
e
l
e
c
t
r
o
n
t
r
a
n
s
p
o
r
t
o
r
e
n
e
r
g
y
p
a
t
h
w
a
y
s
D
N
A
o
r
R
N
A
m
e
t
a
b
o
l
i
s
m
o
t
h
e
r
m
e
m
b
r
a
n
e
s
u
n
k
n
o
w
n
c
e
l
l
u
l
a
r
c
o
m
p
o
n
e
n
t
s
o
t
h
e
r
i
n
t
r
a
c
e
l
l
u
l
a
r
c
o
m
p
o
n
e
n
t
s
o
t
h
e
r
c
y
t
o
p
l
a
s
m
i
c
c
o
m
p
o
n
e
n
t
s
c
h
l
o
r
o
p
l
a
s
t
n
u
c
l
e
u
s
m
i
t
o
c
h
o
n
d
r
i
a
p
l
a
s
t
i
d
r
i
b
o
s
o
m
e
c
y
t
o
s
o
l
E
R
p
l
a
s
m
a
m
e
m
b
r
a
n
e
G
o
l
g
i
a
p
p
a
r
a
t
u
s
c
e
l
l
w
a
l
l
u
n
k
n
o
w
n
m
o
l
e
c
u
l
a
r
f
u
n
c
t
i
o
n
s
o
t
h
e
r
e
n
z
y
m
e
a
c
t
i
v
i
t
y
h
y
d
r
o
l
a
s
e
a
c
t
i
v
i
t
y
t
r
a
n
s
f
e
r
a
s
e
a
c
t
i
v
i
t
y
o
t
h
e
r
b
i
n
d
i
n
g
p
r
o
t
e
i
n
b
i
n
d
i
n
g
t
r
a
n
s
p
o
r
t
e
r
a
c
t
i
v
i
t
y
k
i
n
a
s
e
a
c
t
i
v
i
t
y
D
N
A
o
r
R
N
A
b
i
n
d
i
n
g
n
u
c
l
e
o
t
i
d
e
b
i
n
d
i
n
g
t
r
a
n
s
c
r
i
p
t
i
o
n
f
a
c
t
o
r
a
c
t
i
v
i
t
y
o
t
h
e
r
m
o
l
e
c
u
l
a
r
f
u
n
c
t
i
o
n
s
s
t
r
u
c
t
u
r
a
l
m
o
l
e
c
u
l
e
a
c
t
i
v
i
t
y
n
u
c
l
e
i
c
a
c
i
d
b
i
n
d
i
n
g
r
e
c
e
p
t
o
r
b
i
n
d
i
n
g
o
r
a
c
t
i
v
i
t
y
e
x
t
r
a
c
e
l
l
u
l
a
r
o
t
h
e
r
c
e
l
l
u
l
a
r
c
o
m
p
o
n
e
n
t
s
0%
5%
10%
15%
20%
25%
Array genes
DE genes
Non-additive genes
Additive genes
A)
B)
Percentage of genesPercentage of genes
Biological process Cellular component Molecular function
BMC Plant Biology 2008, 8:33 />Page 14 of 19
(page number not for citation purposes)
study we report similar findings and extend this analysis
to additional hybrids that exhibit different levels of
genetic diversity. The number of AHP or BLP genes
reported in maize hybrid expression profiles has varied
widely from essentially none [17] to a small proportion of
genes [11,15] to a larger proportion of genes [18,23] and
even up to > 50% of DE genes [21]. There are several
potential explanations for this discrepancy. It could be
that different tissues or developmental stages exhibit dif-
ferent levels of AHP and BLP expression. Alternatively, it
could be that different expression profiling technologies,
sampling methodologies or experimental designs influ-
ence the discovery of AHP and BLP expression patterns, as
described by Cui et al. [31] and Rottscheidt and Harr [32].
Indeed, using the same RNA samples across platforms, we
found substantially more AHP and BLP patterns on the
70-mer oligonucleotide microarray platform than on the
Affymetrix platform. However, real-time PCR rarely vali-
dated the 70-mer oligonucleotide microarray AHP and
BLP patterns (2/12 genes; data not shown), but more fre-
quently validated the Affymetrix AHP and BLP patterns
(6/8 genes). If we assume that AHP and BLP expression
patterns are quite rare, then greater degrees of technical
variation in an expression profiling platform may lead to
higher numbers of false-positive AHP or BLP observa-
tions.
Complications in predicting heterosis
In this study, we investigated the heterotic responses of 25
different maize F
1
hybrids across five different traits, plant
height, days to flowering, seed weight, seedling height and
seedling biomass. Our goal was to ascertain whether het-
erosis for any particular trait was predictive of heterosis for
another trait. Furthermore, we wanted to observe the rela-
tionship between heterosis and parental genetic distance
for each trait.
A major goal of this study was to compare the types of
expression variation observed in hybrids with differing
levels of heterosis. In order to perform this experiment we
wanted to ascertain whether certain hybrids would show
higher or lower levels of heterosis for a variety of traits.
However, we found that there is generally a lack of corre-
lation for heterosis levels among different traits. Few
hybrids appeared to consistently exhibit either high or
low relative heterosis among traits. This suggests that het-
erosis is not an organism wide phenomenon but instead
is trait-specific, and is likely controlled by partially non-
redundant sets of genes for different traits.
Previous studies have found that genetic distance between
inbred parents is correlated with grain yield heterosis in
maize when the parental lines are closely related but that
this correlation breaks down when the parental lines are
distantly related [5]. Our analysis of non-yield traits in a
relatively small number of hybrid genotypes concurs with
the previous studies on the correlation between yield het-
erosis and genetic distant. We found that genetic distance
was an inconsistent predictor of heterosis. Only one of
five traits (seedling biomass) was found to have a signifi-
cant correlation between genetic distance and heterosis. In
general, hybrids derived from closely related parents had
relatively low levels of heterosis. However, hybrids
derived from distantly related parents displayed a range of
heterotic responses, including high and low BPH values.
As in studies of yield heterosis, this means that genetic dis-
tance can often be used to predict poorly performing
hybrids but has weak power to predict superior hybrids.
Hamblin et al. [24] suggested that the difficulty in predict-
ing hybrid performance for more distantly related parents
may be due in part to difficulties in accurately assessing
genetic distance for more distantly related inbreds.
Conclusion
This study indicates that there is a strong correlation
between genetic diversity and transcriptional variation
among maize inbreds. However, the degree of genetic or
transcriptional variation between the inbred parents
appears to be an inconsistent predictor of hybrid hetero-
sis, depending on the trait of interest. The frequency and
patterns of non-additive hybrid expression profiles appear
to be similar among different hybrids. Together, these
data suggest that maize hybrid heterosis may be more
influenced by the additive complementation of transcrip-
tional variation than by novel non-additive expression
states.
Methods
Plant growth and phenotyping
Fifteen inbred lines and twenty-five hybrids were grown
on the St. Paul campus Agricultural Experiment Station
during the Summer of 2006. One row of each genotype
was planted in each of two randomized complete blocks;
the block planting dates were separated by 12 days. All
plants that reached full maturity were scored for three
traits; plant height, flowering time and weight of 50 seeds.
The plants were monitored daily following tassel develop-
ment and the flowering date for each plant was recorded
as the first day the tassels shed pollen. Thereafter, mature
plant heights were measured as the distance from the
ground to the top of the tassel. Open-pollinated ears were
harvested from each plant and dried; 50 seeds were col-
lected and weighed from each ear to measure average seed
mass. The mean values for each trait were calculated for
each genotype within each biological replicate; 70%
trimmed means were used for the height and days to flow-
ering traits to control for outliers. The trait means and
standard deviations were calculated from the two biolog-
ical replicate means and were subsequently used to calcu-
late the percentage heterosis for each trait. The percentage
BMC Plant Biology 2008, 8:33 />Page 15 of 19
(page number not for citation purposes)
better parent heterosis (BPH) was calculated for each bio-
logical replicate as:
%BPH = [(Hybrid mean – Better-parent mean)/Better-par-
ent mean] × 100
The overall %BPH mean and standard deviation was cal-
culated based on the two biological replicate %BPH val-
ues. Heterosis for days to flowering is considered here as a
measure of earliness, and thus BPH represents the percent-
age of time hybrid plants flowered before the earlier-flow-
ering parent.
The same genotypes were planted in 7 1/2" azalea pots
and grown in standard greenhouse conditions for 11 days.
For each biological replicate, a total of eighteen seedlings
were grown (six seedlings each in three pots). The pots
were placed in a randomized design within the green-
house. Three biological replicates of this experiment were
planted in succession. After 11 days of growth the seed-
lings were scored for above-ground plant height by meas-
uring from the base of the plant to the tip of the longest
extended leaf. Additionally, above-ground seedling tis-
sues were harvested, dried, and then weighed for biomass
measurements. The mean values for height and biomass
were calculated for each genotype within each biological
replicate. Percentage BPH was calculated using the mean
values across biological replicates, as described above.
BPH measurements were plotted against the intra- or
inter-heterotic group status of each cross and the genetic
distance between parents of each cross. The intra- or inter-
heterotic group status of each cross was based on the clas-
sifications by Flint-Garcia et al. [33]. The Nei genetic dis-
tance values are based on data from 847 SNP markers
[24].
Affymetrix microarray analyses
RNA was isolated from above ground tissue of 11-day old
maize seedling for five maize inbreds (B37, B73, B84,
Mo17 and Oh43) and four hybrids (B37 × B73, B84 ×
B73, Oh43 × B73 and Oh43 × Mo17). Three biological
replicates were grown using standard greenhouse condi-
tions (1:1 mix of autoclaved field soil and MetroMix; 16
hours light and 8 hours dark; daytime temperature of
30°C and night temperature of 22°C) and sampled on
the 11
th
day after planting between 8:00 and 9:00 am. The
plants were cut immediately above the highest brace root,
thus all above-ground tissues and meristems were col-
lected. Each biological replicate consisted of pooled tissue
from eight different seedlings of the same genotype. Total
RNA samples were isolated using TRIzol (Invitrogen,
Carlsbad, CA) and purified using the RNeasy system
(QIAGEN, Valencia, CA). RNA quantity and quality were
assessed using the Nanodrop spectrophotometer (Nano-
drop Technologies, Montchanin, DE) and agarose gel
electrophoresis.
Affymetrix microarray hybridizations using the Maize
GeneChip were performed for RNA samples from three
biological replicate samples for each genotype. RNA col-
lection, labelling and hybridization followed published
methodologies [17]. The Affymetrix microarray data was
deposited in the Gene Expression Omnibus (GEO) under
accession number GSE10236. Affymetrix microarray data
previously generated with the same experimental design
on genotypes B73, Mo17, B73 × Mo17 and Mo17 × B73
[17] (GEO accession number GSE8174) were included in
the analyses for purposes of further comparison.
Microarray statistical analyses were performed with each
parent-hybrid group. For example, the genotypes B37,
B73 and B37 × B73 were normalized and analyzed
together, the genotypes Oh43, B73 and Oh43 × B73 were
normalized and analyzed together, and so on for the six
different parent-hybrid groups. Data normalization
between microarrays was performed using GC-RMA, and
a per-gene normalization was applied to the resulting val-
ues using GeneSpring version 7.2 software. Genes that
were differentially expressed among genotypes were iden-
tified by performing a one-way ANOVA on the normal-
ized data using a parametric test with no assumption of
equal variance. A Benjamini and Hochberg correction for
multiple testing was applied using a false-discovery rate
(FDR) of 0.05. We removed genes that did not exhibit at
least one genotype with an average microarray signal
greater than 50 units and genes that did not exhibit at least
a 1.2-fold change between any two of the three genotypes.
These filters were imposed to remove genes with very
minor differential expression or genes with little evidence
for expression. Thus, genes that exhibited a FDR < 0.05
and passed the minimum signal and fold change thresh-
olds were determined to be differentially expressed.
Subsequent analyses of the differentially expressed genes
focused on assessing the expression levels of hybrid versus
parental genotypes. Hierarchical clustering of gene expres-
sion profiles were conducted using GeneSpring software.
A statistical test for non-additive hybrid expression levels
was performed by comparing the inbred midparent
expression levels versus the hybrid expression levels. A
two-tail homoscedastic t-test was performed and all genes
with P < 0.05 were considered to be non-additively
expressed.
The d/a ratios were calculated for all differentially
expressed genes using two different methods, which we
have termed type I and type II for purposes of clarifica-
tion. Type I d/a values were calculated as described in
Stupar et al. [20] and were used to compare the hybrid
BMC Plant Biology 2008, 8:33 />Page 16 of 19
(page number not for citation purposes)
expression relative to the high parent and low parent for
each gene. Briefly, to calculate the type I d/a, the d value is
calculated as the hybrid signal minus the average signal of
the two parents, and the a value is calculated as the high
parent signal minus the average signal of the two parents.
Genes with d/a values equal to 0.0 exhibit additive expres-
sion compared to the parents. Genes with d/a values equal
to 1.0 or -1.0 exhibit hybrid expression levels equal to the
high parent (HP) or low parent (LP), respectively. Genes
with d/a values greater than 1.0 or less than -1.0 indicated
genes with hybrid expression levels above the high-parent
(AHP) or below the low-parent (BLP), respectively. Statis-
tical confirmation of AHP or BLP patterns was determined
by a one-tailed homoscedastic t-test of the hybrid expres-
sion values versus the high-parent or low-parent values,
respectively; genes with P < 0.05 were considered valid
AHP or BLP calls. Type II d/a values were used to compare
the hybrid expression relative to the maternal and pater-
nal parent for each gene. To calculate the type II d/a, the d
value is calculated as the hybrid signal minus the average
signal of the two parents, and the a value is calculated as
the paternal parent signal minus the average signal of the
two parents. Genes with d/a values equal to 0.0 exhibit
additive expression compared to the parents. Genes with
d/a values equal to 1.0 or -1.0 exhibit hybrid expression
levels equal to the paternal parent or maternal parent,
respectively. Genes with d/a values greater than 1.0 or less
than -1.0 indicated genes with hybrid expression levels
outside of the parental range.
A second set of analyses were conducted on the Affymetrix
data to liberalize our search for genes with hybrid AHP or
BLP expression patterns. The ANOVA were performed as
described above, however a FDR threshold of 0.15 was
applied to identify differentially expressed genes. Homo-
scedastic one-tail t-tests (P < 0.05) of the hybrid expres-
sion levels versus the high parent or low parent were used
to identify hybrid genes with AHP or BLP patterns, respec-
tively. The magnitude of the AHP and BLP expression pat-
terns were estimated by calculating the fold change of the
hybrid versus the high parent or low parent, respectively.
Gene ontology analyses of the DE, AHP and BLP gene sub-
sets were performed as described in Makarevitch et al.
[34].
70-mer oligonucleotide microarray analyses
The same RNA samples from the five maize inbreds (B37,
B73, B84, Mo17 and Oh43) and four hybrids (B37 × B73,
B84 × B73, Oh43 × B73 and Oh43 × Mo17) were also
hybridized to the maize 70-mer oligonucleotide microar-
ray developed at the University of Arizona [27]. This array
contains 43,537 unique 70-mer oligonucleotide features.
Two-color microarray hybridizations were performed
according to a reference design over the three biological
replicates from each genotype. The 70-mer oligonucle-
otide microarray data was deposited in GEO under acces-
sion number GSE10542.
Hybridization target was prepared using a protocol [35]
similar to that of Eberwine [36] which utilizes an oligo dT
primer that incorporates a T7 viral promoter to linearly
increase mRNA concentration by in vitro transcription.
The target amplification protocol utilized the Ambion
Aminoallyl Message Amp II kit (Catalog # 1751, Ambion,
Austin TX), which had been optimized to utilize reduced
reaction volumes. Sample RNAs were labelled with Cy3
dye and the pooled reference samples were labelled with
Cy5 dye. Prior to hybridization, the slides were prepared
as described previously by Gardiner et al. [27]. The 70-mer
arrays were hybridized on a Tecan 4800 HS Pro hybridiza-
tion station (Tecan Services Inc., Durham, NC) which is
capable of processing 12 arrays in a single hybridization
run. The arrays were scanned on an Axon 4100 AL scanner
(Molecular Devices Corporation, Sunnyvale, CA) imme-
diately after being hybridized. Raw expression data were
generated from the resulting TIF images using the GenePix
6.0 software package (Molecular Devices Corporation,
Sunnyvale, CA)
Initial microarray statistical analyses were performed in
order to compare the Affymetrix and 70-mer oligonucle-
otide microarray results. The (median – median back-
ground) Cy3 70-mer microarray signal intensities were
normalized with each parent-hybrid group using the per
chip normalize to 50
th
percentile and the per gene nor-
malize to median parameters in Genespring version 7.2
software. We identified the 70-mer microarray features
that matched the differentially expressed probe sets in the
Affymetrix dataset. For these genes, the log
2
fold-change
expression ratios between inbred genotypes were calcu-
lated for both microarray platforms. These ratios were
compared across the Affymetrix and 70-mer microarray
datasets to determine the correlation among platforms.
A second set of statistical analyses were performed on the
70-mer oligonucleotide microarray data to identify genes
that were differentially expressed among genotypes within
each parent-hybrid group. For these analyses, spot values
from the raw data were flagged if any of the following
were observed: > 30% of the pixels were saturated in either
channel, spot diameter < 70 um in either channel, or spot
was not found by the scanning software. Genes in which
flags were found in any of the biological replicates of at
least two genotypes were removed from further analyses.
Additionally, genes in which the average raw signal inten-
sity was < 200 units in the most intense genotype were
also removed. Following these filtration steps, ~40% of
the spot features remained for each parent-hybrid group.
Data from these remaining features were normalized
BMC Plant Biology 2008, 8:33 />Page 17 of 19
(page number not for citation purposes)
using the per chip normalize to 50
th
percentile and the per
gene normalize to median parameters in Genespring ver-
sion 7.2 software, as described above. Genes that were dif-
ferentially expressed among genotypes were identified by
performing a one-way ANOVA on the normalized data
using a parametric test with no assumption of equal vari-
ance. A Benjamini and Hochberg correction for multiple
testing was applied using a false-discovery rate (FDR) of
0.10. Genes that did not exhibit at least a 2-fold change
between any two of the three genotypes were removed
from further analyses. Additionally, features that exhib-
ited statistically significant changes in the Cy5 reference
channel (FDR < 0.10) or showed a high degree of varia-
tion in the Cy5 reference channel ((signal standard devia-
tion)/(signal mean) > 0.50) were also removed. Using this
series of statistical tests and quality control measures, the
following numbers of features were found to be differen-
tially expressed among genotypes on the 70-mer oligonu-
cleotide microarray: parent-hybrid group B37, B73, B37 ×
B73: 1,555; B84, B73, B84 × B73: 430; Oh43, B73, Oh43
× B73: 1,847; Oh43, Mo17, Oh43 × Mo17: 1,183. The d/
a ratios were calculated for these genes as described above
in the "Affymetrix microarray analyses" section.
Expression validation using Real-Time qPCR
The same RNA samples used for microarray analyses were
also used for real-time qPCR in an attempt to validate
some of the AHP and BLP expression patterns. A set of
eight genes with AHP or BLP expression levels at least 1.5
fold outside the range of the parents were selected from
the Affymetrix analyses (specific genes are indicated in
Additional file 7). Another 12 genes with AHP or BLP
expression levels at least 1.5 fold outside the range of the
parents in the 70-mer oligonucleotide microarray analysis
of Oh43 × B73 hybrids were also selected. These genes
were selected based on our ability to design effective,
gene-specific primers for real-time qPCR analyses. 2.5 μg
of total RNA was treated with RQ1 DNase (Promega,
Madison, WI) according to manufacturer's instructions to
remove contaminating DNA. RNAs were immediately
cooled on ice following DNAse digestion, mixed with 1 μg
oligo dT (Promega) and heated to 70°C for 10 minutes,
followed by 1 minute on ice. First strand cDNA synthesis
was performed using 1 μl M-MLV reverse transcriptase
according to the manufacturer's instructions (Promega).
This reaction was incubated at 42°C for 50 minutes fol-
lowed by 70°C for 15 minutes. 1 μl of cDNA was used as
template in real-time qPCR reactions, containing 10 μl 2×
SYBR Green PCR Master Mix (Applied Biosystems, Foster
City, CA), 1 μl each of forward and reverse primer and 7
μl water. Reactions were performed using the 7900HT
Real-Time PCR System (Applied Biosystems) with the fol-
lowing cycling parameters: 95° for 10', 40 cycles of 95°
for 30", 60° for 30", 72° for 30", followed by a disassoci-
ation stage (melting curve analysis). Threshold value was
empirically determined based on the observed linear
amplification phase of all primer sets. Sample cycle
threshold (Ct) values were standardized for each template
based on a GAPC control primer reaction, and the com-
parative Ct method [37] was used to determine the rela-
tive transcript abundance of each gene.
Authors' contributions
RMS conceived of the study, participated in its design, col-
lected heterosis phenotype data, carried out the Affyme-
trix microarray hybridizations, performed all microarray
data analyses and drafted the manuscript. AGO per-
formed the heterosis phenotype data collection and anal-
ysis. WJH carried out the real-time PCR analyses. VLC and
JMG were responsible for the 70-mer microarray hybridi-
zations and scanning and helped draft the manuscript.
NMS conceived of the study, participated in its design,
and helped draft the manuscript. All authors read and
approved the final manuscript.
Additional material
Additional file 1
Phenotypic measurements for five traits in 15 inbreds and 25 hybrids.
Click here for file
[ />2229-8-33-S1.xls]
Additional file 2
Genetic distance between inbreds and BPH values for hybrids. Nei SNP
genetic distance values are shown for 21 inbred pairwise comparisons.
BPH for five traits are also shown for the 21 corresponding hybrids, and
four other hybrid combinations.
Click here for file
[ />2229-8-33-S2.xls]
Additional file 3
Pearson's R values for genotype BPH among traits. Correlations of BPH
across the five traits are given. The primary data used to compute these
correlations are given in Additional files 1 and 2.
Click here for file
[ />2229-8-33-S3.xls]
Additional file 4
Clustering analysis of differentially expressed genes. Clustering analysis to
compare inbred-hybrid expression patterns.
Click here for file
[ />2229-8-33-S4.pdf]
Additional file 5
Distribution of d/a ratios for specific sub-groups. Comparison of d/a dis-
tributions for specific subsets of genes.
Click here for file
[ />2229-8-33-S5.pdf]
BMC Plant Biology 2008, 8:33 />Page 18 of 19
(page number not for citation purposes)
Acknowledgements
Peter J. Hermanson, Anna K. Bredsten and Anne Bergmark provided assist-
ance with phenotypic measurements in the field and greenhouse. The
authors thank the University of Minnesota Microarray Facility for perform-
ing the Affymetrix microarray chemistries. The Minnesota Supercomputing
Institute provided access to software packages used for data analysis. This
work is supported by NSF DBI 0421619 to NMS. Robert Sandoval provided
assistance in 70-mer microarray experiments, which were supported by
NSF DBI 0321663 to VLC.
References
1. East EM: Inbreeding in corn. Rep Connecticut Agric Exp Stn 1908,
1907:419-429.
2. Shull GH: The composition of a field of maize. American Breeders
Assoc Rep 1908, 4:296-301.
3. Melchinger AE: Genetic diversity and heterosis. In The genetics
and exploitation of heterosis and crop plants Edited by: Coors JG, Staub
JE. Madison, WI: Crop Science Society of America; 1999:99-118.
4. Tracy WF, Chandler MA: The Historical and Biological Basis of
the Concept of Heterotic Patterns in Corn Belt Dent Maize.
In Plant Breeding: The Arnel Hallauer International Symposium Edited by:
Lamkey K, Lee M. Ames, IA: Blackwell Pub; 2006:219-233.
5. Melchinger AE, Gumber RK: Overview of heterosis and heter-
otic crops in agronomic crops. In Concepts and breeding of heter-
otic crop plants Edited by: Lamkey KL, Staub JE. Madison, WI: Crop
Science Society of America; 1998:29-44.
6. Moll RH, Lonnquist JH, Fortuno JV, Johnson EC: The Relationship
of Heterosis and Genetic Divergence in Maize. Genetics 1965,
52:139-144.
7. Zanoni U, Dudley JW: Comparison of different methods of
identifying inbreds useful for improving elite maize hybrids.
Crop Science 1989, 29:577-582.
8. Tollenaar M, Ahmadzadeh A, Lee EA: Physiological Basis of Het-
erosis for Grain Yield in Maize. Crop Sci 2004, 44:2086-2094.
9. Auger DL, Peters EM, Birchler JA: A Genetic Test of Bioactive
Gibberellins as Regulators of Heterosis in Maize. J Hered 2005,
96:614-617.
10. Hoecker N, Keller B, Piepho HP, Hochholdinger F: Manifestation of
heterosis during early maize (Zea mays L.) root develop-
ment. Theor Appl Genet 2006, 112:421-429.
11. Swanson-Wagner RA, Jia Y, DeCook R, Borsuk LA, Nettleton D,
Schnable PS: All possible modes of gene action are observed in
a global comparison of gene expression in a maize F1 hybrid
and its inbred parents. Proc Natl Acad Sci USA 2006,
103:6805-6810.
12. Springer NM, Stupar RM: Allelic variation and heterosis in
maize: how do two halves make more than a whole? Genome
Res 2007, 17:
264-275.
13. Birchler J, Auger D, Riddle N: In Search of the Molecular Basis of
Heterosis. Plant Cell 2003, 15:2236-2239.
14. Vuylsteke M, van Eeuwijk F, Van Hummelen P, Kuiper M, Zabeau M:
Genetic analysis of variation in gene expression in Arabidop-
sis thaliana. Genetics 2005, 171:1267-1275.
15. Guo M, Rupe MA, Yang X, Crasta O, Zinselmeier C, Smith OS,
Bowen B: Genome-wide transcript analysis of maize hybrids:
allelic additive gene expression and yield heterosis. Theor Appl
Genet 2006, 113:831-845.
16. Huang Y, Zhang L, Zhang J, Yuan D, Xu C, Li X, Zhou D, Wang S,
Zhang Q: Heterosis and polymorphisms of gene expression in
an elite rice hybrid as revealed by a microarray analysis of
9198 unique ESTs. Plant Mol Biol 2006, 62:579-591.
17. Stupar RM, Springer NM: Cis-transcriptional variation in maize
inbred lines B73 and Mo17 leads to additive expression pat-
terns in the F1 hybrid. Genetics 2006, 173:2199-2210.
18. Pea G, Ferron S, Gianfranceschi L, Krajewski P, Enrico Pè M: Gene
expression non-additivity in immature ears of a heterotic F1
maize hybrid. Plant Science 2008, 174:17-24.
19. Song S, Qu H, Chen C, Hu S, Yu J: Differential gene expression
in an elite hybrid rice cultivar (Oryza sativa, L) and its paren-
tal lines based on SAGE data. BMC Plant Biol 2007, 7:49.
20. Stupar RM, Hermanson PJ, Springer NM: Nonadditive Expression
and Parent-of-Origin Effects Identified by Microarray and
Allele-Specific Expression Profiling of Maize Endosperm.
Plant Physiol 2007, 145:411-425.
21. Uzarowska A, Keller B, Piepho HP, Schwarz G, Ingvardsen C, Wenzel
G, Lubberstedt T: Comparative expression profiling in meris-
tems of inbred-hybrid triplets of maize based on morpholog-
ical investigations of heterosis for plant height. Plant Mol Biol
2007, 63:21-34.
22. Auger DL, Gray AD, Ream TS, Kato A, Coe EH Jr, Birchler JA: Non-
additive Gene Expression in Diploid and Triploid Hybrids of
Maize. Genetics 2005, 169:389-397.
23. Meyer S, Pospisil H, Scholten S:
Heterosis associated gene
expression in maize embryos 6 days after fertilization exhib-
its additive, dominant and overdominant pattern. Plant Mol
Biol 2007, 63:381-391.
24. Hamblin MT, Warburton ML, Buckler ES: Empirical Comparison
of Simple Sequence Repeats and Single Nucleotide Polymor-
phisms in Assessment of Maize Diversity and Relatedness.
PLos One 2007, 2:e1367.
25. Kirst M, Basten CJ, Myburg AA, Zeng ZB, Sederoff RR: Genetic
architecture of transcript-level variation in differentiating
xylem of a eucalyptus hybrid. Genetics 2005, 169:2295-2303.
26. Springer NM, Stupar RM: Allele-Specific Expression Patterns
Reveal Biases and Embryo-Specific Parent-of-Origin Effects
in Hybrid Maize. Plant Cell 2007, 19:2391-2402.
27. Gardiner JM, Buell CR, Elumalai R, Galbraith DW, Henderson DA,
Iniguez AL, Kaeppler SM, Kim JJ, Smith A, Zheng L, Chandler VL:
Design, production, and utilization of long oligonucleotide
microarrays for expression analysis in maize. Maydica 2005,
50:425-436.
28. Messing J, Dooner H: Organization and variability of the maize
genome. Current Opinion in Plant Biology 2006, 9:157-163.
29. Gibson G, Riley-Berger R, Harshman L, Kopp A, Vacha S, Nuzhdin S,
Wayne M: Extensive sex-specific nonadditivity of gene expres-
sion in Drosophila melanogaster. Genetics 2004, 167:1791-1799.
30. Hedgecock D, Lin J, DeCola S, Haudenschild CD, Meyer E, Manahan
DT, Bowen B: Transcriptomic analysis of growth heterosis in
larval Pacific oysters (Crassostrea gigas). Proc Natl Acad Sci U S
A 2007, 104:2313-2318.
31. Cui X, Affourtit J, Shockley KR, Woo Y, Churchill GA: Inheritance
Patterns of Transcript Levels in F1 Hybrid Mice. Genetics
2006, 174:627-637.
Additional file 6
Estimate of microarray signal variation between biological replicates of
each genotype on the Affymetrix and 70-mer oligonucleotide microarray
platforms.
Click here for file
[ />2229-8-33-S6.xls]
Additional file 7
d/a values across genotypes for genes identified as AHP or BLP in at least
one hybrid using liberal criteria. The d/a values for each of the six hybrid
genotypes are shown for genes exhibiting AHP or BLP in at least one
hybrid. This display is used to identify genes with consistent patterns of
AHP or BLP expression across hybrids, based on Affymetrix data. Cross-
validation data from the spotted microarray and real-time PCR platforms
are also shown.
Click here for file
[ />2229-8-33-S7.xls]
Additional file 8
Clustering analysis of genes with AHP and BLP profiles. Comparison of
AHP and BLP profiles across multiple hybrid genotypes.
Click here for file
[ />2229-8-33-S8.pdf]
Publish with BioMed Central and every
scientist can read your work free of charge
"BioMed Central will be the most significant development for
disseminating the results of biomedical research in our lifetime."
Sir Paul Nurse, Cancer Research UK
Your research papers will be:
available free of charge to the entire biomedical community
peer reviewed and published immediately upon acceptance
cited in PubMed and archived on PubMed Central
yours — you keep the copyright
Submit your manuscript here:
/>BioMedcentral
BMC Plant Biology 2008, 8:33 />Page 19 of 19
(page number not for citation purposes)
32. Rottscheidt R, Harr B: Extensive additivity of gene expression
differentiates subspecies of the house mouse. Genetics 2007,
177:1553-1567.
33. Flint-Garcia SA, Thuillet AC, Yu J, Pressoir G, Romero SM, Mitchell
SE, Doebley J, Kresovich S, Goodman MM, Buckler ES: Maize asso-
ciation population: a high-resolution platform for quantita-
tive trait locus dissection. Plant J 2005, 44:1054-1064.
34. Makarevitch I, Stupar RM, Iniguez AL, Haun WJ, Barbazuk WB, Kaep-
pler SM, Springer NM: Natural Variation for Alleles Under Epi-
genetic Control by the Maize Chromomethylase Zmet2.
Genetics 2007, 177:749-760.
35. Maize microarray hybridization protocols [ze
array.org/maize_protocols.shtml]
36. Van Gelder RN, von Zastrow ME, Yool A, Dement WC, Barchas JD,
Eberwine JH: Amplified RNA synthesized from limited quanti-
ties of heterogeneous cDNA. Proc Natl Acad Sci USA 1990,
87:1663-1667.
37. Livak KJ, Schmittgen TD: Analysis of Relative Gene Expression
Data Using Real-Time Quantitative PCR and the 2-ΔΔCT
Method. Methods 2001, 25:402-408.