báo cáo khoa học: " A flax fibre proteome: identification of proteins enriched in bast fibres" potx
Bạn đang xem bản rút gọn của tài liệu. Xem và tải ngay bản đầy đủ của tài liệu tại đây (716.57 KB, 13 trang )
BioMed Central
Page 1 of 13
(page number not for citation purposes)
BMC Plant Biology
Open Access
Research article
A flax fibre proteome: identification of proteins enriched in bast
fibres
Naomi SC Hotte and Michael K Deyholos*
Address: Department of Biological Sciences, Edmonton, T6G 2E9, Canada
Email: Naomi SC Hotte - ; Michael K Deyholos* -
* Corresponding author
Abstract
Background: Bast fibres from the phloem tissues of flax are scientifically interesting and
economically useful due in part to a dynamic system of secondary cell wall deposition. To better
understand the molecular mechanisms underlying the process of cell wall development in flax, we
extracted proteins from individually dissected phloem fibres (i.e. individual cells) at an early stage
of secondary cell wall development, and compared these extracts to protein extracts from
surrounding, non-fibre cells of the cortex, using fluorescent (DiGE) labels and 2D-gel
electrophoresis, with identities assigned to some proteins by mass spectrometry.
Results: The abundance of many proteins in fibres was notably different from the surrounding
non-fibre cells of the cortex, with approximately 13% of the 1,850 detectable spots being
significantly (> 1.5 fold, p ≤ 0.05) enriched in fibres. Following mass spectrometry, we assigned
identity to 114 spots, of which 51 were significantly enriched in fibres. We observed that a K
+
channel subunit, annexins, porins, secretory pathway components, β-amylase, β-galactosidase and
pectin and galactan biosynthetic enzymes were among the most highly enriched proteins detected
in developing flax fibres, with many of these proteins showing electrophoretic patterns consistent
with post-translational modifications.
Conclusion: The fibre-enriched proteins we identified are consistent with the dynamic process of
secondary wall deposition previously suggested by histological and biochemical analyses, and
particularly the importance of galactans and the secretory pathway in this process. The apparent
abundance of β-amylase suggests that starch may be an unappreciated source of materials for cell
wall biogenesis in flax bast fibres. Furthermore, our observations confirm previous reports that
correlate accumulation proteins such as annexins, and specific heat shock proteins with secondary
cell wall deposition.
Background
Flax (Linum usitatissimum L.) has attracted human atten-
tion since the beginning of agriculture [1,2]. This is due in
part to the unusual properties of the bast (i.e. phloem)
fibres, which because of their great length and high tensile
strength have found use in textiles and many other prod-
ucts [3]. Fibre length is achieved almost entirely through
intrusive growth, which is a process limited to very few
cell types in plants [4,5]. The elongation stage is succeeded
by a dynamic process of secondary wall deposition, in
which a matrix of galactose-rich polymer in the nascent
wall is gradually and centripetally replaced by highly crys-
Published: 30 April 2008
BMC Plant Biology 2008, 8:52 doi:10.1186/1471-2229-8-52
Received: 7 November 2007
Accepted: 30 April 2008
This article is available from: />© 2008 Hotte and Deyholos; licensee BioMed Central Ltd.
This is an Open Access article distributed under the terms of the Creative Commons Attribution License ( />),
which permits unrestricted use, distribution, and reproduction in any medium, provided the original work is properly cited.
BMC Plant Biology 2008, 8:52 />Page 2 of 13
(page number not for citation purposes)
talline cellulose [6]. Because secondary wall deposition
increases the tensile strength of cells, fibres which have
undergone even the very first stages of cell wall thickening
can be distinguished mechanically by their resistance to
breakage at the "snap-point" of the stem [7]. The snap-
point thus defines an important developmental transition
from cell elongation to cell wall thickening.
Previously, we and others have produced libraries of
cDNAs from fibre-bearing peels of flax and hemp stems
[8,9]. In addition to containing bast fibres at various
stages of development, these peels also contained many
other cell types, including those associated with cambium
and transport phloem. Analysis of these libraries by cDNA
microarray hybridization and other techniques identified
distinct patterns of expression of transcripts of polysac-
charide-related enzymes in stem peels during fibre elonga-
tion and cell wall deposition. However, due to inherent
technical and biological limitations, it is known that in
many circumstances, abundance of transcripts and pro-
teins for a given gene may not be highly correlated
[10,11]. This well-established limitation on the biological
relevance of transcriptome analysis led us to complement
our previous work with a survey of the proteins present in
developing flax fibres during the onset of secondary wall
deposition. This is similar to a proteomics approaches
used to study secondary cell wall development of other
cell types in other species [12-16]. For this study of the
proteome, we also increased the specificity of our analysis
by extracting proteins from phloem fibres that had been
individually dissected from the snap point of growing
stems, and comparing their abundance to proteins in the
surrounding, non-fibre cells of the cortex from the same
stems. The objective of this study is therefore to identify
those proteins that contribute to the interesting pattern of
cell wall deposition in flax fibres.
Results and discussion
Separation of fibre and non-fibre proteins
To increase our understanding of the proteins that con-
tribute to the unique properties of flax bast fibres, we
extracted proteins from ultimate fibres (i.e. individual
cells) dissected from the snap-point region of vegetative
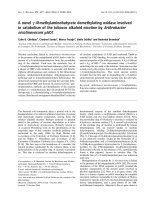
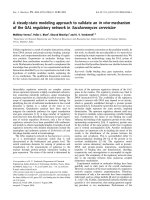
stems (21–24 days post germination) (Figure 1). The
snap-point is the stem region in which secondary wall
deposition begins [7]. We also collected the surrounding
non-fibre cells (consisting predominantly of parenchyma,
sieve elements, and companion cells) from the cortex of
the snap-point. Throughout the remainder of this report,
will refer to the ultimate bast fibres we collected from the
snap-point as simply "fibres", and the surrounding, non-
fibre cells of the cortex as the "non-fibre fraction". By
labelling proteins from fibres and the non-fibre fraction
with contrasting fluorescent dyes, and separating the mix-
ture of the two samples simultaneously using 2D gel elec-
trophoresis (DiGE), we were able to identify proteins that
were more abundant in fibres as compared to the non-
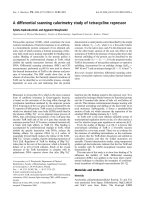
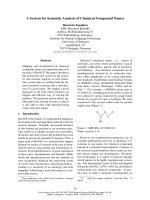
fibre fraction (Figure 2).
In each of four replicate gels, we detected an average of
1850 distinct protein spots from fibres, and 1695 spots
from the non-fibre fraction. In total, 558 protein spots dif-
fered in fluorescent signal intensity by at least 1.5 fold (p
≤ 0.05) between the samples, with 246 spots (13% of total
detected) enriched in fibres and 312 spots (18% of total)
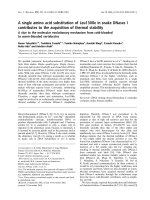
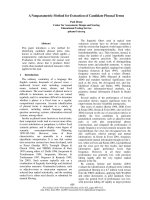
enriched in the non-fibre fraction (Figure 3). The distinc-
tive protein profiles of fibres and the non-fibre fraction
A typical flax plant at the time of fibre extractionFigure 1
A typical flax plant at the time of fibre extraction. (A)
The 3 cm region of the stem from which fibres were dis-
sected is indicated by the bracket. (B) Detail of a transverse
section of fresh stem tissues at the time of harvest. This hand
section was obtained from just below the snap-point to dem-
onstrate the arrangement of tissues within the stem, i.e.
transverse sectioning was not used when obtaining tissues
for protein analysis. A bracket indicates the region of the
cortex from which the fibre and non-fibre fractions would be
obtained. The position of representative fibres within the
cortex is shown by arrowheads. The scale bar is 100 µm. (C)
Stem tissues during dissection. Fibres from which surround-
ing, non-fibres cells been partially removed are indicated by
arrowheads. A fully dissected fibre, comprising a single cell is
indicated by the arrow. This fibre is representative of the
cells from which proteins were extracted. The scale bar is
100 µm.
BMC Plant Biology 2008, 8:52 />Page 3 of 13
(page number not for citation purposes)
were also evident from visual inspection of the DiGE gel
image (Figure 2). Phloem fibres therefore appear to
express a complement of proteins that is distinct from sur-
rounding cell types in the stem.
Protein identification by LC/MS
We picked 190 protein spots that were enriched in fibre
samples for identification by mass spectrometry. Spots
were selected based on criteria of large spot volume, high
fold-enrichment of signals, and well-focused spot mor-
phology. For comparison, we also selected an additional
50 spots that were enriched in non-fibre fractions or that
were similarly abundant in both types of protein samples.
Although the patterns of fold-enrichment that we report
were reproducible within the statistical parameters indi-
cated (Table 1), individual ratios should not be extrapo-
lated quantitatively to whole proteins, in part because
some proteins may be represented by more than one spot.
We subjected a total of 240 spots to analysis by LC/MS. Of
these, 126 spots produced spectra that could not be
assigned to existing sequences, while spectra from the
remaining 114 spots produced significant matches (i.e.
MOWSE scores 40–675; two or more peptides matched
per spot) to predicted spectra from Genbank protein data-
bases (Table 1). Four spots (#7, #41, #72, #89) contained
predicted peptides that matched more than one distinct
protein, indicating the presence of multiple proteins in
some spots on the gel. Of the spots to which we assigned
protein identities, 76 were enriched by at least 1.5 fold
(i.e. 1.5×) in fibre samples, and 51 of these were statisti-
cally more abundant (p ≤ 0.05) in fibres than the non-
fibre fraction. Conversely, we were able to assign identity
to 17 spots enriched 1.5-fold or more in the non-fibre
fraction; at least seven of these were associated with pho-
tosynthesis (spots #44–#47, #73, #74, #81). Because pho-
tosynthesis is a process expected to dominate metabolism
Representative analytical DiGE gelFigure 2
Representative analytical DiGE gel. Proteins extracted from fibre and surrounding non-fibre tissues were fluorescently
labeled with red and green dyes, respectively, and were mixed then separated simultaneously using 2D gel electrophoresis.
Labels correspond to protein spot numbers used in Table 1 and in the text. The pH range of the first dimension separation is
from 3 (left) to 10 (right).
BMC Plant Biology 2008, 8:52 />Page 4 of 13
(page number not for citation purposes)
in the non-fibre fraction, these observations are consistent
with the physical separation of fibre and non-fibre tissues
we hoped to achieve by dissection. We will focus the
remainder of this report on the spots that were enriched in
fibres.
The fibre-enriched proteins to which we were able to
assign putative identities were classified into eight func-
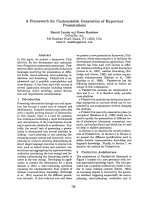
tional categories (Figure 4). Aside from the category we
called "miscellaneous", which represented a diverse set of
functions, most of the proteins that were identified in
fibre samples could be assigned to one of three categories
related to the conversion of carbohydrates for energy or
glycan biosynthesis, namely: primary carbon and energy
metabolism; one-carbon metabolism; and cell wall and
polysaccharide metabolism (Figure 4). The predominance
of these proteins for the metabolism of carbohydrates and
related compounds is consistent with the major biochem-
ical activities we expected to observe within cells active in
secondary wall biogenesis. In addition, we assigned a
smaller number of proteins to each of the remaining cate-
gories: membrane transport; cytoskeleton & secretion;
ATPases; and protein & amino acid metabolism. The
membership of proteins assigned to spots in each of the
eight functional categories is shown in Table 1, and is dis-
cussed in more detail in the following sections.
Primary carbon and energy metabolism
The conversion of monosaccharides and starch into
energy is the inferred function of the largest proportion of
proteins that were enriched (> 1.5 fold) in fibres, as com-
pared to the non-fibre fraction at the stem snap point (Fig-
ure 4). These reactions are also summarized in Figure 5.
Two of the most highly enriched proteins we detected in
any functional category were β-amylase (spot #17; 8.8×
fold enriched in fibres), and fructose kinase (#93, 6.7×;
#94, 2.2×; #96, 2.0×), which catalyze the first steps in the
catabolism of starch and fructose, respectively (Table 1).
The increased relative abundance of these enzymes in
fibres provides some insight into the immediate sources
of carbon and energy for secondary wall biogenesis. We
also detected the statistically significant (p ≤ 0.05) enrich-
ment of enzymes of glycolysis and related processes,
namely fructose-bisphosphate aldolase (#78, 2.4×), glyc-
eraldehyde 3-phosphate dehydrogenase (#83, 2.6×; #87,
2.8×), and phosphoglucomutase (#27, 1.8×; #28, 3.7×),
as well as the presence of phosphoglycerate kinase (#68,
#71). Finally, we identified fibre-enriched protein spots
putatively representing 5 of 8 enzymes of the tricarboxylic
acid cycle, where further energy and metabolic precursors
are generated from the products of glycolysis. The tricar-
boxylic acid cycle -associated proteins that were signifi-
cantly enriched in fibres and included citrate synthase
(#63, 3.7×), succinyl coA-ligase (#82, 2.3×), fumarase
(#57, 2.5×), and malate dehydrogenase (#92, 3.3×). Aco-
nitate hydratase (#2, #3) was also detected, although its
fold-enrichment was not statistically significant (p >
0.05).
ATPases
Many subunits of the ATPase/synthase complex were
identified in either fibres or the non-fibre fraction, includ-
ing an α-subunit (#35), β-subunits (#42, #43), and a γ-
subunit (#99). The tissue-specific abundance patterns of
these various subunits were surprisingly complex: the γ-
subunit and one β-subunit (#42) were associated with
equal spot intensities in both sample types, while the
other ATP synthase β-subunit (#44), was 1.8× more abun-
dant in the non-fibre fraction. Only the α-subunit was
more abundant (1.6×) in fibres.
In addition to the ATPase/synthases described above, we
identified peptides from several other types of putative
ATPases, including three protein spots containing vacu-
olar-type ATPase (v-ATPase), of which, two spots (#24,
2.6×; #105, 1.8×) were significantly (p ≤ 0.05) enriched in
fibres. v-ATPases are some of the most abundant mem-
brane proteins in the vacuole and endomembrane system,
and their enrichment may reflect increased relative abun-
dance of these organellar structures in fibres [17]. We also
detected a putative plasma membrane-associated AAA-
ATPase (#1, 1.6×) in fibres, although this was not deemed
to be more abundant in fibres by our usual statistical cri-
teria. Both v-ATPases and AAA-ATPases have been previ-
ously demonstrated to be essential for vesicle transport,
Frequency distribution of mean intensity ratios for all spotsFigure 3
Frequency distribution of mean intensity ratios for all
spots. A mean ratio near 1 meant the spot was found in
equal abundance in both tissues; spots represented to the
right of this point on the axis had higher signal intensity in
fibre tissues, while spots represented to the left were more
intense in non-fibre tissues. The grey and black regions of
each bar show the portion of spots for which p > 0.05 and p
≤ 0.05, respectively, in a t-test of the significance of differ-
ences in intensity between fibre and non-fibre tissues.
BMC Plant Biology 2008, 8:52 />Page 5 of 13
(page number not for citation purposes)
Table 1: Protein identities based on peptide matches to Genbank protein databases
fold enrich.
b
spot ID# func. cat.
a
protein identity Genbank ID fibre non-fibre p-value
c
Mowse score pep. count
d
2 C&E aconitate hydratase 4586021 1.5 0.14 64 2
3 C&E aconitate hydratase 4586021
1.5 0.08 68 2
17 C&E β-amylase 1771782
8.8 < 0.01 46 2
39 C&E ribulose-1,5-bisphosphate carboxylase/oxygenase large
subunit
168312
1.5 0.25 85 2
40 C&E ribulose-1,5-bisphosphate carboxylase, large subunit 168312
2.0
e
0.08 180 4
44 C&E ribulose-1,5-bisphosphate carboxylase, large subunit 1834444
6.1 < 0.01 129 5
45 C&E ribulose-1,5-bisphosphate carboxylase, large subunit 2687483
5.4 < 0.01 130 4
46 C&E ribulose-1,5-bisphosphate carboxylase, large subunit 6983900
2.9 < 0.01 232 6
47 C&E ribulose-1,5-bisphosphate carboxylase, large subunit 1817560
3.3 < 0.01 250 5
48 C&E enolase 9581744
1.1 0.65 265 7
49 C&E enolase 8919731
1.1 0.93 158 3
50 C&E enolase 9581744
3.4 0.02 206 6
51 C&E ribulose-1,5-bisphosphate carboxylase, large subunit 4098530
2.8 0.04 103 4
57 C&E fumarate hydratase 108708038
2.5 0.01 83 2
58 C&E fumarate hydratase 15226618
1.6 0.33 100 4
59 C&E 6-phosphogluconate dehydrogenase 2529229
1.5 0.19 100 3
63 C&E citrate synthase 11066954
3.7 < 0.01 123 4
68 C&E phosphoglycerate kinase 1161600
1.2 0.56 257 4
71 C&E phosphoglycerate kinase 92872324
1.7 0.06 426 7
72 C&E ribulose-1,5-bisphosphate carboxylase/oxygenase large
subunit
66735801
96 3
73 C&E rubisco activase 13430332
6.1 < 0.01 70 3
74 C&E rubisco activase 170129
5.2 < 0.01 61 3
75 C&E phosphoglycerate kinase 3328122
2.9 0.02 250 6
77 C&E fructose-bisphosphate aldolase 15227981
1.1 0.82 155 3
78 C&E fructose-bisphosphate aldolase 20204
2.4 0.03 102 2
79 C&E fructose-bisphosphate aldolase 15227981
1.1 0.6 116 2
80 C&E fructose-bisphosphate aldolase 20204
1.3 0.04 177 3
81 C&E rubisco activase 4261547
2.2 0.03 60 2
82 C&E succinate-CoA ligase 15225353
2.3 0.02 253 5
83 C&E glyceraldehyde-3-phosphate dehydrogenase 120666
2.6 0.01 76 2
86 C&E glyceraldehyde-3-phosphate dehydrogenase 3023813
1.1 0.49 71 3
87 C&E glyceraldehyde-3-phosphate dehydrogenase 74419004
3.8 < 0.01 215 6
90 C&E malate dehydrogenase 18297
1.6 0.17 241 4
91 C&E malate dehydrogenase 18297
1.4 0.26 138 4
92 C&E malate dehydrogenase 10334493
3.3 < 0.01 296 7
93 C&E fructokinase 31652274
6.7 < 0.01 142 5
94 C&E fructokinase 31652274
2.2 < 0.01 154 3
96 C&E kinase/ribokinase, potential fructokinase 15224669
2 0.01 208 8
1 ATP AAA-ATPase 86212372
1.6 0.24 322 10
7 ATP ATPase, transitional endoplasmic reticulum 7378614
1.2
e
0.65 101 4
24 ATP vacuolar proton-ATPase 50251203
2.6 0.02 585 13
31 ATP ATP binding 15221770
1 0.87 100 4
35 ATP F1 ATPase 12986
1.6 0.05 143 6
40 ATP ATP synthase β subunit 21684923
2.0
e
0.08 192 4
42 ATP ATP synthase β subunit 19685
1 0.99 675 12
43 ATP ATP synthase β subunit 56784991
1.8 0.06 307 7
99 ATP F1-ATPase gammma subunit 303626
10.66843
105 ATP vacuolar V-H
+
ATPase subunit E 5733660 1.8 0.01 53 2
106 ATP vacuolar V-H
+
ATPase subunit E 5733660 1.1 0.82 100 4
12 CWP β-galactosidase 115437888
8.4 < 0.01 43 3
13 CWP β-galactosidase 3641863
8.9 < 0.01 42 2
14 CWP β-galactosidase 3641863
5.4 < 0.01 105 5
15 CWP β-galactosidase 3641863
8.8 < 0.01 96 5
16 CWP β-galactosidase 34913072
9.3 < 0.01 72 4
18 CWP MUCILAGE-MODIFIED 4 42562732
4.1 < 0.01 57 2
19 CWP rhamnose biosynthetic enzyme 108707484
6.6 < 0.01 100 6
27 CWP phosphoglucomutase 12585309
1.8 0.15 170 4
28 CWP phosphoglucomutase 6272281
3.7 0.02 122 5
36 CWP UDP-glucose pyrophosphorylase 6136112
1.4 0.37 82 3
38 CWP UDP-glucose pyrophosphorylase 82659609
3.5 0.01 166 6
41 CWP UDP-glucose pyrophosphorylase 9280626
1.6
e
0.1 129 6
64 CWP β-galactosidase 3641863
1.2 0.51 72 2
76 CWP NAD-dependent epimerase/dehydratase (UXS6) 15226950
6.1 < 0.01 109 4
BMC Plant Biology 2008, 8:52 />Page 6 of 13
(page number not for citation purposes)
88 CWP UDP-glucose 4-epimerase 12643850
1.1 0.84 60 2
101 CWP GDP-4-keto-6-deoxy-D-mannose-3,5-epimerase-4-
reductase
12324315
2.3 < 0.01 155 3
104 CWP dTDP-D-glucose 4,6-dehydratase-like 50253123
3 < 0.01 56 2
9 1C Met synthase 77556633
2 < 0.01 222 6
10 1C Met synthase 8439545
2.2 < 0.01 105 3
41 1C S-adenosyl-L-homocysteine hydrolase 1710838
1.6
e
0.1 174 5
53 1C serine hydroxymethyltransferase 11762130
2.2 0.02 129 4
60 1C Met adenosyltransferase 37051117
2.1 0.02 94 4
55 MemT GDP dissociation inhibitor 8439465
2 0.13 212 5
56 MemT GDP dissociation inhibitor 8439465
1.9 0.08 158 4
95 MemT K
+
channel β-subunit 15219795 8.6 0.01 132 4
102 MemT 34 kDa outer mitochondrial membrane porin-like protein 83283993
1.7 55 2
103 MemT 36kDa porin I 515358
3.9 < 0.01 104 4
5 C&S myosin heavy chain 108710464
2.5 0.05 46 2
6 C&S myosin heavy chain T00727
3.6 0.01 48 2
22 C&S dynamin central region 92891191
3.1 0.09 83 3
25 C&S dynamin-like 21593776
1 0.77 143 4
37 C&S β-tubulin 295851
1.8 0.06 161 6
52 C&S tubulin/FtsZ family, GTPase domain 62734655
1.7 0.06 367 12
69 C&S actin 32186910
3.1 0.01 281 8
70 C&S actin 15242516
1.5 0.21 459 12
4 P&AA elongation factor EF-2 6056373
2.5 0.02 40 3
7 P&AA ClpC protease 4105131
1.2
e
81 4
8 P&AA ClpC protease 18423214
1.7 0.06 286 11
11 P&AA HSP 90 1708314
1.7 0.01 312 10
20 P&AA HSP 70-3 38325815
1.9 0.08 404 11
21 P&AA HSP 70 62733235
1.7 0.11 612 13
23 P&AA HSP 70 22636
2 0.04 100 3
29 P&AA chaperonin CPN60-1 108706134
2.7 0.04 139 6
30 P&AA chaperonin CPN60-1 108706134
1.5 0.04 327 7
32 P&AA HSP 60 16221
2.1 0.02 140 4
54 P&AA eukaryotic elongation factor 1A 24371059
2.3 0.02 227 7
61 P&AA 26S protease regulatory subunit 1709798
2.1 < 0.01 85 3
62 P&AA translation initiation factor eIF-4A 475221
1.6 0.09 262 9
65 P&AA 26
S proteasome subunit P45 92870338 1.9 0.11 90 3
66 P&AA aminomethyltransferase 3334196
3.7 < 0.01 67 2
67 P&AA elongation factor-1 alpha 396134
1.2 0.5 54 3
72 P&AA glutamine synthetase 121341
1.7
e
0.26 119 4
84 P&AA P0 ribosomal protein 1143507
2.5 < 0.01 155 3
89 P&AA glutamate-ammonia ligase 99698
1.2
e
0.5 65 3
114 P&AA eukaryotic translation initiation factor 5A 8778393
20.04912
26 misc nucleolar protein NOP5 108708132
1.4 0.37 47 2
33 misc ferric leghemoglobin reductase 5823556
1.6 0.2 124 4
34 misc calreticulin 3288109
1 0.9 78 3
85 misc peroxidase 1389835
2.4 0.03 214 7
89 misc type IIIa membrane protein cp-wap13 2218152
58 3
97 misc annexin 1429207
2.2 0.01 146 4
98 misc annexin 1429207
4.1 0.03 71 2
100 misc enoyl-ACP reductase 2204236
2.1 0.01 44 2
107 misc protein kinase C inhibitor 20062
2.8 < 0.01 97 5
108 misc 14-3-3 protein 695767
2.7 0.01 44 3
109 misc guanine nucleotide regulatory protein 395072
1.5 0.31 64 2
110 misc NAD(P)H dependent 6'-deoxychalcone synthase 18728
1.1 0.82 56 3
111 misc inorganic pyrophosphatase 48927683
2.8 0.02 148 3
112 misc maturase K 33332553
3.4 0.01 55 2
113 misc CBS (cystathionine β-synthase) domain-containing 15238284
1.6 0.1 92 2
a) Functional category: ATPases (ATP); Cell wall polysaccharide metabolism (CWP); Cytoskeleton and secretion (C&S); Membrane transport
(MemT); Miscellaneous (misc); One-carbon metabolism (1C); Primary carbon and energy metabolism (C&E); Protein and amino acid metabolism
(P&AA). Only the highest scoring protein for each spot is categorized.
b) Fold enrichment in fibre tissues or non-fibre tissues as compared to the other tissue type, expressed as linear ratio of mean signal intensities.
c) P-value for a t-test of significant differences in mean signal intensities between fibre and non-fibre tissues.
d) Peptide count, i.e. the number of peptides per spot that match the Genbank ID shown.
e) Spots in which multiple proteins were identified. The intensity ratios shown may be due to differences in abundance of more than one protein.
Protein identities are sorted by functional category, in the order in which each category is presented in the text, and then alphabetically within each
functional category. Additional data (including peptide sequences) is provided in Additional File 1.
Table 1: Protein identities based on peptide matches to Genbank protein databases (Continued)
BMC Plant Biology 2008, 8:52 />Page 7 of 13
(page number not for citation purposes)
and might therefore be active in secondary wall-specific
processes in developing fibres [17,18].
Cell wall and polysaccharide metabolism
Cell walls consist of many types of polymers, including
cellulose, hemicellulose, and pectins. However, with the
possible exception of an NAD-dependent epimerase/
dehydratase with similarity to UDP-xylose synthases
(#76, 6.1×), and GDP-4-keto-6-deoxy-D-mannose-3,5-
epimerase-4-reductase (GME, #101, 2.3×) almost all of
the fibre-enriched, cell wall-related enzymes we identified
were most likely associated with the metabolism of pec-
tin-like substances. For example, we identified proteins
from six spots as β-galactosidases. Five of these (#12–#16)
were co-located in a charge train and the sixth (#64) was
an isolated spot of lower apparent molecular weight. The
five spots in the charge train were significantly more
intense in fibres (5.4–9.3×), while the lower molecular
weight spot was nearly similar in abundance in both types
of tissues (1.15×). Within the charge train, peptides from
three spots aligned with a chickpea β-galactosidase as the
highest scoring match. This chickpea β-galactosidase has
previously demonstrated exo- and endo- cleavage activity
towards the side-chains of pectins and is found in elongat-
ing hypocotyls [19,20]. In developing flax fibres, the dep-
osition of a rhamnogalactan-type pectin consisting of 55–
85% galactose is known to precede establishment of the
crystalline, cellulosic fibrils that characterize the mature
secondary wall [6]. Because the galactose residues of
rhamnogalactans are one of the putative substrates for β-
galactosidase, we speculate that the abundance of this
enzyme in developing fibres is evidence of an important
role for it in remodeling, removing, or recycling of
galactans as part a dynamic process of cell wall deposi-
tion. However, it is also possible that the β-galactosidase
we detected hydrolyzes other galactosyl bonds, such as
those that decorate arabinogalactan proteins [21]. Finally,
the appearance of the β-galactosidase spots in a train
along the axis of the first dimension separation of our
electrophoretic gels is consistent with extensive post-
translational modification of this abundant protein.
In addition to β-galactosidase, we also identified other
spots representing one or more enzymes with possible
roles in the metabolism of pectic polysaccharides. Three
spots (#18, 4.1×; #19, 6.6×; #104, 3.0×) were more
enriched in fibres as compared to the non-fibre fraction
and share homology with UDP-rhamnose synthase.
Because these enzymes would normally be expected to
contribute to the growth of rhamnogalactans, it is interest-
ing to observe their enrichment in the same cells in which
β-galactosidase might hydrolyze galactosidic bonds
within these polymers. The potential co-existence of both
catabolic and anabolic processes of galactan metabolism
is consistent with a rapid turnover of these polymers dur-
ing cell wall deposition, although the existence of the
inferred enzymatic activities must still be confirmed
experimentally.
One-carbon metabolism
Four enzymes associated with one-carbon (1C) metabo-
lism were identified among the fibre-enriched protein
spots in our study. Three of these: methionine synthase
(#9, #10; 2.0×, 2.2× respectively), methionine adenosyl-
transferase (#60; 2.1×), and adenosylhomocysteinase
(#41; 1.6×) are components of the S-adenosyl methionine
(SAM) cycle, while the remaining protein, serine
hydroxymethyltransferase (#53; 2.2×), catalyzes the trans-
fer of carbon into the SAM cycle, via folate. Because the
cumulative function of these enzymes is to provide acti-
vated methyl groups for transfer to acceptors, the identity
of the major methyl transferases and their substrates in
fibres is an obvious question. In plants, potential accep-
tors of activated methyl groups include a wide variety of
molecules, among them components of pectin or lignin
[22]. Because the amount of lignin present in flax fibres is
low in comparison to other types of schlerenchyma, par-
Functional categorization of fibre-enriched proteinsFigure 4
Functional categorization of fibre-enriched proteins.
All spots for which signal intensity was at least 1.5-fold
greater in fibres as compared to non-fibres, and for which
identity could be assigned by MS, were assigned to one of the
categories shown. The grey and black regions of each bar
show the portion of spots for which p > 0.05 and p ≤ 0.05,
respectively, in a t-test of the significance of differences in
intensity between fibre and non-fibre tissues. ATPases (ATP);
Cell wall polysaccharide metabolism (CWP); Cytoskeleton
and secretion (C&S); Membrane transport (MemT); Miscella-
neous (misc); One-carbon metabolism (1C); Primary carbon
and energy metabolism (C&E); Protein and amino acid
metabolism (P&AA).
BMC Plant Biology 2008, 8:52 />Page 8 of 13
(page number not for citation purposes)
Relative abundance of fibre-enriched proteins identified as enzymes in selected reactions of carbohydrate and one-carbon metabolismFigure 5
Relative abundance of fibre-enriched proteins identified as enzymes in selected reactions of carbohydrate and
one-carbon metabolism. Numbers following the symbol '#' are the unique spot identifiers used in Table 1 and throughout
the text. Values in boxes show the fold-enrichment (i.e. signal intensity in fibres/non-fibres). Grey and black filled boxes indi-
cate spots for which p > 0.05 and p ≤ 0.05, respectively, in a t-test of the significance of differences in intensity between fibre
and non-fibre tissues. No intensity ratio is shown for #41, because multiple proteins were identified within this spot. Pathways
shown are based on data from KEGG and AraCyc [37, 38]. Not all reactants or co-factors are shown. Abbreviations used in
names of substrates include fructose (Fru), galactose (Gal), glucose (Glc), glyceraldehyde-3-phosphate (G3P), homocysteine
(HCys), maltose (Mal), phosphoglycerate (PG), phosphoenolpyruvate (PEP), rhamnose (Rha), S-adenosyl homocysteine (SAH),
tetrahydrofolate (THF).
BMC Plant Biology 2008, 8:52 />Page 9 of 13
(page number not for citation purposes)
ticularly at the early stage of cell wall development associ-
ated with the snap point, [23,24], it seems unlikely that
lignin is the major sink for methyl flux through the SAM
cycle. Thus, pectin or other actively accumulating sub-
stances may be targets for SAM-mediated methylation in
developing fibres.
Membrane transport
Only a few proteins related to transport across mem-
branes were detected in our study. This may be due in part
to the difficulty of extracting and resolving certain mem-
brane-associated proteins. Nevertheless, we identified a K
+
channel β-subunit was highly enriched (#97; 8.6×) in
fibres, as well as two porins (#102, #102; 1.7×, 3.9×,
respectively). The biological significance of the porins is
unclear, however, increased expression of K
+
channels has
been previously correlated with sucrose uptake in devel-
oping cotton fibres. Thus the strong enrichment of K
+
channel proteins we observed may reflect a similar proc-
ess of the uptake of reduced carbon in flax fibres [25,26].
Cytoskeleton and secretion
Structural components of the cytoskeleton, as well as pro-
teins related to vesicle traffic, were also relatively more
abundant in fibre protein extracts as compared to sur-
rounding tissues. We observed relative enrichment of at
least 1.5-fold of actin (#69, #70) and tubulin (#37) in
fibres. These proteins may be enriched in fibres, as com-
pared to cells of the non-fibre fraction, due in part to the
differences in architecture and surface/volume ratios of
these cells. Additionally, increased relative abundance of
cytoskeleton proteins in fibres undergoing cell wall thick-
ening may reflect the role of the cytoskeleton in deposi-
tion of cellulose and other cell wall components. An
active secretory system, which delivers non-cellulosic
polysaccharide components to the cell wall, is also
expected to be present in developing flax fibres; the
enrichment of myosin (#5, 2.5×; #6, 3.6×), dynamin-like
proteins (#22, 3.1×), and GDP-dissociation inhibitor
(#55, 2.0×; #56, 1.9×) in these cells is therefore consistent
with developmental processes presumed to be active in
the cells we sampled. We also note that other components
of the cytoskeleton mentioned in a structural context
above (i.e. actin and tubulin) may have additional func-
tions specifically related to secretion and other aspects of
secondary wall deposition [27-29].
Protein and amino acid metabolism
Enzymes related to protein metabolism (e.g. protein syn-
thesis and folding) were moderately enriched (1.5× –
2.7×) in fibres as compared to the non-fibre fraction. Two
translation initiation factors were more abundant in the
fibre sample: eIF-4A (#62, 1.6×) and eIF-5A (#114, 2.0×).
Proteins in the eIF-4A family form part of the ribosomal
machinery and are involved in binding and unwinding
mRNA for translation, while some eIF-5A isoform family
members have more diverse functions in cell division and
related processes [30]. A translational elongation factor
EF2 (#4, 2.5×) was also more abundant in fibres, while
spots containing EF1á were similarly abundant (#67,
1.2×) or 2.3× fold less abundant (#54) in fibres as com-
pared to the non-fibre fraction.
Heat shock proteins HSP60 (#29, 2.7×; #30, 1.5×; #32,
2.1×), HSP70 (#20, 1.9×; #21, 1.7×; #23, 2.0×), and
HSP90 (#11, 1.7×) were also enriched in fibres. These pro-
teins may function in the processes of cytosolic protein
folding and protein import into mitochondria and chlo-
roplasts, which are commonly associated with members
of the HSP60, HSP70, and HSP90 families [31]. Addition-
ally, because HSP70s have been shown to have specific
functions in cell wall development in yeast, we cannot
exclude the possibility that some of these proteins are
active at the plasma membrane during the deposition of
the flax fibre secondary wall [32,33].
Miscellaneous
Several of the proteins we identified could not be classi-
fied into any of the larger functional categories we have
already described. Eight of these proteins were enriched
by 1.5× (p ≤ 0.05) or more in fibres, and may accordingly
have specific roles in fibre development. These included
annexins (#97, 2.2×; #98, 4.1×), enoyl-ACP reductase
(#100, 2.1×), maturase K (#112, 3.4×), a 14-3-3 protein
(#108, 2.6×), peroxidase (#85, 2.4×), and a protein kinase
C inhibitor (#107, 2.8×). Among these, the enrichment of
annexin in developing fibres is particularly interesting,
given its previous association with cellulose synthase in
structural and proteomic studies of cotton fibres [16,34].
Comparison to transcriptomic analysis
The experimental approach used in the present study dif-
fers in many ways from our previously reported microar-
ray analysis of flax stems [8]. Importantly, in the previous
report, we did not dissect fibres away from other stem tis-
sues; rather we compared transcript abundance in stem
segments containing fibres at different stages of develop-
ment. Therefore, a global comparison of these datasets is
not warranted. Notwithstanding these limitations, we
noted that three carbohydrate-related enzymes were
detected both as proteins enriched in fibres from the snap-
point region of the stem, and previously as transcripts
expressed in the region of the stem containing the snap-
point, including β-galactosidase (#12–16, #64), fructoki-
nase (#93, #94), and GME (#101) (Table 1). In the tran-
scriptomic data, β-galactosidase and fructokinase were
significantly more abundant in the region of the snap-
point as compared to segments from nearer either the
apex or base of the stem, while GME showed highest tran-
script abundance in the apical-most segment, which may
BMC Plant Biology 2008, 8:52 />Page 10 of 13
(page number not for citation purposes)
be due to differences in the turnover of these various gene
products. On the other hand, our previous work also iden-
tified many other snap-point enriched transcripts that
were not detected as proteins in the previous study. These
include arabinogalactan proteins and lipid transfer pro-
teins that were further demonstrated by qRT-PCR to be
enriched specifically in the phloem tissues of the snap-
point, as compared to leaves or the xylem of stems. Dis-
crepancies between transcriptomic and proteomic analy-
ses have been previously documented by ourselves and
others, and are presumably due to differences in efficien-
cies of extraction and detection of various proteins,
among many other technical and biological factors [35].
For example, Bayer et al. specifically noted under repre-
sentation of AGPs and other cell wall proteins within their
proteomic analysis, due possibly to the high degree of gly-
cosylation of these proteins [12]. Thus, it appears likely
that a comprehensive description of gene expression
within developing flax fibres cannot be provided by either
transcript or protein profiling, alone, but instead the
results of many different experimental approaches must
be considered together.
Conclusion
We have described a differential proteomic profile of a
single plant cell type at a well-defined developmental
stage, during which secondary cell wall biogenesis is
occurring. The fibre-enriched proteins we identified are
consistent with the dynamic process of secondary wall
deposition previously suggested by histological and bio-
chemical analyses, and particularly the importance of
galactans and the secretory pathway in this process [6].
The apparent abundance of amylase suggests that starch
may be an unappreciated source of materials for cell wall
biogenesis. Furthermore, our observations confirm previ-
ous reports that correlate accumulation of proteins such
as annexins, and specific heat shock proteins with second-
ary cell wall deposition [6,16,33]. Together, the proteins
we have identified in this study provide a basis for better
understanding the unique properties of phloem fibre sec-
ondary cell walls, and define targets for detailed genetic
and biochemical analyses in future.
Methods
Plant material
Fibres (i.e. individual cells) and surrounding, non-fibre
cells of the cortex were isolated from the stems of Linum
usitatissimum L., var. Norlin. A total of 495 plants were
harvested from four independently grown populations.
Seeds were sown two per 10 cm pot and grown as previ-
ously described [8]. After 3 weeks of growth, the mean dis-
tance from the apex to snap-point was 5.9 cm, with mean
plant height of 19 cm. A 3 cm segment of stem, spanning
from 2 cm to 5 cm below the snap-point, was further dis-
sected to separate the individual fibres and surrounding
non-fibre cells of the cortex (i.e. "the non-fibre fraction",
consisting predominantly of parenchyma, sieve elements,
and companion cells, but excluding epidermis, xylem and
pith) for proteomic analysis. After dissection, fibres and
surrounding tissues were rinsed in deionized water, blot-
ted, then frozen in liquid nitrogen, and stored at -80°C.
Protein isolation from tissues
Tissues were ground to a powder in liquid nitrogen and
then further ground for one minute in 1 mL cold TCA/ace-
tone buffer (20 mM DTT, 10% trichloroacetic acid in cold
acetone). Homogenates were transferred with an addi-
tional 1 mL of buffer to microcentrifuge tubes and were
allowed to precipitate overnight at -20°C. After centrifu-
gation (13000 rpm, 10°C, 15 minutes), pellets were
rinsed once with 1 mL 20 mM DTT in acetone for 1 h at -
20°C, then pellets were left to dry at -20°C for 2 h, and
dissolved in 200 µL of urea/thiourea buffer (7 M urea, 2
M thiourea, 4% (w/v) CHAPS, 30 mM Tris-Cl) by vortex-
ing at room temperature for 30 minutes. The solution was
clarified by centrifugation (13000 rpm, 17°C, 5 minutes)
and supernatants were further processed by using the 2D
Clean-Up Kit (Amersham Biosciences). Precipitates were
re-dissolved in 60 µl of the urea/thiourea buffer, and con-
centrations of the protein samples were determined using
the 2D Quant Kit (Amersham Biosciences) and Nano-
Drop
®
ND-1000 spectrophotometer (NanoDrop Technol-
ogies) against a BSA standard curve.
Fluorescent labeling of proteins
Four independent pools of approximately 125 plants each
were grown in nominally identical conditions that were
spatially and temporally separated from each other. Pro-
teins were isolated separately from tissues dissected from
each pool of plants, to produce four paired protein sam-
ples from fibres and the non-fibre fraction, where each
pair of samples was biologically independent from every
other pair. We labeled each 30 µg protein sample (pH
adjusted to 8.5) with 240 pmol of Cy2, Cy3 or Cy5 fluo-
rescent dyes, using the CyDye™ DiGE fluors (minimal
dyes) labeling kit (Amersham Biosciences). Labeling reac-
tions were stopped by the addition of 1 µl of 10 mM lysine
to each tube, and after a further 10-minute incubation on
ice, the volume of each sample was doubled with the
addition of a sample buffer (7 M urea, 2 M thiourea, 2%
(v/v) ampholyte, 2% (w/v) DTT, 4% (w/v) CHAPS) to
ready the samples for IEF. Labeled samples were mixed
together as stated in Table 2 to create four analytical gels,
with each gel containing an internal standard and both
tissue samples. The internal standard is prepared by mix-
ing equal masses of protein extracts from fibre and non-
fibre fractions of each biologically independent harvest.
BMC Plant Biology 2008, 8:52 />Page 11 of 13
(page number not for citation purposes)
2DE of CyDye labeled protein mixtures
All subsequent handling and separation steps for 2DE
were conducted away from light. 24 cm, 3–10 NL Immo-
biline™ drystrips (Amersham Biosciences) were passively
re-hydated for 10 h in (8 M urea, 4% (w/v) CHAPS, 1%
(v/v) ampholytes 3–10, 13 mM DTT, trace bromophenol
blue). A total of 56 kVh at 20°C was used to focus the pro-
teins using an IPGphor™ II (Amersham Biosciences).
Paper wicks on the basic end were spiked with 13 mM
DTT and were changed three times during the run. Follow-
ing IEF, strips were equilibrated for SDS-PAGE separation
by gentle agitation for 15 minutes in 6 M urea, 50 mM tris-
Cl (pH 8.8), 30% (v/v) glycerol, 2% (w/v) SDS, trace
bromophenol blue plus 0.5% (w/v) DTT, followed by 15
minutes in the same solution with 4.5% (w/v) IAA instead
of DTT. After equilibration, the strips were sealed onto the
top edge of self-cast, large-format, 12.5% acrylamide gels
using sealing solution (1% low-melt agarose, trace
bromophenol blue in 1X running buffer). The four analyt-
ical gels were separated by molecular weight during SDS-
PAGE, simultaneously, using the Ettan™ Dalt six (Amer-
sham Biosciences). The gels were run at 2 W/gel for 30
minutes then 8 W/gel until the bromophenol blue dye
front just touched the end of the gels.
Imaging and analysis
Fluorescently labeled gels were imaged at 100 µm resolu-
tion with PMT voltage between 50000 and 63558 V.
DeCyder™ 6.5 (Amersham Biosciences) was used to
match, normalize, and statistically analyze spots. After in-
gel normalization using Differential In-gel Analysis
(DIA), the Biological Variation Analysis (BVA) module
was used for statistical analysis and normalization across
all analytical gels.
Spot-picking and tryptic digestion of proteins
Preparative gels, loaded with about 125 µg of protein,
were post-stained with Deep Purple™ total protein stain
(Amersham Biosciences) and spot-matched to the analyt-
ical gels. Gel spot excision and subsequent tryptic diges-
tion were conducted using an Ettan™ Spot-picker
(Amersham Biosciences) and ProteomeWorks™
MassPREP™ robotic handling station (Bio-Rad Laborato-
ries and Waters corporations), resulting in peptides in a
final extraction solution of 2% ACN, 0.1% formic acid in
H
2
0.
Protein identification
LC MS/MS analysis was performed using an online 1100
series XCT Ion trap (Agilent Technologies). The autosam-
pler injected 18 µL of each sample onto an enrichment
column (Zorbax 300SB-C18 5 µm 5 × 0.3 mm) that con-
nected to a second column (Zorbax 300SB-C18 5 µm 150
× 0.3 mm) in a peptide-separation gradient that started at
85% solvent A (0.1% formic acid in H
2
O) and ended at
55% solvent B (0.1% formic acid, 5% H
2
O in ACN) over
a 42 minute span. This was followed by 10 minutes of
90% solvent B to cleanse the columns before returning to
97% solvent A for the next sample. The MS ran a 300–
2200 m/z scan followed by MS/MS analysis of the most
intense ions. Raw spectral data was processed into Mascot
Generic File (.mgf) format using the default method in the
ChemStation Data Analysis module and ion searches were
completed in MASCOT [36] with the search parameters
of: peptide tolerance of 2 Da, parent ion tolerance of 0.8
m/z, ion charge of +1, +2 and +3.
List of abbreviations
1C: one-carbon; DiGE: differential gel electrophoresis;
dTDP: thymine diphosphate deoxynucleotide; EF: transla-
tional elongation factor; eIF: translational initiation fac-
tor; GDP: guanine diphosphate; SAM: S-adenosyl
methionine; UDP: uridine diphosphate.
Authors' contributions
NSCH designed and conducted all experiments, including
operation of the mass spectrometer and interpretation of
mass spectra, and wrote the original draft of this manu-
script. MKD supervised all research, and contributed to
writing and editing of the manuscript.
Table 2: Experimental design relative to labeling and sample loading of analytical gels.
gel Cy2 labeled Cy3 labeled Cy5 labeled
1 internal standard #1 30 µg fibre sample #1 30 µg non-fibre sample #1 30 µg
2 internal standard #2 30 µg fibre sample #2 30 µg non-fibre sample #2 30 µg
3 internal standard #3 30 µg non-fibre sample #3 30 µg fibre sample #3 30 µg
4 internal standard #4 30 µg non-fibre sample #4 30 µg fibre sample #4 30 µg
Note: each gel contains proteins from a unique pool (#1–#4) of independently grown plants. The Cy2-labeled internal standard is a mixture of equal
masses of proteins from fibre and non-fibre samples.
BMC Plant Biology 2008, 8:52 />Page 12 of 13
(page number not for citation purposes)
Additional material
Acknowledgements
We thank Anthony Cornish, Ana Lopez-Campistrous, and Paul Semchuk
for technical advice. This work was funded by a Discovery Grant from
NSERC (Natural Sciences and Engineering Research Council), an Alberta
Ingenuity New Faculty Grant, and an Alberta Innovation and Science Accel-
eration Grant.
References
1. McCorriston J: The fiber revolution: Textile extensification,
alienation, and social stratification in ancient Mesopotamia.
Current Anthropology 1997, 38(4):517-549.
2. Vanzeist W, Bakkerheeres JAH: Evidence for Linseed Cultivation
before 6000 Bc. Journal of Archaeological Science 1975,
2(3):215-219.
3. Mohanty AK, Misra M, Hinrichsen G: Biofibres, biodegradable
polymers and biocomposites: An overview. Macromolecular
Materials and Engineering 2000, 276(3-4):1-24.
4. Esau K: Vascular differentiation in the vegetative shoot of
Linum III. - The origin of the bast fibers. American Journal of Bot-
any 1943, 30(8):579-586.
5. Lev-Yadun S: Intrusive growth - the plant analog of dendrite
and axon growth in animals. New Phytologist 2001,
150(3):508-512.
6. Gorshkova TA, Morvan C: Secondary cell-wall assembly in flax
phloem fibres: role of galactans. Planta 2006, 223(2):149-158.
7. Gorshkova TA, Sal'nikova VV, Chemikosova SB, Ageeva MV, Pav-
lencheva NV, van Dam JEG: The snap point: a transition point in
Linum usitatissimum bast fiber development. Industrial Crops
and Products 2003, 18(3):213-221.
8. Roach M, Deyholos M: Microarray analysis of flax ( Linum usi-
tatissimum L.) stems identifies transcripts enriched in fibre-
bearing phloem tissues. Molecular Genetics and Genomics 2007,
278(2):149-165.
9. Day A, Addi M, Kim W, David H, Bert F, Mesnage P, Rolando C,
Chabbert B, Neutelings G, Hawkins S: ESTs from the fibre-bear-
ing stem tissues of flax (Linum usitatissimum L.): Expression
analyses of sequences related to cell wall development. Plant
Biology 2005, 7(1):23-32.
10. Mooney BP, Miernyk JA, Greenlief CM, Thelen JJ: Using quantita-
tive proteomics of Arabidopsis roots and leaves to predict
metabolic activity. Physiologia Plantarum 2006, 128(2):237-250.
11. Tian Q, Stepaniants SB, Mao M, Weng L, Feetham MC, Doyle MJ, Yi
EC, Dai HY, Thorsson V, Eng J, Goodlett D, Berger JP, Gunter B, Lin-
seley PS, Stoughton RB, Aebersold R, Collins SJ, Hanlon WA, Hood
LE: Integrated genomic and proteomic analyses of gene
expression in mammalian cells. Molecular & Cellular Proteomics
2004, 3(10):960-969.
12. Bayer EM, Bottrill AR, Walshaw J, Vigouroux M, Naldrett MJ, Thomas
CL, Maule AJ: Arabidopsis cell wall proteome defined using
multidimensional protein identification technology. Proteom-
ics 2006, 6(1):301-311.
13. Blee KA, Wheatley ER, Bonham VA, Mitchell GP, Robertson D, Slabas
AR, Burrell MM, Wojtaszek P, Bolwell GP: Proteomic analysis
reveals a novel set of cell wall proteins in a transformed
tobacco cell culture that synthesises secondary walls as
determined by biochemical and morphological parameters.
Planta 2001, 212:404-415.
14. Vander Mijnsbrugge K, Meyermans H, Van Montagu M, Bauw G, Boer-
jan W: Wood formation in poplar: identification, characteri-
zation, and seasonal variation of xylem proteins. Planta 2000,
210(4):589-598.
15. Watson BS, Lei ZT, Dixon RA, Sumner LW: Proteomics of Medi-
cago sativa cell walls. Phytochemistry 2004, 65(12):1709-1720.
16. Yao Y, Yang YW, Liu JY: An efficient protein preparation for
proteomic analysis of developing cotton fibers by 2-DE. Elec-
trophoresis 2006, 27(22):4559-4569.
17. Schumacher K: Endomembrane proton pumps: connecting
membrane and vesicle transport. Current Opinion in Plant Biology
2006, 9(6):595-600.
18. Haas TJ, Sliwinski MK, Martinez DE, Preuss M, Ebine K, Ueda T,
Nielsen E, Odorizzi G, Otegui MS: The Arabidopsis AAA ATPase
SKD1 is involved in multivesicular endosome function and
interacts with its positive regulator LYST-INTERACTING
PROTEIN5. Plant Cell 2007, 19(4):1295-1312.
19. Esteban R, Labrador E, Dopico B: A family of beta-galactosidase
cDNAs related to development of vegetative tissue in Cicer
arietinum. Plant Science 2005, 168(2):457-466.
20. Esteban R, Dopico B, Munoz FJ, Romo S, Martin I, Labrador E: Clon-
ing of a Cicer arietinum beta-galactosidase with pectin-
degrading function. Plant and Cell Physiology 2003, 44(7):718-725.
21. Kotake T, Dina S, Konishi T, Kaneko S, Igarashi K, Samejima M,
Watanabe Y, Kimura K, Tsumuraya Y: Molecular Cloning of a
{beta}-Galactosidase from Radish That Specifically Hydro-
lyzes {beta}-(1->3)- and {beta}-(1->6)-Galactosyl Residues of
Arabinogalactan Protein. Plant Physiol 2005, 138(3):1563-1576.
22. Moffatt BA, Weretilnyk EA: Sustaining S-adenosyl-l-methionine-
dependent methyltransferase activity in plant cells. Physiologia
Plantarum 2001, 113(4):435-442.
23. Day A, Ruel K, Neutelings G, Cronier D, David H, Hawkins S, Chab-
bert B: Lignification in the flax stem: evidence for an unusual
lignin in bast fibers. Planta 2005, 222(2):234-245.
24. Gorshkova TA, Salnikov VV, Pogodina NM, Chemikosova SB, Yablok-
ova EV, Ulanov AV, Ageeva MV, Van Dam JEG, Lozovaya VV: Com-
position and distribution of cell wall phenolic compounds in
flax (Linum usitatissimum L.) stem tissues. Annals of Botany
2000, 85(4):477-486.
25. Ruan YL: Goldacre paper: Rapid cell expansion and cellulose
synthesis regulated by plasmodesmata and sugar: insights
from the single-celled cotton fibre. Functional Plant Biology 2007,
34(1):1-10.
26. Ruan YL, Llewellyn DJ, Furbank RT: The control of single-celled
cotton fiber elongation by developmentally reversible gating
of plasmodesmata and coordinated expression of sucrose
and K+ transporters and expansin. Plant Cell 2001, 13(1):47-60.
27. Boutte Y, Vernhettes S, Satiat-Jeunemaitre B: Involvement of the
cytoskeleton in the secretory pathway and plasma mem-
brane organization of higher plant cells. Cell Biology International
2007, 31:649-654.
28. Oda Y, Hasezawa S: Cytoskeletal organization during xylem
cell differentiation. Journal of Plant Research 2006, 119:167-177.
29. Roberts AW, Frost AO, Roberts EM, Haigler CH: Roles of micro-
tubules and cellulose microfibril assembly in the localization
of secondary-cell-wall deposition in developing tracheary
elements. Protoplasma 2004, 224:217-229.
30. Thompson JE, Hopkins MT, Taylor C, Wang TW: Regulation of
senescence by eukaryotic translation initiation factor 5A:
implications for plant growth and development. Trends in Plant
Science 2004, 9(4):174-179.
31. Young JC, Agashe VR, Siegers K, Hartl FU: Pathways of chaper-
one-mediated protein folding in the cytosol. Nature Reviews
Molecular Cell Biology 2004, 5(10):781-791.
32. Lopez-Ribot JL, Chaffin WL: Members of the Hsp70 family of
proteins in the cell wall of Saccharomyces cerevisiae. J Bacte-
riol 1996, 178(15):4724-4726.
33. Nombela C, Gil C, Chaffin WLJ: Non-conventional protein secre-
tionin yeast. Trends in Microbiology 2006, 14(1):15-21.
34. Hofmann A, Delmer DP, Wlodawer A: The crystal structure of
annexin Gh1 from Gossypium hirsutum reveals an unusual
S-3 cluster - Implications for cellulose synthase complex for-
mation and oxidative stress response. European Journal of Bio-
chemistry 2003, 270(12):2557-2564.
Additional file 1
Additional information (e.g. peptide sequences; M
r
, pI of database
matches, PFAM domains) on spot identifications that was not otherwise
conveyed in Table 1.
Click here for file
[ />2229-8-52-S1.xls]
Publish with BioMed Central and every
scientist can read your work free of charge
"BioMed Central will be the most significant development for
disseminating the results of biomedical research in our lifetime."
Sir Paul Nurse, Cancer Research UK
Your research papers will be:
available free of charge to the entire biomedical community
peer reviewed and published immediately upon acceptance
cited in PubMed and archived on PubMed Central
yours — you keep the copyright
Submit your manuscript here:
/>BioMedcentral
BMC Plant Biology 2008, 8:52 />Page 13 of 13
(page number not for citation purposes)
35. Jiang Y, Yang B, Harris NS, Deyholos MK: Comparative proteomic
analysis of NaCl stress-responsive proteins in Arabidopsis
roots. Journal of Experimental Botany 2007, 58:3591-3607.
36. [
]
37. Zhang PF, Foerster H, Tissier CP, Mueller L, Paley S, Karp PD, Rhee
SY: MetaCyc and AraCyc. Metabolic pathway databases for
plant research. Plant Physiology 2005, 138(1):27-37.
38. Kanehisa M, Goto S: KEGG: Kyoto Encyclopedia of Genes and
Genomes. Nucleic Acids Research 2000, 28(1):27-30.