GIS for Environmental Decision Making - Chapter 14 pot
Bạn đang xem bản rút gọn của tài liệu. Xem và tải ngay bản đầy đủ của tài liệu tại đây (1.03 MB, 13 trang )
227
CHAPTER 14
Visualization Techniques to Support Planning of
Renewable Energy Developments
D. Miller, J. Morrice, A. Coleby and P. Messager
14.1 INTRODUCTION
The European Union (EU), through Directives, sets a context for much of the
implementation of environmental policies in member states in Europe. These are
translated into national initiatives, and ‘landscape’ is one topic that cuts across a
number of policy boundaries. Relevant ‘horizontal’ measures at the European
Community scale have included the Programme of Policy and Action in relation to
Environment and Sustainable Development
1
and the Sixth Environment Action
Programme
2
. Both of these have involved landscape protection and management as
global means of ensuring that wider environmental goals are achieved.
Public policy has also been influenced by government commitments to the
Aarhus Declaration
3
on public participation and access to environmental
information. Although the terms used by different organizations may vary between
‘engagement’, ‘involvement’, ‘consultation’ and ‘awareness raising’, they all echo
the aspirations of greater public participation in decision-making, as outlined under
the Aarhus Declaration and also built into the European Landscape Convention
4
.
There are a number of techniques that can be used to involve communities in
direct decision-making. These include ‘Planning For Real’, design days and
Community Planning Weekends
5
. Planning for Real has been used since the late
1970s, giving local people a ‘voice’ and professionals a clear idea of local people’s
needs to bring about an improvement to their neighborhood or community
6
. It has
also been recognied that engagement need not be undertaken only when there is a
dispute to be resolved, and that raising awareness and discussing topics with a wide
audience can be undertaken over a period of time to develop a relationship between
stakeholders in a geographic area, or associated with a particular theme
7
. In
Scotland, the Scottish Executive has published plans for increased community
involvement in the planning process, with specific reference made to the potential
of 3D modelling in ‘… engaging communities and assisting planners and
Councillors to visualise and assess the visual impact of development proposals’
8
,
reflecting the importance of the prospective visual impacts of changes to public
audiences and the potential of visual media for communication to different types of
stakeholders.
© 2008 by Taylor & Francis Group, LLC
228 GIS for environmental decision-making
With respect to the development of wind turbine sites, there has been a great
deal of variation in the way that the visual impacts of such developments are
assessed, which has led to the development of guidelines on recommended practice
for agencies such as Scottish Natural Heritage
9
. According to Lange and Bishop
10
,
being able to visually represent the existing real world as well as potential
alterations is essential for landscape planners to express and communicate their
thinking to the wider public. Nevertheless, although 3D models viewed on desktop
computers and 3D immersive virtual reality (VR) are increasingly used, Piekarski
and Thomas
11
suggest that they lack the ability to provide the planner with a first
person perspective. More broadly, Appleton and Lovett
12
and MacFarlane et al.
13
argue that there is a lack of research on audience perception and understanding of
visualization tools, and that these issues require addressing if such approaches are
to make significant contributions towards wider public involvement in
environmental decision-making.
This chapter describes the development of one protocol for the use of VR tools
to engage members of the public in issues related to the design and layout of wind
turbine developments. The aim was to assess stakeholder feedback on the strengths
and weaknesses of using VR tools in environmental decision-making. To this end,
a hypothetical model of a wind turbine development was developed for a site in
north-east Scotland, in the vicinity of the town of Huntly. The model was used in a
VR facility (the ‘Virtual Landscape Theatre’, VLT) at an event in Huntly to explore
the use of such tools in an environment where a real planning proposal was being
considered, but not addressing that proposal specifically. Interviews of participants
were carried out to assess the extent to which such tools could be used in practice.
14.2 METHODS
14.2.1 Virtual Reality Environment
The VLT was used as a medium for knowledge exchange between stakeholders
in relation to the layout of a proposed wind turbine development. The VLT
comprises a curved screen (~ 6 m x 2.2 m high), 160º in curvature, that is portable
and designed for use in local community venues. It can host a maximum of 15
people, and is equipped with a handset-based polling system to enable capture of
audience opinion on the landscapes and changes shown. Three high specification
PCs are linked by a local area network, each one of which drives a 3DP X25i data
projector, through which the geometry of the projected images is warped to fit the
screen. Calibration of the imagery produces a ‘seamless’ display of the landscape
model on the screen.
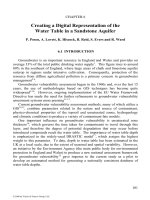
Figure 14.1 shows the VLT from a view behind the control PC and navigator.
The audience are being taken through a model of the landscape, along a road from
which turbines are hidden from view in this image.
© 2008 by Taylor & Francis Group, LLC
Visualization to support wind energy planning 229
Figure 14.1 Virtual reality facility, showing screen and data projectors.
14.2.2 Model Creation
14.2.2.1 Landscape Model
The prototype model was created in ERDAS IMAGINE VGIS
14
software.
Input data came from the Ordnance Survey 1:10,000 Digital Terrain Model
(DTM)
15
, with ground textures obtained from color orthophotography (flown in
2000 at a 0.25 m resolution) supplied by the Forestry Commission. To this
topographic background, two types of surface feature were added: ‘billboard’
images (e.g., of trees) and full 3D models
16
. The 3D models of specific features
were obtained from libraries or created using suitable design packages (e.g.,
Creator
17
, 3D Studio
18
). That for the wind turbine was based upon specifications of
a Vestas V90 2MW and allowed the turbine blades to be shown as moving when
the model was converted into the Openflight format for use in the VEGAPrime
display environment
19
.
14.2.2.2 Wind Turbine Siting
The wind turbines were located on a hill where there was some previous interest
in the development of a wind farm, but no proposal had been submitted. This site
was chosen on the basis that it was credible, technically feasible for development,
but not that of a real proposal. Such a site was used so that the opinions expressed
and choices made related as much as possible to the model presented rather than
any real proposal. This distinction was also stressed to audiences in the
introductions to the event.
© 2008 by Taylor & Francis Group, LLC
230 GIS for environmental decision-making
14.2.3 Event Operation
The assessment took place as part of a Landscape Research Week, the venue for
which was the public hall in the town of Huntly, north-east Scotland. In testing the
role of VR tools, a number of variables could have been considered with respect to
wind farm characteristics. These included the number of turbines, their height, the
spatial layout and factors such as color and design. Evidence from wind farm
developers and local authorities suggested that the factor which is most often
changed during the period of consultation and planning is the number of turbines
20
.
This factor was also identified by Bishop and Miller
21
as that which had the most
significant influence on viewer opinion concerning the perceived impact of a wind
farm.
The approach used in the literature on preference surveys suggested some form
of conjoint analysis in which alternative images with different numbers of turbines
were shown, possibly in different configurations. However, to enable a more direct
input to the process of selection, a procedure was devised which gave participants
the opportunity to influence the size of the hypothetical wind farm by voting on the
removal of turbines. This provided:
1. A means of identifying relationships between opinions expressed and the
choice of turbines (if any) for removal;
2. A mechanism for participant selection of turbine numbers;
3. A method of assessing participant reactions to the functionality of the VR
environment.
Displays involved a presenter and a second person who navigated around the
model. The sequence of activities was as follows:
1. Introductory slides to provide a context for the event
2. An explanation of the theater and the presentation that was to follow
3. A ‘walk-through’ of the model area
4. Introduction of the windfarm (containing seven turbines) to the model
5. A ‘walk’ to beside the windfarm
6. Change in height of the viewer to that of the turbine hub
7. A ‘fly-through’, away from the turbines towards a vantage point to the
east
8. A ‘fly-through’ to a viewpoint on the agricultural land in the middle of the
model, looking towards the windfarm
9. Audience selection of viewpoints
10. A change in the time of day and year
11. Alterations in the viewing distance, illustrating the effects of mist and fog
12. Changes in the number of turbines
© 2008 by Taylor & Francis Group, LLC
Visualization to support wind energy planning 231
The last of these activities used the voting handsets in which participants could
select the turbine that should be removed, if any. The options provided were a
number from 1 to 7 for the turbine identification and 8 for ‘none’. In the results
discussed here the rounds of voting took place during one afternoon with 52
participants, all initially voting in small groups on the choice of one turbine which
would reduce the numbers from seven to six, or leave the status quo. Once the
overall result of this round was known the selected turbine was removed from the
visualization by the VR operator and the participants were asked to vote again on a
reduction from six to five. When not involved in the voting, participants could visit
other parts of the exhibition. This process continued until no turbines remained.
Keywords and comments were recorded by participants to best describe the view
after each round of voting. Following the formal presentation, members of the
audience were invited to try navigating through the landscape themselves, or to
nominate a location from which they wished to see the wind farm. Finally,
feedback from the participants in the event was collected through further voting and
semi-structured interviews.
14.3 RESULTS
14.3.1 Turbine Siting and Numbers
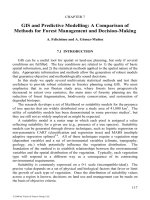
Figure 14.2a shows a view of the wind farm with seven turbines and Figures
14.2b-14.2h illustrate how this changed as the turbines were gradually removed.
Table 14.1 summarizes the voting results and reveals that in no round was there a
majority of participants in favor of a single course of action (e.g., removal of a
particular turbine, or for no change), so the action taken was determined by the
option selected by the greatest number of people.
Another feature of the results was the diversity of choices, with the maximum
level of agreement among participants occurring in the final round when 41.1%
voted for the removal of Turbine 3 in Round 6. The option of ‘no change’ in the
number of turbines attracted 10-20% of votes in the first five rounds and just over
30% in the final one. There were always a larger number of participants in favor of
removing a particular turbine so the ‘no change’ option was never the most popular
one. Some rounds in Table 14.1 have fewer than 52 total votes due to either a
failure to use the handsets correctly, or a decision not to vote.
Table 14.2 summarizes the keywords and comments made after each round of
voting. These suggest that most of the participants felt that the initial number of
turbines proposed was too great, with negative impressions of the effect of such a
development on the skyline. A reduction of one or two turbines did not seem to
assuage the nature of the concerns voiced (i.e., the number and the perceived level
of intrusion). The removal of an additional turbine (to leave four) resulted in a
reduction of their density on the horizon and, due to the choice of turbine to
remove, a lessening in the visual overlap of the rotating blades.
© 2008 by Taylor & Francis Group, LLC
232 GIS for environmental decision-making
(a) (b)
(c) (d)
(e) (f)
(g) (h)
Figure 14.2 Results from the afternoon session, showing which turbines were left after the progressive
removal of the wind turbines: (a) 7 turbines, (b) 6 turbines, (c) 5 turbines, (d) 4 turbines, (e) 3 turbines,
(f) 2 turbines, (g) 1 turbine, (h) no turbines.
© 2008 by Taylor & Francis Group, LLC
Visualization to support wind energy planning 233
Table 14.1 Votes cast for either the removal of a particular turbine, or no change, in each round
Turbine Number No Change
Voting
Round
Number
of
Turbines
1 2 3 4 5 6 7
Number
of Votes
% of
Votes
Total
1
7 11 4 4 7 7 3 5 8 16.3 49
2
6 0 8 5 14 10 4 4 6 11.7 51
3
5 0 13 5 0 10 6 7 8 16.3 49
4
4 0 0 10 0 16 6 11 9 17.3 52
5
3 0 0 15 0 0 9 19 7 14.0 50
6
2 0 0 21 0 0 14 0 16 31.4 51
Note: The turbine identifier numbers above are based on map positions and do not correspond to a
simple left to right sequence in Figure 14.2.
Table 14.2 Examples of keywords or comments made after each round of voting
Number of
Turbines Keyword/Comment
7 Too many, intrusive, spoils the view. Stark on skyline.
6 Six are much the same as seven. Need to remove more to change view. Could
now rearrange the turbines. Don't want wind turbines of any number.
5 Start to see a change in view but only slightly, still too tall on the horizon.
4 Four is a good number visually. Less cluttered view. Would developers really
want to have so few turbines?
3 Barely visible, could blend in. Will birds be able to avoid them?
2 Hardly noticeable and better for the view. Are two on their own a realistic
development?
1 One is practically invisible, if turbines could be separated from the view like
this who would notice them? The massive white turbines nowadays would be
more visible than that.
The comments expressed following a reduction to three turbines suggest that
the level of visual impact was now perceived as lower. A separate impact factor
(i.e., effects on bird populations) was also mentioned. With the final two stages
there was little negative comment on the number of turbines, but some questioning
regarding the viability of such a proposal and one expression of skepticism
regarding the visual impression being conveyed with the model.
© 2008 by Taylor & Francis Group, LLC
234 GIS for environmental decision-making
14.3.2 Functionality of Media and Model
Additional votes and semi-structured interviews were undertaken to obtain
feedback on the experience of using the VLT. Participants were asked to rate the
effectiveness of the virtual environment on a scale from 1 (low) to 5 (high) with
respect to different aspects of functionality and provide any comments they thought
were relevant. Table 14.3 summarizes the comments and effectiveness scores
(from the sample of 52 people) for six functions.
Table 14.3 Summary of comments and effectiveness scores regarding VLT functionality
Functionality Keyword/Comment Mean Score Variance
Selection of viewpoint
by participant
Can gain impression from
different viewpoints. I like the
test of view from my window.
Not realistic from my
viewpoint.
3.90 0.56
Movement through
the model
Feeling of movement. Would
react differently in the real
world.
4.02 0.49
Movement within the
model
Sense of turbine movement is
calming. Can speed of rotation
vary? Only turbines are
moving. Can noise be
represented in the model?
3.63 0.55
Changing time of day
and season
Didn’t realize effects of sun.
Too dark in December view.
Running through the day in a
minute was excellent.
4.15 0.64
Changing atmospheric
conditions
Big difference in number
visible. What about snow and
rain? Glad you don’t assume it
is always clear and sunny.
4.31 0.61
Changing number of
turbines
Helpful to change layout as
well as numbers. Can we add
turbines? Surprising difference
once 2 or 3 removed.
4.25 0.43
The rating of the ability to select viewpoints produced a mean score of 3.90.
This was relatively low compared to most the other functions, although recorded
comments implied that there was a desire to be able to select viewpoints. Further
feedback from the questionnaires suggested that this function provided a degree of
© 2008 by Taylor & Francis Group, LLC
Visualization to support wind energy planning 235
reassurance that the views were not pre-selected to give impressions of minimal
visual impact.
Participants commented that the VR experience was preferable to seeing
landscape futures on a flat plan such as maps, and that movement ‘through’ the
model contributed directly to that experience, with a score of 4.02. However,
views were also expressed that navigation speeds which were ‘inappropriately
high’ to be credibly walking or driving would detract from the quality of the
experience and reduce a realistic impression of the landscape.
Movement within the model was the function which scored lowest amongst the
respondents (3.63). The importance of including moving turbine blades was
highlighted in discussion, but the lack of movement in other elements (e.g.,
vehicles or animals) was also mentioned. The comparatively low score may also
reflect some other topics raised in discussion, including the variability in turbine
blade rotation due to changes in wind speed and associated issues of noise and bird
strikes. None of these issues were represented in any way and this could have
impacted upon expectations.
The most dramatic changes in view came with alterations in atmospheric
conditions (levels of fog) and in the time of day or season displayed. Mean scores
of 4.15 (time of day/year) and 4.31 (atmospheric conditions) suggest that a high
value was attached to these aspects of functionality. By dynamically changing the
scene time of day or year (season), the effects could be emphasized and this may
have reinforced the strength of responses, with several discussion points relating to
the differences in forelit and backlit turbines. Participants were generally surprised
at how much these changes made a difference to visibility, with those that were
ambivalent to the presence of turbines reacting most positively, whereas those who
were against turbine construction doubted that they would disappear from view.
Changing turbine numbers was the function which received the highest mean
score (4.25) and the lowest variance (0.43). Participants had a direct input into this
activity, and so the score may reflect the effectiveness of those interactions. The
supporting remarks also suggest that this was the most valued function. The
principal criticism of the process adopted was a lack of voting on changes in layout
or increasing the number of turbines. These aspects of change are being explored
in other ongoing surveys not reported here.
14.4 DISCUSSION
Feedback on the opportunity for direct input to the modification of the model of
the hypothetical windfarm supports the expressed enthusiasm for being provided
with an opportunity and mechanism. It is recognized that there may have been an
element of ‘fun’ involved, and that the hypothetical task of selecting turbines for
removal from the landscape might not have attracted the same level of critical
consideration as a real windfarm proposal could have done. However, the
© 2008 by Taylor & Francis Group, LLC
236 GIS for environmental decision-making
procedure was shown to work, and feedback from local authority representatives
indicated that discussions over real windfarm cases often focused on the removal of
individual turbines. The identification of such turbines was often the task of
consultants to the developer or local authorities and, therefore, a means of gaining
wider public input to the discussion appeared to be welcomed.
As a tool for assessing change, the approach described appears to have been
received positively. Feedback from participants suggests that the opportunity for
direct input to the discussion, and evidence of changes being made which could be
attributed to that input, helped to enhance credibility. Anecdotal evidence also
indicated that transparency in the decision-making process led to support for the
outcome, and recognized the rights of others to a say. However, there were a
number of limitations to the exercise, several of which were highlighted in the
participant feedback. These included:
1. Layout may be as important as number of turbines;
2. Layout and number of turbines are likely to be related (i.e., for efficient
power production the spacing of turbines may vary with different
numbers);
3. The significance of ‘no change’ could have been understated as people
may have felt that they were ‘required’ to remove a further turbine;
4. No detailed questionnaire followed each round of voting when removing
turbines. As a consequence, the underlying reasons for participants
identifying individual turbines were not examined and there could be an
element of random choice in the results.
In general, the capability to examine the landscape from a range of viewpoints
and heights allows the viewer to achieve a better understanding of landscape scale
and connectivity; an understanding that maps, photographic images, drawings and
even the real experience may often fail to provide. As Appleton et al.
22, p154
note
‘Interactivity is the main advantage of the virtual worlds approach…this may be
because it allows the user to find viewpoints which are meaningful to them and
which they can relate to real life experience’.
Participants were divided on the truth of the visualizations, with some feeling
that the model was a good representation of their landscape, while others disagreed
and argued that greater detail was required to show the effects of hedges, walls and
existing pylons. This latter observation was also occasionally repeated alongside
that of doubting the transparency of the process of model development, and a
possible attempt by a turbine developer to soften the impact of a future windfarm.
The extent to which the level of realism impacts on perceptions and responses
in such studies is unclear. Daniel and Meitner
23
, in exploring the representational
validity of landscape visualizations with varying levels of ‘graphical realism’, state
that the appropriateness of the representation is vital in producing valid results.
© 2008 by Taylor & Francis Group, LLC
Visualization to support wind energy planning 237
They emphasize that inaccurate, poor or unrealistic representation could ‘produce
perceptions, interpretations and/or value judgments that are not consistent with
those that would be produced by actual encounters with the environments
represented’
23, p70
. As a consequence, further empirical tests of the validity of
responses obtained through visualization by comparison with those from real
encounters could be a useful exercise to undertake.
Improving the means of engagement with stakeholders in issues of landscape
planning potentially raises the equity with which people can participate in decisions
which have a direct affect upon their local environment and lifestyle
24,25
. However,
having identified the importance of engagement, and explored one approach
towards enabling interactions, a number of significant issues remain, for example,
including the extent of the effectiveness of the engagement. Current research is
being carried out on this topic at the Macaulay Institute in Scotland.
14.5 CONCLUSIONS
The virtual landscape theater appeared most effective in the role of engaging the
public, providing a means of communicating environmental information and
potential change in a comprehendible manner and thus enabling them to become
involved in the decision-making process. This supports previous experiences
reported by Bell
26
, Orland et al.
27
and Appleton and Lovett
28
. Participation was
limited to an extent due to the lack of freedom for users to apply different scenarios
and view a range of options for future change; and implementing such a facility
would have substantial time and cost implications.
However, through observing participants, it became clear that not all were
voting in time and hence their selection was not counted, and a few chose not to
vote at all. In the latter situation, the use of a more discursive approach through the
virtual journey proved more effective, perhaps because it provided greater freedom
to expand on answers and gave more time to consider each landscape, and this is an
approach which merits further consideration.
While small numbers of turbines may be acceptable in the landscape because
they are perceived to be assimilated, larger numbers were often opposed because of
their collective scale of imposition. Thus, the use of visualization tools could also
contribute to testing thresholds for the acceptability of wind turbines in the
landscape.
14.6 ACKNOWLEDGMENTS
The Scottish Executive Environment and Rural Affairs Department, and the
European Commission (under project QLK5-CT-2002-01017, VisuLands) are
thanked for their financial support of the research reported in this chapter.
© 2008 by Taylor & Francis Group, LLC
238 GIS for environmental decision-making
14.7 REFERENCES
1.
European Commission, Toward Sustainability, 5th Environmental Action Programme1993-2000, OJ C
138, 17/5/93, European Commission, Brussels, 1993.
2.
European Commission, Environment 2010: Our Future, Our Choice. The Sixth Environment Action
Programme of the European Community, OJ L 242, 10/9/2002, European Commission, Brussels, 2002.
3.
European Union, Convention on Access to Information, Public Participation in Decision-making and
Access to Justice on Environmental Matters, Aarhus, Denmark, 1998.
4.
Council of Europe, European Landscape Convention, Committee of Ministers of the Council of
Europe, Florence, 2000.
5.
Kwartler, M., Visualization in support of public participation, in Visualization in Landscape and
Environmental Planning, Bishop, I. and Lange, E. Eds., Taylor & Francis, London, 2005, 251-260.
6.
Neighbourhood Initiatives Foundation, A Practical Handbook for ‘Planning For Real’ Consultation
Exercise, Neighbourhood Initiatives Foundation, Telford, 1995.
7.
Office of the Deputy Prime Minister (ODPM), Participatory Planning for Sustainable Communities:
International Experience in Mediation, Negotiation and Engagement in Making Plans, ODPM
Publications, Wetherby, 2003.
8.
Scottish Executive, Planning Advice Note (PAN) - Community Engagement "Planning with People":
Consultation Draft, publications/2006/07/14093848/0, 2006.
9.
Benson, J., Visual Analysis of Windfarms: Good Practice Guide, Report for Scottish Natural Heritage,
the Scottish Renewables Forum and the Scottish Society of Directors of Planning, Scottish Natural
Heritage, Edinburgh, 2005
10.
Lange, E. and Bishop, I., Communication, perception and visualisation, in Visualization in Landscape
and Environmental Planning, Bishop, I. and Lange, E. Eds., Taylor & Francis, London, 2005, 3-21.
11.
Piekarski, W. and Thomas, B.H., Future use of augmented reality for environmental and landscape
planners, in Visualization in Landscape and Environmental Planning, Bishop, I. and Lange, E. Eds.,
Taylor & Francis, London, 2005, 234-240.
12.
Appleton, K. and Lovett, A., GIS-based visualisation of development proposals: reactions from
planning and related professionals, Computers, Environment and Urban Systems, 29, 321-339, 2005.
13.
MacFarlane, R., Stagg, H., Turner, K., and Lievesley, M., Peering through the smoke? Tensions in
landscape visualisation, Computers, Environment and Urban Systems, 29, 341-359, 2005.
14.
Leica Geosystems, ERDAS IMAGINE VirtualGIS
®
, Leica Geosystems, ca-
geosystems.com, 2005.
15.
Ordnance Survey, Land-form PROFILE
®
,
landformprofile/, 2005.
16.
Discoe, B., Data sources for three-dimensional models, in Visualization in Landscape and
Environmental Planning, Bishop, I. and Lange, E. Eds., Taylor & Francis, London, 2005, 35-49.
17.
MultiGen-Paradigm, Creation products, MultiGen Paradigm Inc, tigen-
paradigm.com/products/database/creator/, 2005.
18.
Autodesk, 3D Studio Max, Autodesk, , 2005.
19.
MultiGen-Paradigm, Visualization products, MultiGen Paradigm Inc, tigen-
paradigm.com/products/runtime/vega_prime/, 2005.
© 2008 by Taylor & Francis Group, LLC
Visualization to support wind energy planning 239
20.
Coleby, A.M., Public Attitudes and Community Participation in Wind Farm Development, PhD
Thesis, Heriot Watt University, Edinburgh, 2005.
21.
Bishop, I.D. and Miller, D.R., Visual assessment of off-shore wind turbines: the influence of distance,
contrast, movement and social variables, Renewable Energy, 32, 814-831, 2007.
22.
Appleton, K., Lovett, A., Sunnenberg, G., and Dockerty, T., Rural landscape visualisation from GIS
databases: a comparison of approaches, options and problems, Computers, Environment and Urban
Systems, 26, 141-162, 2002.
23.
Daniel, T.C. and Meitner, M.M., Representational validity of landscape visualizations: The effects of
graphical realism on perceived scenic beauty of forest vistas, Journal of Environmental Psychology, 21,
61-72, 2001.
24.
O’Neill, J. and Spash, C.L., Conceptions of Value in Environmental Decision-Making, Environmental
Valuation in Europe, Policy Research Brief No. 4, Macaulay Land Use Research Institute, Aberdeen,
2000.
25.
De Marchi, B. and Ravetz, J.R., Participatory Approaches to Environmental Policy, Environmental
Valuation in Europe, Policy Research Brief No. 10, Macaulay Land Use Research Institute, Aberdeen,
2001.
26.
Bell, S., Landscape: Pattern, Perception and Process, Spon, London, 1999.
27.
Orland, B., Budthimedhee, K., and Uusitalo, J., Considering virtual worlds as representations of
landscape realities and as tools for landscape planning, Landscape and Urban Planning, 54, 139-148,
2001.
28.
Appleton, K. and Lovett, A., GIS-based visualisation of rural landscapes: defining ‘sufficient’ realism
for environmental decision-making, Landscape and Urban Planning, 65, 117-131, 2003.
© 2008 by Taylor & Francis Group, LLC