Báo cáo y học: "Transcriptional profiling of bovine intervertebral disc cells: implications for identification of normal and degenerate human intervertebral disc cell phenotypes" pdf
Bạn đang xem bản rút gọn của tài liệu. Xem và tải ngay bản đầy đủ của tài liệu tại đây (1.17 MB, 20 trang )
Minogue et al. Arthritis Research & Therapy 2010, 12:R22
/>Open Access
RESEARCH ARTICLE
© 2010 Minogue et al.; licensee BioMed Central Ltd. This is an open access article distributed under the terms of the Creative Commons
Attribution License ( which permits unrestricted use, distribution, and reproduction in
any medium, provided the original work is properly cited.
Research article
Transcriptional profiling of bovine intervertebral
disc cells: implications for identification of normal
and degenerate human intervertebral disc cell
phenotypes
Ben M Minogue
1
, Stephen M Richardson
1
, Leo AH Zeef
2
, Anthony J Freemont
1
and Judith A Hoyland*
1
Abstract
Introduction: Nucleus pulposus (NP) cells have a phenotype similar to articular cartilage (AC) cells. However, the
matrix of the NP is clearly different to that of AC suggesting that specific cell phenotypes exist. The aim of this study
was to identify novel genes that could be used to distinguish bovine NP cells from AC and annulus fibrosus (AF) cells,
and to further determine their expression in normal and degenerate human intervertebral disc (IVD) cells.
Methods: Microarrays were conducted on bovine AC, AF and NP cells, using Affymetrix Genechip
®
Bovine Genome
Arrays. Differential expression levels for a number of genes were confirmed by quantitative real time polymerase chain
reaction (qRT-PCR) on bovine, AC, AF and NP cells, as well as separated bovine NP and notochordal (NC) cells.
Expression of these novel markers were further tested on normal human AC, AF and NP cells, and degenerate AF and
NP cells.
Results: Microarray comparisons between NP/AC&AF and NP/AC identified 34 NP-specific and 49 IVD-specific genes
respectively that were differentially expressed ≥100 fold. A subset of these were verified by qRT-PCR and shown to be
expressed in bovine NC cells. Eleven genes (SNAP25, KRT8, KRT18, KRT19, CDH2, IBSP, VCAN, TNMD, BASP1, FOXF1 &
FBLN1) were also differentially expressed in normal human NP cells, although to a lesser degree. Four genes (SNAP25,
KRT8, KRT18 and CDH2) were significantly decreased in degenerate human NP cells, while three genes (VCAN, TNMD
and BASP1) were significantly increased in degenerate human AF cells. The IVD negative marker FBLN1 was
significantly increased in both degenerate human NP and AF cells.
Conclusions: This study has identified a number of novel genes that characterise the bovine and human NP and IVD
transcriptional profiles, and allows for discrimination between AC, AF and NP cells. Furthermore, the similarity in
expression profiles of the separated NP and NC cell populations suggests that these two cell types may be derived
from a common lineage. Although interspecies variation, together with changes with IVD degeneration were noted,
use of this gene expression signature will benefit tissue engineering studies where defining the NP phenotype is
paramount.
Introduction
Low back pain (LBP) is the leading cause of disability and
sick leave in the UK and it has been estimated that more
than 80% of the population will report LBP at some point
during their lifetime [1]. Each year as a result of sick leave,
disability benefits and medical and insurance costs, LBP
costs the British economy alone over £12 billion [2]. One of
the main causes of LBP is thought to be degeneration of the
intervertebral disc (IVD) [3]. However, current treatments
for IVD degeneration and LBP are aimed at relieving symp-
toms rather than being curative and offer little hope of
restoring the IVD to its original function. Consequently,
there is an urgent need for a more effective treatment of
IVD degeneration. Recent advances in tissue engineering
* Correspondence:
1
Tissue Injury and Repair, School of Biomedicine, Faculty of Medical and
Human Sciences, University of Manchester, Oxford Road, Manchester, M13 9PT,
UK
Minogue et al. Arthritis Research & Therapy 2010, 12:R22
/>Page 2 of 20
and IVD biology offer exciting potential therapies for
repairing the IVD, in particular, via the introduction of dif-
ferentiated mesenchymal stem cells (MSCs) into the degen-
erate nucleus pulposus (NP). In recent years, several in vitro
and in vivo studies have demonstrated that MSCs are capa-
ble of differentiation into chondrogenic cells, similar to
those found in the NP of the disc [4-9]. However, in order
for any tissue engineering strategy aimed at repairing the
degenerate NP to be successful, it is crucial that the defini-
tive molecular phenotype of NP cells is elucidated.
Each IVD is comprised of three morphologically distinct
regions; the cartilaginous end plates (CEP), the ligamentous
annulus fibrosus (AF) and the gelatinous NP. Cells of the
AF and NP have previously been described as chondrocyte-
like cells [10] but markedly differ from each other and
articular chondrocytes. AF cells are elongated and fibro-
blastic in appearance, but retain expression of chondrocyte
marker genes, such as type II collagen (COL2A1) and
aggrecan (ACAN). NP cells demonstrate a classic rounded
chondrocyte-like morphology and express a number of
chondrocyte marker genes [11], although their origin and
full molecular phenotype are not clearly understood. Com-
plicating this further is the presence of a second cell popula-
tion within the NP. During development the perichordal
disc, forerunner of the IVD and endplates, forms by seg-
mentation of the mesenchymal column that surrounds the
developing notochord (NC). The notochordal segments
expand in cell number and mucoid extracellular matrix
(ECM) to form the notochordal NP [12,13]. In humans, this
population of NC cells present during development is grad-
ually replaced by a population of smaller, spherical NP cells
[14]. However, in many animal species these larger, 'phys-
aliferous' notochordal cells persist throughout the life time
of the animal. In species where NC cells persist, the NP
ECM demonstrates a higher level of hydration than in adult
human NP and there is no evidence of IVD degeneration,
suggesting that NC cells play an important role in regulat-
ing disc cell function and ECM synthesis [15-17].
Although NP cells have a phenotype similar to articular
chondrocytes [11], the ECM in which they reside shows
distinct differences in proteoglycan (PG) and collagen con-
tents. In the NP, the PG:collagen ratio is approximately
27:1, whereas in articular cartilage (AC) is reported to be
2:1 resulting in a less fibrous, more highly hydrated tissue
in the NP [18]. Such ECM differences imply that for correct
functioning of an engineered IVD it is essential for the
implanted cells to possess the correct phenotype. Impor-
tantly, for stem cells-based tissue regeneration it is therefore
not sufficient to rely on pre-existing chondrocyte marker
genes to define an NP phenotype.
Surprisingly, there have been few attempts to characterise
the differences in the transcriptional or protein profiles of
IVD cells and AC cells. Hypoxia inducible factor 1 iso-
forms (HIF1A and HIF1B), glucose transporter type 1
(GLUT-1), matrix metalloproteinase 2 (MMP-2) and vascu-
lar endothelial growth factor (VEGF) have been postulated
as NP cell marker genes, with their presence identifying an
adaptation of the cells to the unique environment of the
IVD [19-21]. This suggests that the challenging environ-
ment of the IVD contributes to defining the cells that
occupy the NP. Fujita and colleagues [22] used rat NP to
identify cell surface markers that were specific to NP cells
and identified CD24, a glycosylphosphatidylinositol anchor
protein, as being highly expressed in NP cells in a tissue
specific manner. However, no data were presented for dif-
ferences between human NP and AC cells, so it remains
unclear whether CD24 can indeed be used for distinguish-
ing human NP cells.
More recently studies have utilised microarrays in rat and
canine tissues to compare phenotypes of IVD cells and
articular chondrocytes and have reported a number of genes
that are differentially expressed in NP, AF and AC cells.
Lee and colleagues [23] identified 63 genes between rat NP
and AF cells and 41 genes between NP and AC cells with at
least five-fold differences in expression. A handful of these
potential marker genes were further characterised and
although the authors observed no clear on/off markers, ker-
atin 19 and glypican 3 (GPC3) encouragingly stained
immunopositive in the NP of discs from young rats but
were negative in AF and AC cells. When the same group
studied canine NP and AF cells, they identified 45 genes
that were more highly expressed in NP than AF cells [24].
Differential expression of five of these genes was then con-
firmed using quantitative real-time PCR (qRT-PCR) on NP,
AF and AC cells, which demonstrated that α-2-macroglob-
ulin (A2M), cytokeratin-18 (KRT18) and neural cell adhe-
sion molecule (NCAM1) were enhanced in NP compared
with AC cells. No difference was noted in desmocollin 2
(DSC2) or annexin A4 (ANXA4) between NP and AF or
NP, AF and AC cells, respectively. Furthermore, when five
of the differentially expressed genes identified in the earlier
rat arrays (cartilage oligomeric matrix protein (COMP),
GPC3, matrix Gla protein (MGP), pleiotrophin (PTN) and
vimentin (VIM)) were studied in the canine tissues, only 2
(COMP and MGP - markers of AC cells rather than NP
cells) demonstrated a similar pattern in the canine IVD.
This suggests that interspecies variations in gene expression
exists, although the fact that rat discs retain a high noto-
chordal cell population, whereas the beagle dogs used in
their study are non-notochordal may explain the differences
observed. Crucially, such data highlight the importance of
identifying both cell type-specific and species-specific
genes when defining the IVD cell phenotype.
The aim of this study was to utilise Affymetrix microar-
ray technology to identify novel bovine marker genes that
could be used to discriminate the transcriptional profile of
chondrocyte-like NP cells from AC cells. Bovine caudal
tissues were chosen because they are frequently used as
Minogue et al. Arthritis Research & Therapy 2010, 12:R22
/>Page 3 of 20
models for testing regenerative medicine therapies due to
their similarity in size and physico-chemical environment
to human lumbar discs [25]. Differential expression of a
number of genes identified by microarray was validated
using qRT-PCR on bovine NP, AF and AC cells and then
examined in NC cells isolated from immature bovine cau-
dal discs. These validated, differentially expressed genes
were then further analysed in human IVD and AC cells to
assess their feasibility as markers of NP cells across spe-
cies. Finally, any change in these marker genes with IVD
degeneration was assessed using qRT-PCR on both non-
degenerate and degenerate human IVD cells.
Materials and methods
Tissue and sample preparation for cDNA microarray
Bovine IVD tissue was obtained from bovine tails of young
adult animals (18 to 36 months old) purchased from a local
slaughterhouse. The discs were excised and macroscopi-
cally dissected into AF and NP tissues taking care to
remove any transition zone. AC was also isolated from the
stifle joints of the same animals and the three tissue types
from each individual were cut into 2 to 3 mm
3
fragments.
Each sample was enzymatically digested in serum-free
media containing 0.5% pronase (Merck Chemicals Ltd,
Nottingham, UK) for one hour and transferred to serum-
free media containing 0.5% collagenase type II (Invitrogen,
Paisley, UK) and 0.1% hyaluronidase (Sigma, Poole, UK)
for two to three hours on an orbital shaker at 37°C. Super-
natant was passed through a 40 μm filter to remove tissue
debris. Cells were then collected by centrifugation at 500 G
for five minutes and the cell pellet lysed in Trizol
®
reagent
(Invitrogen, Paisley, UK). RNA was extracted from the
recovered cells with the addition of high salt precipitation
solution (HSPS) as recommended by the manufacturer,
quantified using a Nanodrop ND-1000 spectrophotometer
(Nanodrop Technologies, Wilmington, DE, USA) and qual-
ity checked using the RNA 6000 Nano Assay analysed on
the Agilent 2100 Bioanalyzer (Agilent Technologies,
Stockport, UK). Only high-quality RNA with an RNA
integrity number (RIN) of at least seven was used for the
arrays. To minimise the effect of biological variation on dif-
ferential expression, RNA was pooled from five animals for
each cell type and hybridisations for each cell type were
performed in triplicate (15 animals in total).
cDNA microarrays
Microarray experiments were performed using the
Genechip
®
Bovine genome arrays (Affymetrix, High
Wycombe, UK). For each hybridisation, 15 μg of total RNA
was used to prepare first-strand cDNA using an oligo (dT)-
T7 primer. Following second-strand synthesis, biotinylated
cRNA targets were generated using an Enzo BioArray high
yield RNA transcript-labeling kit (Affymetrix, High
Wycombe, UK) by in vitro transcription with biotinylated
UTP and CTP. Technical quality control was performed
with dChip [26]. Principal component analysis (PCA) was
performed using Partek software, version 6.0 (Partek Inc.,
St. Charles, MO, USA) to demonstrate overall variance in
gene expression between the three cell types [27] and gene
expression and statistical analysis was performed using
PUMA software (The University of Manchester, Man-
chester, UK) [28]. The false discovery rate estimation was
obtained by performing a parametric analysis of variance
(ANOVA) and false discovery correction by the qvalue
method (Princeton University, Princeton, NJ, USA) [29].
The microarray data was submitted in MIAME (Minimum
Information About a Microarray Experiment) compliant
format to the ArrayExpress database ([30], accession num-
ber [ArrayExpress:E-MEXP-2291]).
Sample preparation for quantitative real time PCR
Bovine Samples
qRT-PCR with gene-specific primers was performed in trip-
licate on cDNA derived from each of the three different tis-
sues, NP, AF and AC, from five individual animals as
described above. Additionally, notochordal cells were sepa-
rated from NP cells using enzymatic digestion as described
above and the cells in the supernatant separated further by
using a sequential cell sieving method [16]. Large 'noto-
chordal' cells retained in the 15 μm and 10 μm sieves (Cell-
MicroSieves, BioDesign Inc., New York, NY, USA) were
washed from the membrane, collected by centrifugation at
500 G for five minutes and the cell pellet lysed in Trizol
®
.
Cells in the supernatant that had passed through the 8 μm
filter were also collected by centrifugation at 500 G for five
minutes and the cell pellet lysed in Trizol
®
. RNA for both
cell types was extracted as described above. Of each RNA
sample, 2 μg was treated with DNAse I (Invitrogen, Paisley,
UK) to remove contaminating genomic DNA and reverse
transcribed into cDNA using the high capacity cDNA
reverse transcription kit (Applied Biosystems, Warrington,
UK) according to manufacturer's instructions. cDNA sam-
ples were diluted to 5 ng/μl using molecular grade water
prior to use.
Human samples
Human IVD tissue was obtained during post-mortem exam-
ination with informed consent from relatives and local ethi-
cal committee approval (North West Research Ethics
committee). Samples were further dissected for histological
grading, using a published histological 12-point scale [11],
and for enzymatic digestion into NP and outer AF regions,
ensuring that transition zone tissue was removed. Five non-
degenerate (histological grade 1 to 3: ages 45 to 60 years;
mean age 52 years) and five moderately degenerate (grades
6 to 8; ages 49 to 57 years; mean age 51 years) discs were
used. Human AC was obtained, with informed consent and
local ethical approval (South Manchester Research Ethics
committee), during total knee arthroplasty from patients
Minogue et al. Arthritis Research & Therapy 2010, 12:R22
/>Page 4 of 20
with osteoarthritis. Five AC samples (ages 50 to 60 years;
mean age 56 years) from the medial and lateral compart-
ments (femoral condyles and tibial plateaus) with a 'normal'
macroscopic appearance were harvested and full thickness
sections excluding subchondral bone were fixed in formalin
and processed to paraffin wax for histology. Sections were
stained with H&E and safranin-O staining and graded using
an 11 point scoring system adapted from Mankin and col-
leagues [31] as previously described [32]. Only samples
from areas of cartilage graded as histologically 'normal'
were used. Cells from each of the AC, AF and NP tissues
were enzymatically released and the RNA recovered and
prepared for qRT-PCR as described for bovine samples.
Quantitative real-time PCR
qRT-PCR was carried out on cDNA samples using the
SYBR
®
Green method. Gene-specific primers (Tables 1 and
2) were designed using the Primer Express 2 software
(Applied BioSystems, Warrington, UK), optimised to
ensure specificity and tested against either a bovine
genomic DNA standard curve or human universal reference
total RNA (Takara Bio Europe/Clontech, Saint-Germain-
en-Laye, France) standard curve, to ensure optimal effi-
ciency. Reactions were conducted on an ABI Prism 7000
sequence detection system (Applied BioSystems, Foster
City, CA, USA) in triplicate in 96-well plates in a final vol-
ume of 20 μl under standard conditions. Reaction mixes
contained 10 μl of two times SYBR Green mastermix
(Applied BioSystems, Warrington, UK), 1 μl (6 μM) for-
ward primer, 1 μl (6 μM) reverse primer, 6 μl water and 2 μl
(5 ng/μl) cDNA. The 2
-ΔCt
and 2
-ΔΔCt
methods were used to
calculate relative expression of each target gene as
described previously [33,34]. For the 2
-ΔCt
method, mean Ct
values of target genes in each sample was normalised to the
housekeeping gene values. The 2
-ΔΔCt
method was used to
analyse changes in gene expression between normal and
degenerate human tissues, where the ΔCt value in the
degenerate tissues was normalised to the ΔCt value in the
non-degenerate samples to give the ΔΔCt value. Statistical
analysis was performed with GraphPad InStat software
(GraphPad Software, Inc. La Jolla, CA, USA) using the
Mann-Whitney U-test and significance was defined as P <
0.05.
Results
Principal component analysis
The results of the PCA of the microarray data showed that
the three replicates for each cell type clustered closely
together validating our ability to separate the cell types by
dissection and revealing distinct expression profiles for the
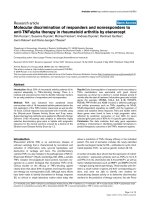
AC, AF and NP cell types (Figure 1). PCA mapping
showed that 60% of the overall variance in the microarray
dataset is described by the first two principal components.
On the first principal component (which describes 38.8% of
the overall variance) AF cells were shown to have a differ-
ent expression profile to AC and NP cells suggesting that
AC and NP cells are more similar to each other than the AF
cell type. The second principal component (which describes
21.3% of the overall variance) separates AC from NP cells
indicating that clear differences also exist between these
two cell types, although they are less dramatic than with the
AF cell type.
Microarray identification of cell-specific 'marker' genes
To assess the ability of the microarray to correctly identify
gene expression within the tissues, expression of typical
chondrocyte markers was determined (Table 3). The results
demonstrated that pre-existing marker genes generally
showed the expected pattern of expression, that is high
expression of ACAN in NP and AC, high expression of
type I collagen in AF compared with NP and AC, and high
expression of versican (VCAN) in both NP and AF com-
pared with AC.
Additionally, a number of genes previously described as
being phenotypic NP markers were assessed to determine
their expression in bovine cells (Table 4). All genes previ-
ously suggested as phenotypic NP markers were expressed
by bovine IVD and AC cells. However, none of these
exhibited high differential expression, with the exception of
KRT19 identified from the rat microarray study [23], which
showed approximately a 20-fold increase in NP cells com-
pared with AC and AF cells, and KRT18 and NCAM1 iden-
tified from the canine microarray study [24], which
demonstrated 1860-fold and 10-fold higher expression in
the NP cells than AF or AC cells, respectively.
As the focus of this study was to identify either NP-spe-
cific or IVD-specific genes, two separate comparisons were
performed. NP cell expression levels were compared with
the average expression levels of AC and AF cells (NP/
AC&AF) to identify potential NP-specific genes (Table 5),
whereas NP cell expression levels and AC expression levels
(NP/AC) were compared, without inclusion of AF expres-
sion levels, to identify potential IVD-specific genes (Table
6). For both comparisons, stringent thresholds were used to
identify differentially expressed genes using a combination
of statistical score, expression level and fold change. Statis-
tical significance of differentially expressed genes was
assessed with the PUMA Bayesian method [28]. Probesets
with a probability of positive log-ratio (PPLR) value less
than 0.99 or greater than 0.01 [35] were excluded, as were
differentially expressed genes with signal fluorescence
intensities less than 50. Although PUMA does not provide
false discovery rate (fdr) correction, these thresholds passed
by ± 3,000 probesets, correspond approximately to q values
of 0.2 if calculated using a parametric ANOVA and fdr cor-
rection by qvalue [29]. The results from the NP/AC&AF
comparisons identified 185 probesets (127 genes) that had
expression intensities greater than 50 in NP cells or in
Minogue et al. Arthritis Research & Therapy 2010, 12:R22
/>Page 5 of 20
AC&AF cells, were differentially expressed (either up or
down regulated) by 10 fold or more and had a PPLR value
greater than or equal to 0.99 or less than or equal to 0.01. A
subset of 34 of these genes was differentially expressed at
least 100 fold (Table 5). The results from the NP/AC com-
parisons identified 306 probesets (242 genes) that had
expression intensities greater than 50, were differentially
expressed (either up or down regulated) by 10 fold or more
and had a PPLR value greater than or equal to 0.99 or less
than or equal to 0.01. A subset of 49 of these genes was dif-
ferentially expressed by at least 100 fold (Table 6).
Table 1: Bovine oligonucleotide primers
Gene name Gene symbol NCBI ref. seq. Forward primer Reverse primer
Glyceraldehyde-3-
phosphate
dehydrogenase
GAPDH NM_001034034.1 TGCCGCCTGGAGAAA
CC
CGCCTGCTTCACCACC
TT
Aggrecan ACAN NM_173981.2 GGGAGGAGACGACTG
CAATC
CCCATTCCGTCTTGTTT
TCTG
Versican VCAN NM_181035.2 GCTGCATGCCGCCTAT
G
TCCGTAGGTCCGGACT
CCTT
Collagen, type II, alpha
1
COL2A1 NM_001001135.2 CGGGCTGAGGGCAAC
A
CGTGCAGCCATCCTTC
AGA
Synaptosomal
associated protein 25
SNAP25 NM_001076246.1 GGCTTCATCCGCAGGG
TAA
GCTCCAGGTTTTCATC
CATTTC
Keratin 8 KRT8 NM_001033610.1 ACCAGGAGCTCATGA
ATGTCAA
TCGCCCTCCAGCAGCT
T
Keratin 18 KRT18 XM_582930.4 TTGAGCTGCTCCATCT
GCAT
AAGGCCAGCTTGGAG
AACAG
Keratin 19 KRT19 XM_875997.3 CGGTGCCACCATTGAG
AACT
CAAACTTGGTGCGGAA
GTCA
N-Cadherin CDH2 XM_001250829.2 GCCATCAAGCCAGTTG
GAA
TGCAGATCGAACCGG
GTACT
Sclerostin domain
containing 1
SOSTDC1 NM_001046265.1 GTTCAAGTAGGCTGCC
GAGAA
GCACTGGCCGTCTGAG
ATG
Integrin-binding
sialoprotein
IBSP NM_174084.2 GACAGCTATGATGGTC
AAGATTACTACA
TGGGTGAACTCATCCC
AGTCT
Tenomodulin TNMD NM_001099948.1 TCTGGCGTGACGGGTC
TT
AAAAAAGGCATTGAA
CAAAACGA
Brain attached
signalling protein 1
BASP1 NM_174780.3 TTGTGGATGAATGCCA
ACTTTC
AAAAATGGAGTATTGG
CATCAAGAT
TNF, alpha-induced
protein 6
TNFAIP6 NM_001007813.1 AAGCAGCAGGCGTCT
ACCA
CACACCGCCTTCGCTT
CT
Forkhead box F1 FOXF1 XM_603148.4 TCCCTCCCCACCTCAG
AAGT
TGGCTTCAGAAATGCA
AGTTACTC
Forkhead box F2 FOXF2 CK941878.1 TGCGTGGTAAGTTTTC
ACCATCT
CCCCCGGTGAGGTAAT
GC
Aquaporin 1 AQP1 NM_174702.3 ACCAGGAGGCCCTTAA
TGGT
CTGTTAAATGGACTAG
AAGCGAAATG
Fibulin 1 FBLN1 NM_001098029.1 GCAGCGCAGCCAAGT
CAT
AGATATGTCTGGGTGC
TACAAACG
T, brachyury homolog
(mouse)
T XM_864890.2 ACTTCGTGGCGGCTGA
CA
GCACCCACTCCCCATT
CA
Bovine oligonucleotide primers used for quantitative real-time polymerase chain reaction (qRT-PCR).
Minogue et al. Arthritis Research & Therapy 2010, 12:R22
/>Page 6 of 20
Highlighted in bold in Tables 5 and 6 are genes that were
differentially expressed (either up or down regulated) by
100 fold or more and taken forward for qRT-PCR. Italicised
are genes that were identified in previously published
microarray studies [23,24]. The NP/AC&AF comparisons
(Table 5) showed that KRT8 and KRT18 were the highest
differentially expressed genes specifically expressed in the
NP cells. These were selected for qRT-PCR analysis along
with an additional family member, KRT19, previously
described in rat arrays [23] and shown here to also be dif-
ferentially expressed in the bovine NP (Table 4). N-cad-
herin (CDH2) was also highly differentially expressed and
was selected along with synaptosomal-associated protein,
25 kDa (SNAP25) and sclerostin domain containing 1
(SOSTDC1) as NP-specific markers for further analysis.
The additional genes, brain abundant, membrane attached
signal protein 1 (BASP1), tenomodulin (TNMD), tumor
necrosis factor, alpha-induced protein 6 (TNFAIP6), fork-
head box F1 (FOXF1), forkhead box F2 (FOXF2) and
aquaporin (AQP1) were included from the NP/AC compar-
isons (Table 6) because they had high differential expres-
sion levels but also had detectable levels of expression in
the AF and were therefore of interest as transcriptional
markers of an IVD cell. AC (negative NP) markers identi-
fied by the microarray comparisons included the known
hypertrophic chondrocyte marker collagen, type X, alpha 1
(COL10A1; Table 6). The highest differentially expressed
genes that were specifically expressed in the AC cells were
Table 2: Human oligonucleotide primers
Gene name Gene symbol NCBI ref. seq. Forward primer Reverse primer
Actin, beta ACTB NM_001101.3 CGAGAAGATGACCCA
GATCATG
ACAGCCTGGATAGCA
ACGTACA
Aggrecan ACAN NM_001135.2 TCTACCGCTGCGAGGT
GAT
TGTAATGGAACACGAT
GCCTTT
Versican VCAN NM_004385.4 GCCTTTCCTATCACCTC
GAGAA
CACGGCAACCCAAAAT
GACT
Collagen, type II, alpha
1
COL2A1 NM_001844.4 GGAAGAGTGGAGACT
ACTGGATTGAC
TCCATGTTGCAGAAAA
CCTTCA
Synaptosomal
associated protein 25
SNAP25 NM_003081.2 CAATGAGCTGGAGGA
GATGCA
TGCTTTCCAGCGACTC
ATCA
Keratin 8 KRT8 NM_002273.3 CACATCTGTGGTGCTG
TCCAT
GCCTTGACCTCAGCAA
TGATG
Keratin 18 KRT18 NM_000224.2 GCCTACAAGCCCAGAT
TGC
GGCGAGGTCCTGAGA
TTTGG
Keratin 19 KRT19 NM_002276.4 CGCAGGGTGCTGGAT
GAG
AGGTAGGCCAGCTCTT
CCTT
N-Cadherin CDH2 NM_001792.3 AGCCTGGAACGCAGT
GTAC
GCGAACCGTCCAGTA
GGAT
Integrin-binding
sialoprotein
IBSP NM_004967.3 CCAGAGGAAGCAATC
AC
GCACAGGCCATTCCCA
A
Tenomodulin TNMD NM_022144.2 CAGTGGGTGGTCCCTC
AAG
GTCATTTATTGGAAGT
TCTTCCTCACTTG
Brain attached
signalling protein 1
BASP1 NM_006317.3 GCGGAGCCCGAGAAG
AC
GGCCTCAGCAGCTTTG
G
Forkhead box F1 FOXF1 NM_001451.2 AAGCCGCCCTATTCCT
ACATC
GCGCTTGGTGGGTGAA
CT
Fibulin 1 FBLN1 NM_006487.2 CCTTCGAGTGCCCTGA
GAACTA
ACCGATGGCCTCATGC
A
T, brachyury homolog
(mouse)
T NM_003181.2 CAATGAGATGATCGTG
ACCAAGA
GCCAGACACGTTCACC
TTCA
Human oligonucleotide primers used for quantitative real-time polymerase chain reaction (qRT-PCR).
Minogue et al. Arthritis Research & Therapy 2010, 12:R22
/>Page 7 of 20
integrin-binding sialoprotein (IBSP) and fibulin 1 (FBLN1)
and were therefore selected as AC (negative NP) markers
for further analysis.
qRT-PCR verification of cell-specific marker genes in bovine
samples
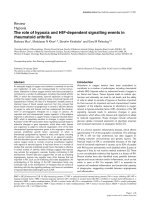
qRT-PCR results demonstrated no significant difference in
the relative gene expression for the typical chondrocyte
marker genes COL2A1 and ACAN between NP and AF or
AF and AC cells. However, there were small, but signifi-
cant, increases in gene expression for COL2A1 and ACAN
in AC cells when compared with NP cells (P = 0.011 and
0.026, respectively; Figure 2). The expression of VCAN
was significantly lower in AC cells when compared with
both AF and NP cells (P < 0.0001) demonstrating its poten-
tial as a gene marker that can distinguish between AC and
NP cells.
Of the novel NP/IVD marker genes analysed, only
SNAP25 and TNMD showed no detectable expression in
AC cells after 40 cycles. For SNAP25 (Figure 3a), a very
low level of expression was detected in AF cells, which was
significantly higher in NP cells (approximately 100 fold, P
< 0.0001). Conversely, TNMD (Figure 3b) demonstrated a
low level of expression in NP cells, which was significantly
higher in AF cells (>10 fold, P < 0.0001).
Analysis of the NP-specific marker genes (SNAP25,
KRT8, KRT18, KRT19, CDH2 and SOSTDC1; Figure 3a)
demonstrated significantly higher expression in NP cells
when compared with either AF (all genes P < 0.0001) or
AC cells (all genes P < 0.0001), which confirmed the
microarray findings. SNAP25, KRT8, KRT18, KRT19 and
CDH2 also demonstrated significantly higher expression in
AF cells than AC cells (all genes P < 0.0001), while
SOSTDC1 showed no significant difference between AF
and AC cells (P = 0.13). The negative NP cell marker gene
IBSP demonstrated a similar level of expression in both AF
Figure 1 Principal component analysis (PCA) of microarray data
set. Overall variation between the three cell types articular cartilage
(AC; triangles), annulus fibrosus (AF; circles) and nucleus pulposus (NP;
diamonds), where each spot represents an individual array, can be
seen by the clustering within each cell type and the separation be-
tween the different cell types.
Table 3: Chondrogenic markers
Gene
description
Gene
symbol
AC mean AF mean NP mean Fold
change
(NP/AC)
Fold
change
(NP/AF)
Fold
change
(NP/
AC&AF)
collagen, type I,
alpha 1
COL1A1 21.11 2716.16 260.02 12.32 -10.45 -6.77
collagen, type I,
alpha 2
COL1A2 1009.68 15436.11 1330.31 1.32 -11.60 -6.51
collagen, type II,
alpha 1
COL2A1 13485.23 13260.79 4436.71 -3.04 -2.99 -3.12
SRY-box 9 SOX9 49.26 8.47 60.38 1.23 7.13 1.86
aggrecan ACAN 2852.28 168.13 2467.99 -1.16 14.68 1.09
versican VCAN 21.36 1109.99 1864.91 87.30 1.68 2.59
Bovine microarray data for typical chondrogenic markers. Mean fluorescence intensity expression is shown for each cell type (AC, AF and NP)
along with the calculated fold change values. AC, articular cartilage; AF, annulus fibrosus; NP, nucleus pulposus.
Minogue et al. Arthritis Research & Therapy 2010, 12:R22
/>Page 8 of 20
Table 4: Previously identified marker
Gene description Gene
symbol
AC mean AF mean NP mean Fold
change
(NP/AC)
Fold
change
(NP/AF)
Fold
change
(NP/
AC&AF)
matrix
metallopeptidase
2
MMP2 200.20 155.41 121.53 -1.65 -1.28 -1.56
solute carrier
family 2, member
1
SLC2A1 1200.57 1211.32 1281.16 1.07 1.06 1.04
hypoxia-inducible
factor 1, alpha
HIF1A 3985.62 7783.65 2552.07 -1.56 -3.05 -2.50
vascular
endothelial
growth factor
VEGF 1874.33 5661.88 2233.09 1.19 -2.54 -1.86
CD24 molecule CD24 521.84 44.59 86.75 -6.02 1.95 -3.42
keratin 19 KRT19 0.91 0.65 32.59 35.81 50.47 19.88
glypican 3 GPC3 4.24 37.63 13.28 3.13 -2.83 -1.78
annexin A3 ANXA3 7.64 63.66 8.26 1.08 -7.71 -7.44
pleiotrophin PTN 208.08 54.11 1.10 -189.18 -49.19 -152.58
vimentin VIM 4625.18 4749.33 3508.86 -1.32 -1.35 -1.35
cartilage
oligomeric matrix
protein
COMP 6053.50 2986.89 2786.96 -2.17 -1.07 -1.78
matrix Gla protein MGP 8480.52 7742.10 2865.30 -2.96 -2.70 -3.21
alpha-2-
macroglobulin
A2M 9.49 26.62 11.37 1.20 -2.34 -1.77
annexin A4 ANXA4 1223.21 2318.40 1273.29 1.04 -1.82 -1.55
desmocollin 2 DSC2 1.88 140.72 68.18 36.30 -2.06 -1.22
keratin 18 KRT18 0.01 0.04 94.10 15990.45 2647.60 1860.77
neural cell
adhesion
molecule 1
NCAM1 0.76 0.94 12.64 16.55 13.43 10.06
Bovine microarray data for previously identified markers. Mean fluorescence intensity expression is shown for each cell type (AC, AF and NP)
along with the calculated fold change values. AC, articular cartilage; AF, annulus fibrosus; NP, nucleus pulposus.
and AC cells, which was significantly higher than that of
NP cells (P < 0.0001).
Analysis of the IVD-specific marker genes (TNMD,
BASP1, TNFAIP6, FOXF1 and FOXF2; Figure 3b) con-
firmed the microarray results, with expression being signif-
icantly higher in both NP and AF cells than AC cells (all
genes P < 0.0001). In addition, TNMD, TNFAIP6 and
AQP1 demonstrated significantly higher expression in AF
cells compared with NP cells (all genes P < 0.0001), while
FOXF1 and FOXF2 demonstrated small, yet significant,
increases in AF cells compared with NP cells (P < 0.0001).
Finally, BASP1, showed a small, but significant increase in
NP cells compared with AF cells (P = 0.0014). The nega-
tive IVD marker gene, FBLN1, showed significantly higher
expression in AC cells compared with both NP and AF cells
(P < 0.0001), with expression in AF cells being signifi-
cantly lower than in NP cells (P < 0.0001).
Although the NP of mature bovine caudal disc is consid-
ered to be populated by chondrocyte-like cells, histological
assessment of the tissues used here (18 to 36 months old)
revealed a small population of resident notochordal cells.
To determine whether the identified NP or IVD markers
were expressed in either chondrocyte-like NP cells or these
larger notochordal cells, the two cell types were isolated
Minogue et al. Arthritis Research & Therapy 2010, 12:R22
/>Page 9 of 20
Table 5: NP vs AC and AF microarray comparison
Gene
description
Gene symbol AC mean AF mean AC&AF mean NP mean Fold change
(NP/AC&AF)
keratin 8 KRT8 0.09 0.39 0.28 714.79 2544.79
keratin 18 KRT18 0.01 0.04 0.05 94.10 1860.77
ras homolog
gene family,
member B
RHOB 0.24 0.04 0.40 383.01 968.68
hypothetical
protein
BC012029
LOC152573 0.05 0.18 0.26 230.02 897.02
cadherin 2,
type 1, N-
cadherin
CDH2 0.09 0.22 0.21 180.47 840.69
Kruppel-like
factor 6
KLF6 0.13 0.03 0.12 55.84 456.37
plakophilin 2 PKP2 0.13 0.48 0.37 77.71 212.23
related RAS
viral (r-ras)
oncogene
homolog
RRAS 0.74 0.39 0.61 93.40 152.49
synaptosoma
l-associated
protein, 25
kDa
SNAP25 0.55 0.81 0.69 94.22 136.76
sclerostin
domain
containing 1
SOSTDC1 0.28 0.53 0.68 79.27 116.29
optineurin OPTN 0.22 0.36 0.80 88.35 109.86
tropomyosin 2
(beta)
TPM2 18.99 94.17 78.02 0.74 -104.73
integrin, alpha
9
ITGA9 38.74 62.19 66.25 0.50 -131.50
pleiotrophin
(heparin
binding
growth factor
8)
PTN 208.08 54.11 167.82 1.10 -152.58
Tissue factor
pathway
inhibitor 2
TFPI2 1080.55 5089.17 4138.76 26.91 -153.83
guanine
nucleotide
binding
protein (G
protein),
gamma 11
GNG11 0.57 331.31 298.19 1.65 -181.06
podocalyxin-
like
PODXL 0.50 297.24 208.74 1.14 -182.62
proteoglycan
4
PRG4 917.06 27.09 722.28 3.25 -222.06
Minogue et al. Arthritis Research & Therapy 2010, 12:R22
/>Page 10 of 20
a disintegrin-
like and
metallopeptid
ase with
thrombospon
din type 1
motif, 4
ADAMTS4 115.72 2187.60 1561.34 5.25 -297.16
phenylalanine
hydroxylase
PAH 195.83 0.24 98.50 0.32 -307.92
interferon,
gamma-
inducible
protein 16
IFI16 0.28 61.31 67.55 0.20 -337.80
retinoic acid
receptor
responder 1
RARRES1 974.75 156.02 671.46 1.98 -338.73
regulator of G-
protein
signalling 5
RGS5 5.68 436.91 264.83 0.67 -393.62
integrin-
binding
sialoprotein
IBSP 300.90 0.06 159.69 0.37 -433.73
complement
factor H
CFH 1.72 60.74 86.66 0.12 -729.93
fibulin 1 FBLN1 199.29 0.22 108.88 0.13 -826.03
Serpin
peptidase
inhibitor,
clade F,
member 1
SERPINF1 17.15 512.43 281.58 0.34 -830.27
Keratocan KERA 0.05 346.47 341.38 0.38 -893.66
collagen, type
X, alpha 1
COL10A1 1192.84 7.19 741.87 0.79 -944.44
Endomucin EMCN 0.45 281.94 189.76 0.16 -1166.81
secreted
frizzled-
related
protein 2
SFRP2 9.98 153.89 106.73 0.08 -1391.84
peptidase
inhibitor 15
PI15 478.32 83.74 308.94 0.10 -3231.26
myosin, heavy
chain 11,
smooth
muscle
MYH11 1.15 462.12 263.70 0.03 -7708.90
chemokine (C-
X-C motif)
ligand 1
CXCL1 3.14 549.84 492.06 0.02 -28150.12
NP specific marker genes. Genes identified by NP vs AC and AF microarray comparison. Mean fluorescence intensity is shown for each cell
type (AC, AF and NP) along with the mean combined intensity for AC and AF cells and the calculated fold change values (positive and
negative) between NP and AC and AF cells that were greater than 100. Highlighted in bold are genes that were taken forward for qRT-PCR
and italicised are genes that were identified in previous studies [23,24]. AC, articular cartilage; AF, annulus fibrosus; NP, nucleus pulposus;
qRT-PCR, quantitative real time polymerase chain reaction.
Table 5: NP vs AC and AF microarray comparison (Continued)
Minogue et al. Arthritis Research & Therapy 2010, 12:R22
/>Page 11 of 20
Table 6: NP vs AC microarray comparison
Gene description Gene symbol AC mean AF mean NP mean Fold change (NP/
AC)
brain abundant,
membrane
attached signal
protein 1
BASP1 0.02 57.19 384.21 16167.90
keratin 18 KRT18 0.01 0.04 94.10 15990.45
Tenomodulin TNMD 0.01 241.03 102.36 15087.56
TNF, alpha-
induced protein
6
TNFAIP6 0.01 304.98 121.88 8205.96
keratin 8 KRT8 0.09 0.39 714.79 7607.92
hypothetical
protein BC012029
LOC152573 0.05 0.18 230.02 4635.12
TNF, alpha-
induced protein
6
TNFAIP6 0.19 3649.85 508.71 2648.51
SH3 domain
binding glutamic
acid-rich protein
SH3BGR 0.08 20.83 172.70 2230.52
cadherin 2, type
1, N-cadherin
(neuronal)
CDH2 0.09 0.22 180.47 1941.17
chordin CHRD 0.03 1.29 57.29 1671.45
Rat sarcoma (ras)
homolog gene
family, member B
RHOB 0.24 0.04 383.01 1627.81
homeobox B8 HOXB8 0.08 9.11 119.75 1591.12
Rho GTPase
activating protein
27
ARHGAP27 0.08 0.72 89.24 1072.84
forkhead box F1 FOXF1 0.43 703.54 457.76 1054.86
plakophilin 2 PKP2 0.13 0.48 77.71 603.25
homeobox B6 HOXB6 0.11 58.21 61.73 580.12
adaptor-related
protein complex
2, mu 1 subunit
AP2M1 0.55 350.92 305.70 557.26
transketolase-like
1
TKTL1 0.89 4.59 478.18 536.27
cytochrome b-
245, alpha
polypeptide
CYBA 0.16 0.77 83.63 513.67
phosphatidyletha
nolamine-binding
protein 4
PEBP4 0.84 113.44 429.31 511.40
forkhead box F2 FOXF2 0.60 416.30 283.89 470.91
Kruppel-like
factor 6
KLF6 0.13 0.03 55.84 444.91
optineurin OPTN 0.22 0.36 88.35 407.25
aquaporin 1
(Colton blood
group)
AQP1 0.42 5.55 144.13 346.12
Minogue et al. Arthritis Research & Therapy 2010, 12:R22
/>Page 12 of 20
RAB3B, member
RAS oncogene
family
RAB3B 0.18 0.27 58.47 333.33
similar to sushi
domain
containing 2
SUSD2 1.05 34.26 300.30 286.96
sclerostin
domain
containing 1
SOSTDC1 0.28 0.53 79.27 286.23
CD36 molecule
(thrombospondin
receptor)
CD36 0.27 96.74 71.61 262.65
capping protein
(actin filament),
gelsolin-like
CAPG 0.21 12.70 53.11 257.62
similar to zinc
finger
homeodomain 4
ZFHX4 0.23 160.03 55.13 241.22
neurotrophic
tyrosine kinase,
receptor, type 2
NTRK2 0.62 248.28 106.60 172.40
synaptosomal-
associated
protein, 25 kDa
SNAP25 0.55 0.81 94.22 171.81
lectin,
galactoside-
binding, soluble,
1 (galectin 1)
LGALS1 0.57 81.20 88.20 155.33
testis derived
transcript (3
Lin11, Isl-1 & Mec-
3 (LIM) domains)
TES 0.38 32.63 55.66 145.10
Related-rat
sarcoma viral (r-
ras) oncogene
homolog
RRAS 0.74 0.39 93.40 125.71
sorting nexin
family member 30
SNX30 0.74 31.31 89.00 120.18
vanin 1 VNN1 0.69 67.28 82.51 119.73
collagen, type
XVIII, alpha 1
COL18A1 1.02 102.46 116.62 114.48
transmembrane
protein 100
TMEM100 1.05 1.80 116.48 110.68
macrophage
migration
inhibitory factor
MIF 3.47 1.70 368.05 105.96
ectodermal-
neural cortex
ENC1 0.74 53.63 75.21 101.74
pleiotrophin PTN 208.08 54.11 1.10 -189.18
cytokine-like 1 CYTL1 11388.79 19.33 29.48 -386.29
retinoic acid
receptor
responder 1
RARRES1 974.75 156.02 1.98 -491.73
phenylalanine
hydroxylase
PAH 195.83 0.24 0.32 -612.20
Table 6: NP vs AC microarray comparison (Continued)
Minogue et al. Arthritis Research & Therapy 2010, 12:R22
/>Page 13 of 20
integrin-binding
sialoprotein
IBSP 300.90 0.06 0.37 -817.30
fibulin 1 FBLN1 199.29 0.22 0.13 -1511.93
collagen, type X,
alpha 1
COL10A1 1192.84 7.19 0.79 -1518.56
peptidase
inhibitor 15
PI15 478.32 83.74 0.10 -5002.83
IVD specific marker genes. Genes identified by NP vs AC microarray comparison. Mean fluorescence intensity is shown for each cell type (AC,
AF and NP) along with calculated fold change values (positive and negative) between NP and AC cells that were greater than 100. Highlighted
in bold are genes that were taken forward for qRT-PCR and italicised are genes that were identified in previous array studies [23,24]. AC,
articular cartilage; AF, annulus fibrosus; NP, nucleus pulposus; qRT-PCR, quantitative real time polymerase chain reaction.
Table 6: NP vs AC microarray comparison (Continued)
Figure 2 Quantitative real-time PCR for typical chondrocyte
marker genes in bovine AC, AF and NP cells. Relative gene expres-
sion for the chondrocyte marker genes (type II collagen (COL2A1), ag-
grecan (ACAN) and versican (VCAN)) was normalised to the
housekeeping gene, glyceraldehyde-3-phosphate dehydrogenase
(GAPDH) and plotted on a log scale. * statistical significance between
nucleus pulposus (NP) and annulus fibrosus (AF) cells and nucleus pul-
posus (NP) and AC cells (P < 0.05). † statistical significance between AF
cells and AC cells (P < 0.05).
and the marker genes detected by qRT-PCR along with the
molecular NC marker, brachyury homolog (T) [36,37].
Comparisons of NP (Figure 4a) and IVD (Figure 4b) spe-
cific genes in NP cells and NC cells clearly demonstrated
expression of each gene by both cell types. Interestingly,
NP-specific genes (with the exception of SNAP25) demon-
strated significantly higher expression by NC cells than NP
cells (all genes P < 0.0001), while IVD-specific genes dem-
onstrated significantly higher expression by NP cells than
NC cells (all genes P < 0.0001). The proposed NC marker
gene T, demonstrated expression in both NP and NC cells,
but expression was significantly higher in NC cells (P <
0.0001).
qRT-PCR validation of cell-specific marker genes in human
samples
Gene expression in normal samples
Analysis of expression of traditional marker genes in
human normal IVD samples (Figure 5) showed that when
compared with AC cells, ACAN and COL2A1 gene expres-
sion was significantly lower in normal AF cells (P =
0.0003, and P < 0.0001, respectively) and normal NP cells
(P = 0.0018, and P < 0.0001, respectively). However, there
was no significant difference for either ACAN or COL2A1
between normal AF and NP cells (P = 0.39, and P = 0.1,
respectively).
All novel marker genes analysed were shown to be
expressed by human NP, AF and AC cells. In general, a
similar pattern of expression was observed for human NP
cells as was seen for bovine NP cells. However, differential
gene expression levels between the three cell types did not
follow a similar trend, with fold changes in gene expression
being lower than those observed in bovine cells. In contrast
to bovine samples, KRT8, KRT18 and KRT19 showed only
small differences in expression between the three cell types
studied. KRT8 expression only differed significantly
between AF cells and AC cells (P = 0.03), while KRT18
expression was significantly higher in NP and AF cells
when compared with AC cells (P = 0.0006, and P < 0.0001,
respectively). KRT19 demonstrated no significant differ-
ences across any of the cell types. CDH2 showed a similar
pattern of expression to bovine samples, with the highest
expression in NP cells and the lowest in AC cells. However,
although the differences in expression were significant (NP/
AF P < 0.0001, NP/AC P < 0.0001, AF/NP P = 0.045), the
fold change in expression in human samples was lower than
that seen in bovine samples; for example, bovine NP vs AC
demonstrated an approximately 100-fold difference, while
human NP vs AC an approximately 10-fold difference. The
proposed negative NP cell marker IBSP showed signifi-
cantly lower expression in the NP cells than either the AF
Minogue et al. Arthritis Research & Therapy 2010, 12:R22
/>Page 14 of 20
Figure 3 Quantitative real-time PCR for (a) NP-specific and (b)
IVD-specific cell marker genes in bovine AC, AF and NP cells. Rela-
tive gene expression for (a) bovine nucleus pulposus (NP)-specific
marker genes (synaptosomal-associated protein, 25 kDa (SNAP25), cy-
tokeratin (KRT) 8, KRT18, KRT19, N-cadherin (CDH2), sclerostin domain
containing 1 (SOSTDC1) and integrin-binding sialoprotein (IBSP)), and
(b) intervertebral disc (IVD)-specific cell marker genes (tenomodulin
(TNMD), brain abundant, membrane attached signal protein 1 (BASP1),
tumor necrosis factor, alpha-induced protein 6 (TNFAIP6), forkhead
box F1 (FOXF1), forkhead box F2 (FOXF2), aquaporin (AQP1) and fibulin
1(FBLN1)), was normalised to the housekeeping gene, glyceraldehyde-
3-phosphate dehydrogenase (GAPDH) and plotted on a log scale. *
statistical significance between NP and annulus fibrosus (AF) cells and
NP and articular cartilage (AC) cells (P < 0.05). † statistical significance
between AF cells and AC cells (P < 0.05).
or AC cells (P < 0.0001), which correlated with the bovine
results.
Although the differential expression of TNMD seen in
bovine samples between NP and AF cells was preserved in
human samples (P < 0.05), the fold change was lower
(approximately 100-fold in bovine, and approximately 5-
fold in human). However, human AC cells showed expres-
sion of TNMD, which was absent from bovine AC samples.
BASP1 showed a similar pattern of expression in human
samples to that demonstrated by bovine cells, although
again fold changes were lower between AC and NP cells in
human samples than in bovine. Interestingly, in human AF
cells the levels of BASP1 expression were closer to those of
AC cells than NP cells. FOXF1 showed no difference in
expression between NP and AF cells, but both cell types
demonstrated significantly higher expression than did AC
cells (P < 0.0001). In contrast to the bovine samples, the
proposed IVD negative marker FBLN1 showed similar lev-
els of expression in both AF and AC cells, but significantly
lower expression in NP cells (P < 0.0001). In addition, T
was expressed in all three human cell types (Figure 5a) with
expression significantly higher in NP cells when compared
with both AC cells (P = 0.02) and AF cells (P = 0.004).
Gene expression in human degenerate IVD samples
For analysis of qRT-PCR data in human samples, the com-
parative (2
-ΔΔCt
) method was used to demonstrate differ-
ences in gene expression between normal and degenerate
cells (Figure 6). No significant differences in expression for
ACAN or COL2A1 were observed in degenerate samples
when compared with normal samples. Analysis of NP-spe-
cific marker genes in degenerate samples (Figure 6a)
showed a significant decrease in expression for SNAP25,
KRT8, KRT18 and CDH2 in degenerate NP cells when
Figure 4 Quantitative real-time PCR for (a) NP-specific and (b)
IVD-specific cell marker genes in separated bovine NP and NC
cells. Relative gene expression for (a) bovine nucleus pulposus (NP)-
specific marker genes (synaptosomal-associated protein, 25 kDa
(SNAP25), cytokeratin (KRT) 8, KRT18, KRT19, N-cadherin (CDH2) and
sclerostin domain containing 1 (SOSTDC1)) and the notochord (NC)
marker gene (T), and (b) intervertebral disc (IVD)-specific cell marker
genes (tenomodulin (TNMD), brain abundant, membrane attached
signal protein 1 (BASP1), tumor necrosis factor, alpha-induced protein
6 (TNFAIP6), forkhead box F1 (FOXF1), forkhead box F2 (FOXF2) and
aquaporin (AQP1)), was normalised to the housekeeping gene, glycer-
aldehyde-3-phosphate dehydrogenase (GAPDH) and plotted on a log
scale. * statistical significance between NP and NC cells (P < 0.05).
Minogue et al. Arthritis Research & Therapy 2010, 12:R22
/>Page 15 of 20
compared with normal NP cells (P = 0.0002, P = 0.0003, P
< 0.0001 and P = 0.0001, respectively). Only KRT18 was
significantly decreased in degenerate AF cells (P < 0.0001),
while KRT19 expression did not differ significantly in
degenerate NP or AF cells. For the IVD-specific marker
genes TNMD and BASP1 (Figure 6b) there were signifi-
cant increases in degenerate AF cells when compared with
normal AF cells (P = 0.03, and P < 0.0001, respectively).
Interestingly, the negative IVD marker gene (potentially an
AC marker) FBLN1 showed significant increases in expres-
sion in both degenerate AF cells (approximately 30 fold, P
< 0.0001) and NP cells (approximately 70 fold, P < 0.0001)
when compared with normal cells.
Discussion
NP cells of the IVD share a common lineage with articular
chondrocytes, with both cell types expressing the key chon-
drocyte genes collagen, type II, alpha 1 (COL2A1), aggre-
can (ACAN) and SRY (sex determining region Y)-box 9
(SOX-9) [11]. However, the distinctive function of the two
tissues is determined by the exact composition of the matri-
ces synthesised by their native cells. Evidence for this
comes from a study demonstrating that when chondrocytes
from elastic cartilage of rabbit ear were transplanted into
the NP of rabbit IVD the ECM formed was predominantly
hyaline cartilage, a tissue more solid than the normal NP,
which did not function adequately [38]. This implies that
for the proper functioning of a tissue engineered IVD it is
essential for the implanted cells to have the correct pheno-
Figure 6 Quantitative real-time PCR for (a) NP-specific and (b)
IVD-specific cell marker genes, in normal and degenerate human
AF and NP cells. Relative gene expression for (a) nucleus pulposus
(NP)-specific marker genes (synaptosomal-associated protein, 25 kDa
(SNAP25), cytokeratin (KRT) 8, KRT18, KRT19, N-cadherin (CDH2) and in-
tegrin-binding sialoprotein (IBSP)) and the notochord (NC) marker
gene (T), and (b) intervertebral disc (IVD)-specific cell marker genes
((tenomodulin (TNMD), brain abundant, membrane attached signal
protein 1 (BASP1), forkhead box F1 (FOXF1), and fibulin 1 (FBLN1)) and
the chondrogenic marker genes (aggrecan (ACAN) and type II collagen
(COL2A1)), was normalised to the housekeeping gene and normal an-
nulus fibrosus (AF) or NP cells and plotted on a log scale. For each gene,
expression in normal NP cells or AF cells was plotted on the baseline
(value = 1 +/-standard error) and the relative expression in NP or AF de-
generate cells (normalised to the relevant normal cell value) was plot-
ted adjacently. * statistical significance between normal and
degenerate NP cells (P < 0.05). † statistical significance between nor-
mal and degenerate AF cells (P < 0.05).
Figure 5 Quantitative real-time PCR for (a) NP-specific and (b)
IVD-specific cell marker genes in normal human AC, AF and NP
cells. Relative gene expression for (a) nucleus pulposus (NP)-specific
marker genes (synaptosomal-associated protein, 25 kDa (SNAP25), cy-
tokeratin (KRT) 8, KRT18, KRT19, N-cadherin (CDH2) and integrin-bind-
ing sialoprotein (IBSP)) and the notochord (NC) marker gene (T), and
(b) IVD-specific cell marker genes ((tenomodulin (TNMD), brain abun-
dant, membrane attached signal protein 1 (BASP1), forkhead box F1
(FOXF1), and fibulin 1 (FBLN1)) and the chondrogenic marker genes
(aggrecan (ACAN) and type II collagen (COL2A1)), was normalised to
the housekeeping gene and plotted on a log scale. * statistical signifi-
cance between NP and annulus fibrosus (AF) cells and NP and articular
cartilage (AC) cells (P < 0.05). † statistical significance between AF cells
and AC cells (P < 0.05).
Minogue et al. Arthritis Research & Therapy 2010, 12:R22
/>Page 16 of 20
type in order to manufacture a suitable ECM, that is one
that resembles the NP and not AC phenotype. However, to
date the exact phenotype of a NP cell is not known,
although two studies have attempted to elucidate differ-
ences in transcriptional profiles between these two cell
types in rats and dogs [23,24]. Here, we have used Affyme-
trix microarrays and qRT-PCR to identify genes that could
specifically distinguish bovine NP cells from articular
chondrocytes. Microarray results identified a number of
genes that were differentially expressed between NP or
IVD cells and AC cells. A small number of these genes
were then validated by qRT-PCR, which in general con-
firmed the microarray data, and although no clear on/off
marker was identified to distinguish a single cell type it
would appear that these novel markers could be used to
define a unique transcriptional profile/gene signature that
can distinguish NP cells from AC cells in bovines. In addi-
tion, analysis in human IVD cells revealed differences in
species cell-specific expression, as well as differential
expression and alterations with IVD degeneration. Never-
theless, sufficient similarities were identified which may
also enable the use of these gene markers to distinguish
between human AC and NP cells.
Microarray analysis revealed that typical chondrocyte
markers were expressed in all three bovine cell types stud-
ied, but that expression levels did not differ sufficiently to
distinguish NP cells from AC cells. Interestingly, however,
VCAN was expressed significantly higher in AF and NP
cells when compared with AC cells. This 87-fold difference
in VCAN expression between NP and AC compared with
the small fold differences in the other typical marker genes
highlights the potential of VCAN as a good marker for dif-
ferentiating these cell types and corroborates previous liter-
ature comparing VCAN content of AC and IVD tissues
[39].
The transcriptional profile of phenotypic markers (MMP-
2, HIF1A, GLUT-1 and VEGF) identified from studies
investigating the unique IVD environment [19-21] did not
appear to change significantly in bovine NP cells when
compared with AC cells. However, these markers were
originally identified from changes in protein expression and
it is possible that their differential expression is regulated at
the protein level and therefore differs to their transcriptional
profiles. Similarly, CD24 [22] was not found to be a useful
transcriptional NP marker for bovine cells because it was
expressed at a higher level in AC cells than either NP or AF
cells. With the exception of KRT18, KRT19 and PTN, the
genes identified in rat studies (GPC3, ANXA3, VIM,
COMP and MGP) and canine studies (A2M, ANXA4,
DSC2, NCAM1) did not show a substantial differential
expression in bovine NP cells compared with AC&AF
cells. Interestingly, PTN showed substantially higher
expression in AC&AF cells when compared with NP cells
(approximately 150 fold), contradicting the studies carried
out in the rat [23] where it was described as a potential NP
marker gene. Such data highlight both the unsuitability of
these genes as bovine NP cell markers and the considerable
differences that can be observed between the same cell
types in different species.
Due to the scale and complexity of cDNA microarray
technology it is inherently susceptible to both false-positive
and false-negative results. Consequently, microarray data
should always be interpreted with caution, especially in the
absence of corroborating qRT-PCR data. Two of the genes
in this study (ACAN and AQP1) highlight this problem
whereby the expression of these genes in AF cells was
detected at low levels in the microarray data, while the qRT-
PCR data showed expression of these genes at high levels
in AF cells. This is most likely due to insufficient hybridis-
ation of the cDNA to that particular array element or errors
in detection of the fluorescent signal of the array element.
Importantly, such data highlight the necessity to confirm
microarray results with qRT-PCR data, which is more reli-
able and quantitatively accurate. For this reason, genes of
interest were further verified using qRT-PCR.
Following comparison of NP/AF&AC cell gene expres-
sion from bovine microarrays, six potential NP marker
genes were identified and validated by qRT-PCR. KRT8
and KRT18 demonstrated the highest differential expres-
sion following microarray analysis, while KRT19 was
selected based on a previous rat array study [23], which
proposed it as a potential NP marker gene. Although below
the stringent threshold (100-fold) used in this study, KRT19
showed significantly higher expression in NP cells when
compared with both AC and AF cells (approximately 20-
fold). KRT18 is a type I cytokeratin, while KRT8 is a type
II keratin that typically dimerises with keratin 18 to form
intermediate filaments in the cytoplasm of cells. KRT19 is
also a type I cytokeratin but unlike its related family mem-
bers is not paired with a basic cytokeratin [40]. Members of
the cytokeratin family are typically expressed by epithelial
cells but are found in a wide range of tissues [41], including
the developing NC [42]. Additionally, they are known to be
expressed in tissues that are exposed to a fluid or semi-fluid
environment [43], suggesting a possible physiological role
in ECM homeostasis in the NP.
Our analysis of NP-specific genes also identified for the
first time three novel genes (SNAP25, CDH2 and
SOSTDC1) not previously reported in the IVD. All three of
these genes demonstrated the highest expression in NP cells
compared with either AF or AC cells suggesting they may
have a specific physiological function in the NP and thus
may be useful markers of cell type. Importantly, SNAP25
demonstrated no expression in bovine AC cells and high
differential expression between NP and AF cells. The role
SNAP25 may play in the NP is unknown, although it is
known to be involved in membrane fusion and exocytosis
in other tissues [44,45]. Although CDH2 has been previ-
Minogue et al. Arthritis Research & Therapy 2010, 12:R22
/>Page 17 of 20
ously shown to be important during mesenchymal conden-
sation and chondrogenesis [46,47], the reason for its
expression in mature chondrocytes and IVD cells is unclear.
SOSTDC1 has been shown to regulate BMP-7 signalling in
the kidney [48,49]. As BMP-7 has been shown to prevent
NP cell apoptosis [50] and stimulation with recombinant
BMP-7 is known to enhance PG production by NP cells
[51], SOSTDC1 may play an important role in regulating
ECM homeostasis and cell number within the IVD.
Following comparison of NP/AC cell gene expression
from bovine microarrays, six potential IVD marker genes
were identified, which were validated by qRT-PCR. Analy-
sis confirmed that all six genes (TNMD, BASP1, TNFAIP6,
FOXF1, FOXF2 and AQP1) showed significantly higher
expression in NP and AF cells than in AC cells. Only
BASP1 showed higher expression in NP cells than AF,
which has been shown to be expressed in a number of tis-
sues [52-55], although its role within cartilaginous tissues is
completely unknown. Importantly, only one of these genes
(TNMD) showed no expression in AC cells and given the
large differences between its expression in NP and AF cells,
TNMD may serve as a marker for the AF cell phenotype.
TNMD, is a type II transmembrane protein that shares simi-
larity in its structural configuration with chondromodulin-1
found in chondrocytes [56,57]. It is an anti-angiogenic mol-
ecule [58] that is predominantly expressed in dense connec-
tive tissues such as tendons and ligaments [57]. Its high
expression in the AF, which is a ligamentous tissue, may
thus act to inhibit vascular ingrowth into this normally
avascular tissue. TNFAIP6 (also known as TNFα-stimu-
lated gene product-6), a molecule expressed in response to
inflammatory mediators, has previously been identified in
IVD cells where it has been proposed to be involved in
ECM homeostasis [59]. Interestingly, the study also high-
lighted that TNFAIP6 expression in CEPs, a tissue similar
to AC, was lower than that seen in either NP or AF cells.
Our expression data showed lower expression in AC cells
than either NP or AF cells, thus supporting these earlier
findings. The genes FOXF1 and FOXF2 showed similar
patterns and levels of expression in both NP and AF cells,
with lower expression in AC cells. These genes belong to
the forkhead family of transcription factors, which have
been shown to be involved in cell growth, proliferation, dif-
ferentiation and longevity [60-62] However, this is the first
study to identify their expression within cells of the IVD
and therefore their exact roles are yet to be elucidated.
AQP-1, previously shown to be expressed by articular
chondrocytes [63] and cells of the human IVD [64], where
it is believed to act as a bi-directional transmembrane water
transport channel, was shown to be expressed more highly
in AF cells and NP cells when compared with AC cells,
when assessed using qRT-PCR. In contrast, the microarray
data showed AQP1 at lower levels in AF cells compared
with the other two cell types, which highlights both the sus-
ceptibility of microarrays to false-negative results and the
importance of confirming microarray results with qRT-
PCR.
This study also identified genes that may serve as NP
negative (IBSP) or IVD cell negative (FBLN1) markers, in
that microarray data showed higher expression in AC cells
compared with either NP or AF cells. qRT-PCR validation
of IBSP showed similar levels of expression in AF and AC
cells, but significantly lower expression in NP cells, thus
confirming its potential as a negative NP cell marker. IBSP
has also been identified as a potential AC marker gene in a
rat microarray study where it showed higher expression lev-
els in AC cells than NP cells [23] but was not further char-
acterised. Validation of FBLN1 also confirmed its potential
as a negative IVD cell marker, because its expression was
significantly higher in AC cells than in either NP or AF
cells.
The identification of NC cells in bovine NP tissue led us
to experimentally determine whether the identified NP and
IVD markers were expressed either in the smaller chondro-
cyte-like NP cells or the larger (>15 μm) NC cell popula-
tion. The two cell types were isolated as previously
described on the basis of size [16,65] and the marker genes
detected by qRT-PCR along with the molecular NC marker,
T [36,37]. The protein encoded by the T gene is an embry-
onic nuclear transcription factor that binds to a specific
DNA element, the palindromic T-site. It binds through a
region in its N-terminus, called the T-box, and effects tran-
scription of genes required for mesoderm formation and
differentiation. The protein is localised to notochord-
derived cells where it is thought to mediate cartilage devel-
opment in the developing embryo, and also in chordomas,
which are believed to arise from cells derived from the
notochord [66]. Expression of T in the larger cell popula-
tion, together with KRT8, KRT18 and KRT19, previously
reported to be expressed by notochordal cells [42], suggests
that these larger isolated cells are indeed of notochordal ori-
gin. Subsequent expression data showed that the NP and
IVD genes were expressed by both cell types, with NP
marker genes being more highly expressed in the larger NC
cells than NP cells and IVD marker genes being higher in
NP cells than NC cells. However, differences in expression
of these genes between the two cells types was never
greater than approximately 10-fold. It has been suggested
that the disappearance of NC cells in the mature NP could
be due to the differentiation of NC cells towards a chondro-
cyte-like NP cell and a recent study in mice lends some
compelling evidence that all cell types in the adult NP are
derived from the NC [67]. Furthermore direct differentia-
tion of NC cells to NP cells has been recently demonstrated
in vitro using rabbit cells [65]. Importantly the expression
of T, KRT8, KRT18 and KRT19 in the smaller NP cells
themselves not only confirms these genes as markers of an
NP cell but also suggests that these cells are either directly
Minogue et al. Arthritis Research & Therapy 2010, 12:R22
/>Page 18 of 20
derived from NC cells or that their molecular phenotype is
significantly influenced by them. Interestingly, T was also
shown to be differentially expressed in human NP cells
when compared with AC and AF cells demonstrating the
possibility of a similar origin for human NP cells.
Expression of a subset of the validated bovine markers
genes (KRT8, 18, 19 SNAP25, CDH2, TNMD, BASP1,
FOXF1, IBSP and FBLN 1) was analysed in human cells.
Expression of these genes in NP, AF and AC cells was dem-
onstrated, although levels of differential gene expression
were reduced between the different cell types. Furthermore,
there were also differences in cell-specific gene expression;
notably, SNAP 25 and TNMD were expressed by human
AC cells and FBLN 1 was expressed by human AF cells at
levels very similar to those observed in AC cells. These
notable differences in the expression of the NP and IVD
markers between bovine and human samples could be
explained by interspecies variation, linked to differences in
physical or local environmental influences, which have
been previously highlighted between rat and canine sam-
ples. For example, in addition to the presence of a small
population of notochordal cells in young bovine caudal
discs, there are also differences in the nutritional and
mechanical conditions, which may influence specific gene
expression. Furthermore, it is also important to take into
account any age-related differences that exist between the
two species. Cells harvested from the bovine caudal discs
were from animals between 18 months and 3 years old,
whereas cells harvested from human samples were from
individuals between 45 and 60 years old. Therefore the pro-
file observed in bovine samples may be more indicative of
younger cells. Bovine IVD possess an NP ECM which is
more PG-rich (and hence has a higher hydration state) than
older, more fibrous (and consequently more dehydrated)
human discs [68-70], which may also contribute to differ-
ences in gene expression profiles between the two species.
As such, the genes identified from the bovine array may be
indicative of those genes required to generate a more
'hydrogel'-like ECM, rather than the more fibrous NP tissue
found in adult aged human discs. Another important con-
sideration that needs to be taken into account is that
although articular chondrocytes were isolated from macro-
scopically and histologically 'normal' regions of cartilage,
the cartilage was obtained from joints of patients with
osteoarthritis. It is therefore possible that the human AC
gene expression profiles could have been altered compared
with non-osteoarthritis individuals. Therefore, further stud-
ies using either younger human tissues and/or older bovine
tissues would be valuable in providing further insight into
the effects of age and species on the expression of these
gene markers.
Degenerate human NP showed significant decreases in
the proposed NP marker genes compared with normal cells,
while only KRT18 showed a significant decrease in degen-
erate AF cells. The fact that the majority of the NP markers
showed lower differential expression in human tissues than
bovine NP and further decreases in degenerate NP cells
supports the argument that these genes could be more char-
acteristic of a young healthy, hydrated IVD. The IVD
marker genes TNMD and BASP1 demonstrated increased
expression in degenerate AF cells suggesting that they may
be involved in one of the many cellular/tissue events char-
acterising the degenerate IVD. Interestingly, levels of
FBLN1 (negative IVD cell marker) were significantly
increased in both degenerate NP and AF cells. FBLN1 has
been shown to bind to ACAN and VCAN [71] as well as a
disintegrin-like and metallopeptidase with thrombospondin
type 1 motif, 1 (ADAMTS-1), enhancing its capacity to
cleave ACAN [72] and it is therefore a regulator of
ADAMTS-1-mediated PG proteolysis. As ADAMTS-1 has
been shown to be upregulated in IVD degeneration [73], it
is possible that the increased expression in FBLN1 may be
responsible for, or as a response to, changes in the ECM
composition seen in degenerate IVDs.
Conclusions
In summary, this study has identified a number of novel
genes that characterise the bovine NP and IVD cell pheno-
types. Although SNAP25 and TNMD may be good markers
of bovine NP cells and IVD cells, respectively, given their
lack of expression in AC cells, their expression in human
AC cells highlights the problems associated with inter-spe-
cies variation in identifying a single unique NP or IVD cell
marker gene. It may therefore be more beneficial to utilise a
panel of marker genes, such as those identified here, to dif-
ferentiate between the different cell types. In fact, the simi-
larity in expression of the IVD marker FOXF1 and the AC
marker IBSP between the two species suggests that there
are sufficient similarities to merit such an approach. How-
ever, for definitive characterisation of a human NP cell or
IVD cell phenotype human microarray studies need to be
undertaken, validated and also correlated with protein
expression to produce a comprehensive molecular signature
that will enable researchers to distinguish an NP cell from
its closely related AC cell. Achieving this would signifi-
cantly advance the realisation of tissue engineering strate-
gies that attempt to differentiate MSCs or other progenitor
cells towards an NP phenotype.
Abbreviations
A2M: α-2-macroglobulin; AC: articular cartilage; ACAN: aggrecan; AF: annulus
fibrosus; ANOVA: analysis of variance; ANXA4: annexin A4; AQP1: aquaporin;
BASP1: brain abundant: membrane attached signal protein 1; CDH2: N-cad-
herin; CEP: cartilaginous end plates; COL2A1: type II collagen; COL10A1: colla-
gen type X, alpha 1; COMP: cartilage oligomeric matrix protein; DSC:
desmocollin 2; ECM: extracellular matrix; FBLN1: fibulin 1; fdr: false discovery
rate; FOXF1: forkhead box F1; FOXF2: forkhead box F2; GLUT1: glucose trans-
porter type 1; GPC: glypican; H&E: hematoxylin and eosin; HIF1: hypoxia induc-
ible factor 1 isoforms; HSPS: high salt precipitation solution; IBSP: integrin-
binding sialoprotein; IVD: intervertebral disc; KRT: cytokeratin; LBP: low back
pain; MGP: matrix Gla protein; MMP: matrix metalloproteinase; MSCs: mesen-
Minogue et al. Arthritis Research & Therapy 2010, 12:R22
/>Page 19 of 20
chymal stem cells; NC: notochord; NCAM1: neural cell adhesion molecule; NP:
nucleus pulposus; PCA: principal component analysis; PG: proteoglycan; PPLR:
probability of positive log-ratio; PTN: pleiotrophin; qRT-PCR: quantitative real-
time polymerase chain reaction; RIN: RNA integrity number; SNAP25: synapto-
somal-associated protein, 25 kDa; SOSTDC1: sclerostin domain containing 1; T:
brachyury homolog; TNFAIP6: tumor necrosis factor, alpha-induced protein 6;
TNMD: tenomodulin; VCAN: versican; VEGF: vascular endothelial growth factor;
VIM: vimentin.
Competing interests
The authors declare that they have no competing interests.
Authors' contributions
BMM was responsible for the study design, performed all tissue sample prepa-
ration, molecular studies, data analysis, and drafted the manuscript. SMR par-
ticipated in the study design and coordination, analysis of results and helped
to draft the manuscript. LAHZ helped in the design, analysis, interpretation and
presentation of the microarray data. AJF participated in its design and coordi-
nation and analysis of results. JAH conceived the study, secured funding, par-
ticipated in its design and coordination, analysis of results and co-wrote the
manuscript. All authors read and approved the final manuscript.
Acknowledgements
Array analyses were performed by the Microarray and Bioinformatics Core
Facilities in the Faculty of Life Sciences, University of Manchester. This research
was funded by the Arthritis Research Campaign (Grant ref No:18046). The Inter-
vertebral Disc Research Group within Tissue Injury and Repair is supported by
the Manchester Academic Health Sciences Centre (MAHSC) and the NIHR Man-
chester Biomedical Research Centre.
Author Details
1
Tissue Injury and Repair, School of Biomedicine, Faculty of Medical and
Human Sciences, University of Manchester, Oxford Road, Manchester, M13 9PT,
UK and
2
Faculty of Life Sciences, Michael Smith Building, University of
Manchester, Oxford Road, Manchester, M13 9PT, UK
References
1. Walker BF: The prevalence of low back pain: a systematic review of the
literature from 1966 to 1998. J Spinal Disord 2000, 13:205-217.
2. Maniadakis N, Gray A: The economic burden of back pain in the UK.
Pain 2000, 84:95-103.
3. Cheung KM, Karppinen J, Chan D, Ho DW, Song YQ, Sham P, Cheah KS,
Leong JC, Luk KD: Prevalence and pattern of lumbar magnetic
resonance imaging changes in a population study of one thousand
forty-three individuals. Spine (Phila Pa 1976 ) 2009, 34:934-940.
4. Hiyama A, Mochida J, Iwashina T, Omi H, Watanabe T, Serigano K, Tamura
F, Sakai D: Transplantation of mesenchymal stem cells in a canine disc
degeneration model. J Orthop Res 2008, 26:589-600.
5. Richardson SM, Walker RV, Parker S, Rhodes NP, Hunt JA, Freemont AJ,
Hoyland JA: Intervertebral disc cell-mediated mesenchymal stem cell
differentiation. Stem Cells 2006, 24:707-716.
6. Richardson SM, Hughes N, Hunt JA, Freemont AJ, Hoyland JA: Human
mesenchymal stem cell differentiation to NP-like cells in chitosan-
glycerophosphate hydrogels. Biomaterials 2008, 29:85-93.
7. Risbud MV, Albert TJ, Guttapalli A, Vresilovic EJ, Hillibrand AS, Vaccaro AR,
Shapiro IM: Differentiation of mesenchymal stem cells towards a
nucleus pulposus-like phenotype in vitro: implications for cell-based
transplantation therapy. Spine (Phila Pa 1976 ) 2004, 29:2627-2632.
8. Sakai D, Mochida J, Iwashina T, Watanabe T, Nakai T, Ando K, Hotta T:
Differentiation of mesenchymal stem cells transplanted to a rabbit
degenerative disc model: potential and limitations for stem cell
therapy in disc regeneration. Spine (Phila Pa 1976 ) 2005, 30:2379-2387.
9. Steck E, Bertram H, Abel R, Chen B, Winter A, Richter W: Induction of
intervertebral disc-like cells from adult mesenchymal stem cells. Stem
Cells 2005, 23:403-411.
10. Trout JJ, Buckwalter JA, Moore KC: Ultrastructure of the human
intervertebral disc: II. Cells of the nucleus pulposus. Anat Rec 1982,
204:307-314.
11. Sive JI, Baird P, Jeziorsk M, Watkins A, Hoyland JA, Freemont AJ: Expression
of chondrocyte markers by cells of normal and degenerate
intervertebral discs. Mol Pathol 2002, 55:91-97.
12. Humzah MD, Soames RW: Human intervertebral disc: structure and
function. Anat Rec 1988, 220:337-356.
13. Trout JJ, Buckwalter JA, Moore KC, Landas SK: Ultrastructure of the
human intervertebral disc. I. Changes in notochordal cells with age.
Tissue Cell 1982, 14:359-369.
14. Buckwalter JA: Aging and degeneration of the human intervertebral
disc. Spine (Phila Pa 1976 ) 1995, 20:1307-1314.
15. Aguiar DJ, Johnson SL, Oegema TR: Notochordal cells interact with
nucleus pulposus cells: regulation of proteoglycan synthesis. Exp Cell
Res 1999, 246:129-137.
16. Cappello R, Bird JL, Pfeiffer D, Bayliss MT, Dudhia J: Notochordal cell
produce and assemble extracellular matrix in a distinct manner, which
may be responsible for the maintenance of healthy nucleus pulposus.
Spine (Phila Pa 1976 ) 2006, 31:873-882.
17. Erwin WM, Inman RD: Notochord cells regulate intervertebral disc
chondrocyte proteoglycan production and cell proliferation. Spine
(Phila Pa 1976) 2006, 31:1094-1099.
18. Mwale F, Roughley P, Antoniou J: Distinction between the extracellular
matrix of the nucleus pulposus and hyaline cartilage: a requisite for
tissue engineering of intervertebral disc. Eur Cell Mater 2004, 8:58-63.
19. Fujita N, Imai J, Suzuki T, Yamada M, Ninomiya K, Miyamoto K, Iwasaki R,
Morioka H, Matsumoto M, Chiba K, Watanabe S, Suda T, Toyama Y,
Miyamoto T: Vascular endothelial growth factor-A is a survival factor for
nucleus pulposus cells in the intervertebral disc. Biochem Biophys Res
Commun 2008, 372:367-372.
20. Rajpurohit R, Risbud MV, Ducheyne P, Vresilovic EJ, Shapiro IM:
Phenotypic characteristics of the nucleus pulposus: expression of
hypoxia inducing factor-1, glucose transporter-1 and MMP-2. Cell
Tissue Res 2002, 308:401-407.
21. Risbud MV, Guttapalli A, Stokes DG, Hawkins D, Danielson KG, Schaer TP,
Albert TJ, Shapiro IM: Nucleus pulposus cells express HIF-1 alpha under
normoxic culture conditions: a metabolic adaptation to the
intervertebral disc microenvironment. J Cell Biochem 2006, 98:152-159.
22. Fujita N, Miyamoto T, Imai J, Hosogane N, Suzuki T, Yagi M, Morita K,
Ninomiya K, Miyamoto K, Takaishi H, Matsumoto M, Morioka H, Yabe H,
Chiba K, Watanabe S, Toyama Y, Suda T: CD24 is expressed specifically in
the nucleus pulposus of intervertebral discs. Biochem Biophys Res
Commun 2005, 338:1890-1896.
23. Lee CR, Sakai D, Nakai T, Toyama K, Mochida J, Alini M, Grad S: A
phenotypic comparison of intervertebral disc and articular cartilage
cells in the rat. Eur Spine J 2007, 16:2174-2185.
24. Sakai D, Nakai T, Mochida J, Alini M, Grad S: Differential phenotype of
intervertebral disc cells: microarray and immunohistochemical analysis
of canine nucleus pulposus and anulus fibrosus. Spine (Phila Pa 1976 )
2009, 34:1448-1456.
25. Oshima H, Ishihara H, Urban JP, Tsuji H: The use of coccygeal discs to
study intervertebral disc metabolism. J Orthop Res 1993, 11:332-338.
26. Bolstad BM, Irizarry RA, Astrand M, Speed TP: A comparison of
normalization methods for high density oligonucleotide array data
based on variance and bias. Bioinformatics 2003, 19:185-193.
27. Sanguinetti G, Milo M, Rattray M, Lawrence ND: Accounting for probe-
level noise in principal component analysis of microarray data.
Bioinformatics 2005, 21:3748-3754.
28. Liu X, Milo M, Lawrence ND, Rattray M: A tractable probabilistic model
for Affymetrix probe-level analysis across multiple chips. Bioinformatics
2005, 21:3637-3644.
29. Storey JD, Tibshirani R: Statistical significance for genomewide studies.
Proc Natl Acad Sci USA 2003, 100:9440-9445.
30. MIAME [ />31. Mankin HJ, Dorfman H, Lippiello L, Zarins A: Biochemical and metabolic
abnormalities in articular cartilage from osteo-arthritic human hips. II.
Correlation of morphology with biochemical and metabolic data. J
Bone Joint Surg Am 1971, 53:523-537.
32. Thomas CM, Fuller CJ, Whittles CE, Sharif M: Chondrocyte death by
apoptosis is associated with cartilage matrix degradation.
Osteoarthritis Cartilage 2007, 15:27-34.
Received: 14 August 2009 Revisions Requested: 28 September 2009
Revised: 13 November 2009 Accepted: 11 February 2010 Published: 11
February 2010
This article is available from: 2010 Minogue et al.; licensee BioMed Central Ltd. This is an open access article distributed under the terms of the Creative Commons Attribution License ( which permits unrestricted use, distribution, and reproduction in any medium, provided the original work is properly cited.Arthritis R esearch & Therapy 2010, 12:R22
Minogue et al. Arthritis Research & Therapy 2010, 12:R22
/>Page 20 of 20
33. Livak KJ, Schmittgen TD: Analysis of relative gene expression data using
real-time quantitative PCR and the 2(-Delta Delta C(T)) Method.
Methods 2001, 25:402-408.
34. Richardson SM, Curran JM, Chen R, Vaughan-Thomas A, Hunt JA,
Freemont AJ, Hoyland JA: The differentiation of bone marrow
mesenchymal stem cells into chondrocyte-like cells on poly-L-lactic
acid (PLLA) scaffolds. Biomaterials 2006, 27:4069-4078.
35. Liu X, Lin KK, Andersen B, Rattray M: Including probe-level uncertainty in
model-based gene expression clustering. BMC Bioinformatics 2007,
8:98.
36. Edwards YH, Putt W, Lekoape KM, Stott D, Fox M, Hopkinson DA, Sowden
J: The human homolog T of the mouse T(Brachyury) gene; gene
structure, cDNA sequence, and assignment to chromosome 6q27.
Genome Res 1996, 6:226-233.
37. Wilkinson DG, Bhatt S, Herrmann BG: Expression pattern of the mouse T
gene and its role in mesoderm formation. Nature 1990, 343:657-659.
38. Gorensek M, Jaksimovic C, Kregar-Velikonja N, Gorensek M, Knezevic M,
Jeras M, Pavlovcic V, Cor A: Nucleus pulposus repair with cultured
autologous elastic cartilage derived chondrocytes. Cell Mol Biol Lett
2004, 9:363-373.
39. Sztrolovics R, Grover J, Cs-Szabo G, Shi SL, Zhang Y, Mort JS, Roughley PJ:
The characterization of versican and its message in human articular
cartilage and intervertebral disc. J Orthop Res 2002, 20:257-266.
40. Moll R, Franke WW, Schiller DL, Geiger B, Krepler R: The catalog of human
cytokeratins: patterns of expression in normal epithelia, tumors and
cultured cells. Cell 1982, 31:11-24.
41. Ku NO, Zhou X, Toivola DM, Omary MB: The cytoskeleton of digestive
epithelia in health and disease. Am J Physiol 1999, 277:G1108-G1137.
42. Gotz W, Kasper M, Fischer G, Herken R: Intermediate filament typing of
the human embryonic and fetal notochord. Cell Tissue Res 1995,
280:455-462.
43. Omary MB, Ku NO, Liao J, Price D: Keratin modifications and solubility
properties in epithelial cells and in vitro. Subcell Biochem 1998,
31:105-140.
44. Sollner T, Bennett MK, Whiteheart SW, Scheller RH, Rothman JE: A protein
assembly-disassembly pathway in vitro that may correspond to
sequential steps of synaptic vesicle docking, activation, and fusion.
Cell 1993, 75:409-418.
45. Sollner T, Whiteheart SW, Brunner M, Erdjument-Bromage H, Geromanos
S, Tempst P, Rothman JE: SNAP receptors implicated in vesicle targeting
and fusion. Nature 1993, 362:318-324.
46. Oberlender SA, Tuan RS: Spatiotemporal profile of N-cadherin
expression in the developing limb mesenchyme. Cell Adhes Commun
1994, 2:521-537.
47. Oberlender SA, Tuan RS: Expression and functional involvement of N-
cadherin in embryonic limb chondrogenesis. Development 1994,
120:177-187.
48. Blish KR, Wang W, Willingham MC, Du W, Birse CE, Krishnan SR, Brown JC,
Hawkins GA, Garvin AJ, D'Agostino RB Jr, Torti FM, Torti SV: A human bone
morphogenetic protein antagonist is down-regulated in renal cancer.
Mol Biol Cell 2008, 19:457-464.
49. Turk T, Leeuwis JW, Gray J, Torti SV, Lyons KM, Nguyen TQ, Goldschmeding
R: BMP signaling and podocyte markers are decreased in human
diabetic nephropathy in association with CTGF overexpression. J
Histochem Cytochem 2009, 57:623-631.
50. Wei A, Brisby H, Chung SA, Diwan AD: Bone morphogenetic protein-7
protects human intervertebral disc cells in vitro from apoptosis. Spine J
2008, 8:466-474.
51. Imai Y, Miyamoto K, An HS, Thonar EJ, Andersson GB, Masuda K:
Recombinant human osteogenic protein-1 upregulates proteoglycan
metabolism of human anulus fibrosus and nucleus pulposus cells.
Spine (Phila Pa 1976) 2007, 32:1303-1309.
52. Bagchi M, Kousis S, Maisel H: BASP1 in the lens. J Cell Biochem 2008,
105:699-702.
53. Iino S, Kobayashi S, Maekawa S: Immunohistochemical localization of a
novel acidic calmodulin-binding protein, NAP-22, in the rat brain.
Neuroscience 1999, 91:1435-1444.
54. Mosevitskii MI, Caponi JP, Skladchikova GI, Novitskaia VA, Plekhanov AI:
[Specific properties and primary structure of BASP1 protein, initially
detected in neuronal axonal terminals]. Biokhimiia 1996, 61:1209-1220.
55. Bogaerdt AJ Van den, El GA, Hensbergen PJ, Reijnen L, Verkerk M, Kroon-
Smits M, Middelkoop E, Ulrich MM: Differential expression of CRABP-II in
fibroblasts derived from dermis and subcutaneous fat. Biochem
Biophys Res Commun 2004, 315:428-433.
56. Hiraki Y, Tanaka H, Inoue H, Kondo J, Kamizono A, Suzuki F: Molecular
cloning of a new class of cartilage-specific matrix, chondromodulin-I,
which stimulates growth of cultured chondrocytes. Biochem Biophys
Res Commun 1991, 175:971-977.
57. Shukunami C, Oshima Y, Hiraki Y: Molecular cloning of tenomodulin, a
novel chondromodulin-I related gene. Biochem Biophys Res Commun
2001, 280:1323-1327.
58. Oshima Y, Sato K, Tashiro F, Miyazaki J, Nishida K, Hiraki Y, Tano Y,
Shukunami C: Anti-angiogenic action of the C-terminal domain of
tenomodulin that shares homology with chondromodulin-I. J Cell Sci
2004, 117:2731-2744.
59. Roberts S, Evans H, Menage J, Urban JP, Bayliss MT, Eisenstein SM, Rugg
MS, Milner CM, Griffin S, Day AJ: TNFalpha-stimulated gene product
(TSG-6) and its binding protein, IalphaI, in the human intervertebral
disc: new molecules for the disc. Eur Spine J 2005, 14:36-42.
60. Kalinichenko VV, Zhou Y, Bhattacharyya D, Kim W, Shin B, Bambal K, Costa
RH: Haploinsufficiency of the mouse Forkhead Box f1 gene causes
defects in gall bladder development. J Biol Chem 2002,
277:12369-12374.
61. Mahlapuu M, Ormestad M, Enerback S, Carlsson P: The forkhead
transcription factor Foxf1 is required for differentiation of extra-
embryonic and lateral plate mesoderm. Development 2001,
128:155-166.
62. Ormestad M, Astorga J, Landgren H, Wang T, Johansson BR, Miura N,
Carlsson P: Foxf1 and Foxf2 control murine gut development by
limiting mesenchymal Wnt signaling and promoting extracellular
matrix production. Development 2006, 133:833-843.
63. Mobasheri A, Marples D: Expression of the AQP-1 water channel in
normal human tissues: a semiquantitative study using tissue
microarray technology. Am J Physiol Cell Physiol 2004, 286:C529-C537.
64. Richardson SM, Knowles R, Marples D, Hoyland JA, Mobasheri A:
Aquaporin expression in the human intervertebral disc. J Mol Histol
2008, 39:303-309.
65. Kim JH, Deasy BM, Seo HY, Studer RK, Vo NV, Georgescu HI, Sowa GA, Kang
JD: Differentiation of intervertebral notochordal cells through live
automated cell imaging system in vitro. Spine (Phila Pa 1976 ) 2009,
34(23):2486-2493.
66. Vujovic S, Henderson S, Presneau N, Odell E, Jacques TS, Tirabosco R,
Boshoff C, Flanagan AM: Brachyury, a crucial regulator of notochordal
development, is a novel biomarker for chordomas. J Pathol 2006,
209:157-165.
67. Choi KS, Cohn MJ, Harfe BD: Identification of nucleus pulposus
precursor cells and notochordal remnants in the mouse: implications
for disk degeneration and chordoma formation. Dev Dyn 2008,
237:3953-3958.
68. Demers CN, Antoniou J, Mwale F: Value and limitations of using the
bovine tail as a model for the human lumbar spine. Spine (Phila Pa 1976)
2004, 29:2793-2799.
69. Sivan S, Merkher Y, Wachtel E, Ehrlich S, Maroudas A: Correlation of
swelling pressure and intrafibrillar water in young and aged human
intervertebral discs. J Orthop Res 2006, 24:1292-1298.
70. Urban JP, McMullin JF: Swelling pressure of the lumbar intervertebral
discs: influence of age, spinal level, composition, and degeneration.
Spine (Phila Pa 1976) 1988, 13:179-187.
71. Aspberg A, Adam S, Kostka G, Timpl R, Heinegard D: Fibulin-1 is a ligand
for the C-type lectin domains of aggrecan and versican. J Biol Chem
1999, 274:20444-20449.
72. Lee NV, Rodriguez-Manzaneque JC, Thai SN, Twal WO, Luque A, Lyons KM,
Argraves WS, Iruela-Arispe ML: Fibulin-1 acts as a cofactor for the matrix
metalloprotease ADAMTS-1. J Biol Chem 2005, 280:34796-34804.
73. Pockert AJ, Richardson SM, Le Maitre CL, Lyon M, Deakin JA, Buttle DJ,
Freemont AJ, Hoyland JA: Modified expression of the ADAMTS enzymes
and tissue inhibitor of metalloproteinases 3 during human
intervertebral disc degeneration. Arthritis Rheum 2009, 60:482-491.
doi: 10.1186/ar2929
Cite this article as: Minogue et al., Transcriptional profiling of bovine inter-
vertebral disc cells: implications for identification of normal and degenerate
human intervertebral disc cell phenotypes Arthritis Research & Therapy 2010,
12:R22