Báo cáo y học: " Quantification of lung surface area using computed tomography" pptx
Bạn đang xem bản rút gọn của tài liệu. Xem và tải ngay bản đầy đủ của tài liệu tại đây (1.21 MB, 9 trang )
Quantification of lung surface area using
computed tomography
Yuan et al.
Yuan et al. Respiratory Research 2010, 11:153
(31 October 2010)
RESEARC H Open Access
Quantification of lung surface area using
computed tomography
Ren Yuan
1,2
, Taishi Nagao
1
, Peter D Paré
1,3
, James C Hogg
1,4
, Don D Sin
1
, Mark W Elliott
1
, Leanna Loy
1
, Li Xing
1
,
Steven E Kalloger
1
, John C English
5
, John R Mayo
2
, Harvey O Coxson
1,2*
Abstract
Objective: To refine the CT prediction of emphysema by comparing histology and CT for specific regions of lung.
To incorporate both regional lung density measured by CT and cluster analysis of low attenuation areas for
comparison with histological measurement of surface area per unit lung volume.
Methods: The histological surface area per unit lung volume was estimated for 140 samples taken from resecte d
lung specimens of fourteen subjects. The region of the lung sampled for histology was located on the pre-
operative CT scan; the regional CT median lung density and emphysematous lesion size were calculated using the
X-ray attenuation values and a low attenuation cluster analysis. Linear mixed models were used to examine the
relationships between histological surface area per unit lung volume and CT measures.
Results: The median CT lung density, low attenuation cluster analysis, and the combination of both were
important predictors of surface area per unit lung volume measured by histology (p < 0.0001). Akaike’s information
criterion showed the model incorporating both parameters provided the most accurate prediction of emphysema.
Conclusion: Combining CT measures of lung density and emphysematous lesion size provides a more accurate
estimate of lung surface area per unit lung volume than either measure alone.
Background
The major pathological components responsible for the
decrease in maximal expiratory flow that characterize
Chronic Obstructive Pulmonary Disease (COPD) include
an increase in airway resistance due to small airw ay
remodeling and obliteration, and a decrease in elastic
recoil secondary to the parenchymal tissue destruction
which characterizes emphysema [1-3]. Separating the
contribution of each of these two components can pro-
vide better understanding of the natural history of dis-
ease, allow monitoring of disease progression, evaluate
the impact of a therapeutic intervention and potentially
guide the most appropriate therapeutic target in indivi-
dual patients. The fact that pulmonary function tests
cannot separate these structural changes [4], and
because pathological estimates can only do so in surgical
or postmortem specimens, has led to attempts to use
chest CT scans to measure these changes in vivo.
A number of quantitative CT lung densitometry mea-
surements have been empl oyed to measure the extent of
emphysema including, 1) the relative area of lung with
attenuation val ues lower than variou s thresholds [5-10],
2) a specific percentile point on the frequency-attenua-
tion distribution curve [8,9,11], and 3) median lung
inflation [12]. However, measurement of lung density
may not be the most efficient way to detect emphysema
if tissue destruction is accompanied by “remodeling” of
the lung parenchyma, such as fibrosis [13-15]. Mishima
was the first to introduce cluster analysis of low attenua-
tion areas - a method to measure the size distribution of
low attenuation regions [16]. Although validat ion of this
parameter against pathologic standards is controversial
[8], we postulated that cluster analysis would supple-
ment lung densitometry in the detection and qu antifica-
tion of emphysema since it is less likely to be affected
by tissue deposition.
In the present study, we tested the relationship between
the histopathologic reference standard for emphysema -
airspace surface area per unit lung volume (SA/V), and
two CT measurements: CT lung densitometry (median
* Correspondence:
1
University of British Columbia James Hogg Research Centre and the Heart
and Lung Institute, St. Paul’s Hospital; Burrard Street, Va ncouver, Canada
Full list of author information is available at the end of the article
Yuan et al. Respiratory Research 2010, 11:153
/>© 2010 Yuan et al; licensee BioMed Central Ltd. This is an Open Access article distributed under the terms of the Creative Commons
Attribution License ( nses/by/2.0), which permits unrestricted use, distribution, and reproduction in
any medium, provided the original work is properly cited .
lung density) and CT cluster analysis. We hypothesized
that the combination of the two CT measurements will
be superior to the s ole use of either in the prediction o f
SA/V.
Methods
Subject Selection
Fourteen subjects (9 men, 5 women) were included in
thepresentstudy(Table1).Tenpatientsunderwent
lobectomy and four underwent pneumonectomy for
lung cancers. Preoperatively, all subject s had spirom etry
measurements and the diffusing capacity (DLco) was
measured by the single-breath method of Miller and
associates [17]. The study was approved by the hospital
and university ethical review boards and all subjects
provided written informed consent for the use of all
materials and data.
CT Technique
All subjects received a pre-operative, non-contrast heli-
cal CT scan in the supine position at the end of full
inspiration. 11 subj ects were scanned using a GE Light-
Speed Ultra CT scanner (Gene ral Electric Medical Sys-
tems, Milwaukee, WI) with the follo wing settings: 120
kVp, 114 mAs, and 5 mm slices thickness; and 3 sub-
jects were scanned using a Siemens Sensation 16 CT
scanner (Siemens Medical Sol utions; Erlangen, Ger-
many) with the following parameters: 120 kVp, 115
mAs, and 5 mm slic e thickness. The scann ers were cali-
brated regular ly using standard water and air phantoms
to allow for comparisons between individuals and
between scanners.
Quantitative Histology
Following surgery, the resected specimen was trans-
ferred directly from the operating room to the labora-
tory. The specimen was inflated with Bouin fixative at a
constant distending pressure of 25 cm of water a nd
immersed in formalin overnight. After fixation, each
specimen was cut into ten slices with 5-8 mm thickness
in the axial plane and photographed using a digital cam-
era (Nikon Coolpix, Nikon Corp., Japan). A grid of 2 ×
2 cm squares was superimposed over each lung slice,
one square was randomly selected and the tissue
beneath it was excised, embedded in paraffin, sectioned
and stained with haematoxylin and eosin, which resulted
in 140 tissue samples in total. Ten random images per
histology section were captured using a light microscope
(Nikon Microphot) equipped with a digital camera
(JVC3-CCD KY F-70, Diagnostic Instruments). The digi-
tal images were analyzed using stereologic techniques
and a custom program written for Image P ro Plus® digi-
tal-image-analysis software (Media Cybernetics) as
describ ed elsewhere [18]. Briefly, each image was binar-
ized and a grid of lines was superimposed on the image.
The program automatically counts the number of inter-
sections between the superimposed lines and the alveo-
lar walls (i.e., tissue-air interface), the number of line
endpoints in one image (i.e., ΣP total), as well as the
number of line endpoints that fall on tissue (i.e., ΣPtis-
sue). Surface area per unit lung volume (SA/V) was cal-
culated using the following equations as previously
described [12]:
(/)SA V surface density of the tissue air interface
volume
=
×
−
ffraction of tissue,
(1)
in which, surface density of the tissue-air interface
[19]:
Sv tis 4 L I Ptissue 2 mean linear intercept
()
=
()
×
()
=// /ΣΣ
(2)
where L = the length of the grid unit line, ΣI=the
number of intersections counted, ΣP tissue is t he num-
ber of line end points that fall on tissue.
The volume fraction of tissue:
Vv tis P tissue P total
()
=Σ Σ/,
(3)
where ΣP total is the number of line end points
counted in one image.
SA/V for each of the samples was corrected for
shrinkage. The shrinkage factor was determined by mea-
suring the length of o ne side of the blocks prior to fixa -
tion processing and then div iding by the length of that
side of the cut sections post-fixation (shrinkage factor:
1.30 ± 0.13)
Quantitative CT
The region of lung where the histology samples were
taken was identified on the CT image by comparing
anatomic landmarks on the cut surface of the gross lung
specimen and CT images as shown in Figure 1. The
Table 1 Subjects Demographics
Mean ± SD Range
Age (yrs) 67.0 ± 3.1 61.8 - 72.0
Gender 5 female:9 male
Smoking (pack yrs) 59.6 ± 44.4 24.8 - 173.0
Height (cm) 169.1 ± 7.2 157.0 - 180.0
Weight (kg) 66.6 ± 12.5 44.0 - 90.0
Post-FEV1%pred (%) 78.7 ± 16.1 46.7 - 114.5
Post-FEV1/FVC 67.5 ± 8.8 45.9 - 79.0
DLCO % pred 70.4 ± 10.3 47.8 - 90.6
Post-FEV1%pred: post-bronchodilator forced expiratory flow in one second/
predicted value.
Post-FEV1/FVC: post-bronchodilator forced expiratory flow in one second/post-
bronchodilator forced vital capacity.
DLco: Diffusing capacity.
Yuan et al. Respiratory Research 2010, 11:153
/>Page 3 of 9
difference in lung inflation between the in vivo and in
vitro state was determined by comparing the area of the
cut surface on the lung specimen, measured using Ima-
geJ, (Rasband, W.S., ImageJ, U. S. National Institutes of
Health, Bethesda, Maryland, USA, .
gov/ij/, 1997-2007) to the area of the lung on the
in vivo CT image measured using custom software
(EmphylxJ, UBC James Hogg Research Centre, Vancou-
ver, B.C, ) as described else-
where [20]. Then, a square, size-corrected for inflation
was superimposed upo n the CT image. For each voxel
within that square, the apparent X-ray attenuation value
(Hounsfield Unit, HU) was obtained and converted to
gravimetric density (g/ml) by adding 1000 to the HU
value and dividing by 1000 [21]. The median CT lung
density value was chosen from the frequency distribu-
tion curve of l ung density within each square since the
curve is skewed to the right [12]. We estimated the dis-
tribution of sizes of the emphysematous lesions within
each square using a low attenuation cluster analysis
[16,22]. In the low attenuation cluster analysis the
inverse slope of t he log-log relationship of the size of
the low attenuation cluster (number of contiguous vox-
els <-856 HU) versus the number of clusters of that size
is the power-law exponent (D). -856HU was chosen to
identify “emphysematous” because it converts to 6.0 ml/
g, which has been previously shown to represent the
boundary between normal and mildly emphysematous
lung [12] (See additional file 1: Converting 6.0 ml/g to
-856HU).
Statistical Analysis
The primary outcome was the histologically measured
SA/V and the independent variables included the med-
ian CT lung density and the CT cluster analysis value
D. We used a l inear mixed model (the REstricted Maxi-
mum Likelihood method, REML) to i ncorporate the
within subject variance of the measurements since ten
measurements were made from each lung specimen
[23], and we examined the association between the out-
come and the two independent variables with the gen-
der, age and patient’ s body mass index (BMI) being
covariates.TotestwhetherCTclusteranalysiscould
supplement lung densitometry (i.e., median lung density)
in detecting histological emphysema, we compared the
prediction of SA/V using median CT lung density or
the CT clust er analysis value D to a third model, which
incorporated both vari ables using Aka ike’ s Information
Criterion (AIC) based on the Maximum Likelihood Esti-
mation [24]. The model with the smallest AIC value is
considered to be the best model [25]. Analyses were
performed using SAS version 9.1 (Carey, N.C.). Statisti-
cal significance was defin ed at a p-value less tha n 0.05.
Continuous variables are expressed as mean ± SD.
Results
Subject Characteristics
ThesubjectdemographicsareshowninTable1.The
level of airway obstruction of the subjects was relatively
mild with only one subject in stage 3 according to the
Global Initiative for Obstructive Lung Disease ( GOLD)
categories [26]. Five subjects were stage 2, two stage 1,
and the remaining six subjects had normal lung
function.
Quantitative Histology and Quantitative CT
Measurements
The histological measurements of SA/V and quantitative
CT measurements for all 140 tissue samples from 14
cases are summarized in Table 2. These data show that
there is a wid e variation in both histological and quanti-
tative CT measurements within each individual.
Linear mixed models showed that the median CT lung
density and the CT cluster analysis value D were signifi-
cantly associated with histological SA/V (both p <
0.0001) (Figures 2 and 3). The prediction equations of
SA/V using CT lung density alone, CT cluster analysis
alone, and the combination of these two measurements
were:
SA/V = 4.62 + 1631.99 × median CT lung density;
SA/V = 168.44 + 69.21 × CT cluster analysis value D;
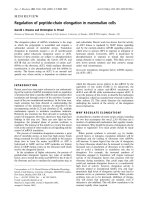
Figure 1 Matching CT Images and Lung Specimens. A CT image
of a representative subject is shown in Figure 1A and the
corresponding slice of the resected specimen is shown in Figure 1B.
For reference and orientation, the tumor is marked by a star (
*
). A
grid is superimposed over the fixed lung slice (Figure 1B) and a 2 ×
2 cm square section (square E) is randomly selected for histological
processing and measurement of surface area per unit lung volume
(SA/V). The corresponding region (square E) on CT is then identified
(Figure 1A); the CT median lung density and the CT cluster analysis
value D are obtained in the region of interest using the computer
program (EmphylxJ). The size of the square E on CT has been
corrected for lung inflation to match the size of the histological
specimen.
Yuan et al. Respiratory Research 2010, 11:153
/>Page 4 of 9
SA/V = 6.04 + 1597.05 × median CT lung density +
11.19 × CT cluster analysis value D.
A comparison of the three models using the Akaike’s
Information Criterion showed that the model incorpor-
ating both CT lung density and low attenuation cluster
analysis yielded the smallest AIC value indicating t hat
it is the best model for predicting SA/V (the AIC was
904 for CT lung density alone, 927 f or CT cluster ana-
lysis alone and 897 for the model incorporating both
variables).
Discussion
The most important finding of the present study is that
although CT lung densitometry (i.e., median lung den-
sity in the current study) was a valid estimate of the his-
tological measurement of airspace enlargement and/or
alveolar wa ll destruction (airspace surface area per unit
lung volume, SA/V), its accuracy was significantly
improved by combining it with CT cluster analysis of
lower attenuation areas. Basing an estimate of emphy-
sema solely on a measure of lung density assumes that
the decrease in alveolar surface area which accompanies
emphysema is mirro red by a proportional reduction in
lung tissue mass. Although it is clear that tissue destruc-
tion is part of the process, there is increasing evidence
that emphysema is also accompanied by “remodeling” of
the lung parenchyma which may be associated with
fibrosis [13-15]. The extent of this “ remodeling” will
confound the relationship between lung density and SA/
V. This phenomenon is illustrated in Figure 4 . In thi s
schematic, normal lung architecture (Normal) and two
examples of “emphysema” (AandB)areshown.In
example A, there is a loss of alveolar walls with a corre-
sponding loss of lung mass. In example B, there is a
sim ilar loss of the number of alveolar walls but a thick-
ening of the retained alveolar walls such that the mass
of the lung is comparable to Normal and greater than in
A although both A a nd B have comparable loss in lung
SA/V.
CT cluster analysis of low attenuation areas is a
method to describe and quantify the distribution of
emphysematous spaces by determining whether low
Table 2 Histological and Quantitative CT Measurements
for 140 Tissue Samples from 14 Subjects
Subject Histology-SA/V
(cm
2
/cm
3
)
Median CT
lung density
(g/ml)
Low Attenuation
Cluster
Analysis (D)
1 161.4 ~ 275.3 5.6 ~ 7.9 0.2 ~ 1.1
2 175.1 ~ 265.6 6.5 ~ 7.5 0.1 ~ 0.7
3 102.5 ~ 215.3 5.9 ~ 8.3 0.2 ~ 0.9
4 182.7 ~ 438.6 4.2 ~ 5.8 0.6 ~ 2.5
5 39.2 ~ 122.2 11.7 ~ 39.1 0.1 ~ 0.3
6 172.0 ~ 253.9 4.7 ~ 6.9 0.2 ~ 1.2
7 84.3 ~ 171.3 8.2 ~ 14.8 0.1 ~ 0.4
8 171.9 ~ 289.2 5.6 ~ 9.3 0.3 ~ 1.2
9 90.6 ~ 260.1 7.3 ~ 13.8 0.1 ~ 0.6
10 227.4 ~ 464.1 2.9 ~ 4.8 1.1 ~ 2.0
11 141.7 ~ 256.5 3.2 ~ 6.7 0.6 ~ 2.0
12 320.2 ~ 445.6 3.6 ~ 5.9 0.9 ~ 2.2
13 78.0 ~ 248.3 6.1 ~ 14.8 0.1 ~ 0.7
14 237.6 ~ 332.6 4.8 ~ 6.3 0.6 ~ 2.0
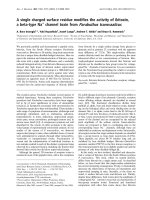
Figure 2 Association between the Histological SA/V and CT
Median Lung Density. There is a significant association between
the SA/V (cm
2
/cm
3
) measured histologically and the CT median
lung density (g/ml) (r = 0.82, p < 0.0001). All subjects are shown
using different symbols. Data point A and B refer to samples with
comparable SA/V value but very different CT density measurement
(sample A: SA/V = 247 cm
2
/cm
3
, CT density = 0.14 g/ml; sample B:
SA/V = 258 cm
2
/cm
3
, CT density = 0.24 g/ml). A and B refer to the
same samples in Figure 2, 3, and 5.
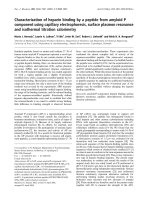
Figure 3 Association between the Histological SA/V and CT
Cluster Analysis Value D. There is a significant association
between the SA/V (cm
2
/cm
3
) measured histologically and the CT
cluster analysis D value (r = 0.74, p < 0.0001). All subjects are shown
using different symbols. Data point A and B have comparable value
for SA/V and CT cluster analysis (sample A: SA/V = 247 cm
2
/cm
3
,D
= 0.91; sample B: SA/V = 258 cm
2
/cm
3
, D = 1.17). A and B refer to
the same samples in Figure 2, 3, and 5.
Yuan et al. Respiratory Research 2010, 11:153
/>Page 5 of 9
attenuation voxels are clustered into large lesions o r
present as diffuse small ones. It has been shown that
there is an inverse power law relationship between the
size and number of clusters where the slope of this rela-
tionship (D) becomes smaller with increasing lesion size
[16]. This variable is less likely to be affected by the
accumulation of connective tissue that may accompan y
emphysema since it measures clustering of low attenua-
tion areas. Examples o f these theoretical considerations
were observed in our data. For example, points A and B
in Figure 2 and 3 represent two samples with compar-
able values for histological SA/V and CT cluster analysis
but very d ifferent CT lung density. The examination of
the histolo gy in these two samples shown in Figure 5 is
consistent with the theory illustrated in Figure 4. For
sample B CT cluster analysis provides a more accurate
estimate of histological SA/V than does CT lung density,
because tissue deposition accompanies tissue destruc-
tion. Addit ionally the cluster analysis likely detects true
tissue destruction with the formation of low attenuation
areas larger than single CT voxels while measures of
density can be affected by simple hyperinflation of l ung
tissue without alveolar wall destruction. Such hyperinfla-
tion may be a precursor of the tissue destruction which
characterizes emphysema but would have less effect on
the histological surface area to volume ratio than true
tissue disruption.
The current data also suggest that the cluster analysis
value D, per se, is a valid quantitative CT est imate of
emphysema because it significantly, and independently,
correlated with the histological measurement of surface
area per unit lung volume (Figure 3). T his finding is at
variance with that of Madani et al [8]. We think this
discrepancymightbebecausewechoseadifferentHU
cutoff to define the “ low attenuation cluster” .Madani
et al chose -960HU and 1
st
percentile point as the cutoff
whereas we used a relatively higher HU value: -856HU.
As we explained in the methods section that -856 HU is
conv erted from a l ung tissue inflation value of 6.0 ml/g,
which w as previously shown to represent the boundary
between normal and mild emphysematous lung [12].
In the current study, we chose surface area per unit
lung volume (i.e., SA/V) as the histological reference.
This variable has been shown to separate normal lung
from emphysematous tissue [12], and its calculation
(Equation 1 and 2) is linearly related to the mean linear
intercept (i.e., Lm), which has been used by other groups
to estimate emphysema microscopically [9].
One challenge for validation of CT measurements is
the marked heterogeneity of the emphysematous process.
Even in lungs severely affected by emphysema, some
regions still maintain normal architecture making sam-
pling for pathological examination critical as shown in
Figure 6. In many of the previous validation studies,
Figure 4 A Schematic Showing the Relationship between Lung
SA/V and Density under two scenarios. The top panel represents
normal lung architecture with the dimensions of each “alveolus” being
100 × 100 μmyieldingatotalvolumeofthe“lung” = 16,000 μm
3
with
a surface area of 6,400 μm
2
and a SA/V of 0.4. If we assign a mass of 10
units to each 100 μmlengthof“alveolar wall” this “lung” has a mass of
400 units and a density of 0.025 units/μm
3
(= 400 units/16,000 μm
3
). In
A, the volume and thickness of the “alveolar walls” remains the same
as those in “normal lung architecture” but the surface area is decreased
due to destruction of “alveolar walls”. In this scenario, the reduction in
SA/V and density are proportional. However in scenario B, the
thickness of the “alveolar walls” is doubled therefore increasing the
mass. The resultant SA/V is the same as in A whereas the density is
higher than in A and even higher than the Normal. Thus if there is
addition of tissue, the relationship between SA/V and density is
disrupted.
Figure 5 Hematoxylin and Eosin-stained Images of Tissue
Samples A and B in Figures 2, 3. The tissue shown in A has a SA/
V of 247 mm
2
/mm
3
and a CT density of 0.14 g/ml while the area in
B has a SA/V of 258 mm
2
/mm
3
and a CT density of 0.24 g/ml. Thus
despite comparable SA/V, there is a substantial difference in CT
density due to the deposition of extracellular matrix in B. On the
other hand, CT cluster analysis (i.e., value D), which relies solely on
the size of the low attenuation areas, was comparable in these two
regions (0.97 in A and 1.17 in B).
Yuan et al. Respiratory Research 2010, 11:153
/>Page 6 of 9
including o ur previous wo rk, the commonly applied
approach is to randomly sample tissue from lungs, calcu-
late the averaged value from these random samples to
obtain one single histological measurement for each sub-
ject, and compare this value to one single CT measure-
ment obtained from the whole lung of that subject
[6,8,9,11,12]. However, by doing so, the CT measurement
is global, incorporating all regions, diseased or relatively
normal, whereas the histological measurement is aver-
aged from a limited number of samples taken from differ-
ent regions of the surgically resected lungs. In the present
study, we have refined this approach by using a modified
computer program, which enablesustoobtainregional
CT measurements from the exac t regions of the lung
where the histological measurements were taken and
compare this regional CT measurement to the histologi-
cal measurement of the same region. We think this pre-
cise matching can provide a moreaccuratecomparison
between CT and histological measur ements. Also, in this
way, we were testing our hypothesis in 140 tissue samples
rather than in 14 subjects. Nevertheless, we cannot con-
sider 140 tissue samples as 140 independe nt samples
since ten samples were taken from each individual.
Therefore, in the statistical analysis, we applied a linear
mixed modeling approach to account for the random
effects arising from inter-individual variance and to
obtain prediction equations at the group level [23].
This study has some limitations. First, in the current
study, we only used one CT densitometry measurement,
median lung density. While Gevenois has shown using
thin slice CT scans (1 mm) that -950 HU detects both
macroscopic and microsco pic emphysema they a lso
showed tha t using this cut-off 6.8% would be the upper
limit of normal and therefore the threshold between
normal and diseased [6]. However, prev ious studies
using thick slice CT scans shows that threshold cut-offs
such as -910 HU only pick up large emphysematous
holes in the lung [27] wh ile a threshold of -856 HU
estimates the small holes [12]. Therefore, with this data
in mind, we chose the mean lung density threshold,
because of the small size of pathologic specimens (2 × 2
cm
2
)thatwewerecomparingtothethicksliceCT
values and the rel atively mild degree of emphysema pre-
sent in our subjects and specimens. We cannot com-
ment on the supplementary role of CT clust er analysis
to other more traditional whole lung CT densitometry
measurements of emphysema, such as low attenuation
area and percentile point, etc. However, we believe it is
reasonable to assume that CT cluster analysis would
supplement the o ther CT densitometry measurements
since all such measurem ents rely on cho osing a cutoff
value from the X-ray attenuation distribution histogram,
either along the X axis (i.e., low attenuation area) or
along the Y axis (i.e., percentile point). The extent, to
which, CT cluster analysis supplements the different CT
densitometry measurements might vary depending on
the threshold use and, therefore, further studies includ-
ing other densitometry measurements may provide
more information. Secondly, we us ed -856HU, based on
our previous experie nce with thick slice CT scans that
identified this HU threshold as effective in identifying
mild emphysematous areas [12]. We realize that CT
scan slices in our previous study were of 10 mm thick-
ness whereas in the current study were of 5 mm slice
thickness. Due to limitations in CT scanner technology,
we are not able to test whether this threshold is equally
effective using either slice thickness. Lastly, the pre-
surgery CT images were acquired using two different
CT scanners could have introduced errors in CT lung
density measurement. However since the X-ray radiation
dose is similar (120 kVp and 1 14 mAs on GE scanner;
120 kVp and 115 mAs on Siemens scanner), we believe
this effect is small. Moreover we have previo usly shown
that CT densitometry measurements using similar
acquisition protocols are comparable between these CT
scanners [20].
The difference in Akaike’s Information Criterion (AIC)
between the models appears small but this does not
mean that the added information of the combined
model is small. The AIC cannot be interpreted using a
traditional “hypothesis testing” statistical paradigm. It
does not generate a P value, does not reach conclusions
about “statistical significance”, and does not “reject” any
model. AIC determines how well the data supports each
model, taking into account both the goodness-of-fit
(sum-of-squares) and the number of parameters in the
model. Ultimately, the model with the smalles t AIC i s
considered the best, although the AIC value itself is not
meaningful [28].
In conclusion, the results of this study show that an
accurate comparison between CT and histological mea-
surements can be achieved by precisely mapping the
Figure 6 Heterogeneity of Lung Tissue Destruction. Examples of
hematoxylin and eosin-stained images of tissue samples taken from
the same individual but different lung regions. A: Normal tissue with
SA/V = 439 cm
2
/cm
3
, tissue density = 0.19 g/ml, B: emphysematous
tissue with SA/V = 183 cm
2
/cm
3
, tissue density = 0.14 g/ml.
Yuan et al. Respiratory Research 2010, 11:153
/>Page 7 of 9
location of the histological sample to its in vivo location
on the CT. In addition, the CT cluster analysis value D
can supplement CT densitometry in detecting and quan-
tifying emphysema. The additional benefit may be due
to the fact that cluster analysi s is more sensitive to true
tissue destruction and immune to the artifact caused by
the deposition of connective tissue that may accompany
the emphysematous process.
Additional material
Additional file 1: Conversion of 6.0 ml/g to -856HU. This file outlines
the method to convert lung inflation values, measured as ml of gas per
g tissue, into X-ray attenuation values.
Acknowledgements
The authors thank Anh-Toan Tran, BSc and Ida Chan, MD for technical
assistance in developing and supporting the lung analysis application.
PDP is a Michael Smith Foundation for Health Research Distinguished
scholar and the Jacob Churg Distinguished Researcher. DDS is a Canada
Research Chair in COPD and a Senior Scholar with the Michael Smith
Foundation for Health Research. HOC was Parker B Francis Fellow in
Pulmonary Research during the time of this research. HOC is currently a
Canadian Institutes of Health Research (CIHR)/British Columbia Lung
Association New Investigator. HOC is also supported, in part, by the
University of Pittsburgh COPD SCCOR NIH 1P50 HL084948 and R01
HL085096 from the National Heart, Lung, and Blood Institute, National
Institutes of Health, Bethesda, MD to the University of Pittsburgh. This
project was funded by a CIHR Industry partnership grant with
GlaxoSmithKline.
Author details
1
University of British Columbia James Hogg Research Centre and the Heart
and Lung Institute, St. Paul’s Hospital; Burrard Street, Va ncouver, Canada.
2
UBC Department of Radiology, Vancouver General Hospital; West 12
th
Ave.
Vancouver, Canada.
3
UBC Department of Medicine St. Paul’s Hospital; Burrard
Street, Vancouver, Canada.
4
UBC Department of Pathology, St. Paul’s
Hospital; Burrard Street, Vancouver, Canada.
5
UBC Department of Pathology,
Vancouver General Hospital, West 12
th
Ave. Vancouver, Canada.
Authors’ contributions
RY and TN carried out the quantitative CT analysis. WME and LL carried out
the quantitative histological analysis. DS and LX performed the statistical
analysis. PP is the principal investigator of the project, obtained funding for
and supervised the project. PP, JH, and HC participated in the design of the
study. RY, PP, JH and HC drafted the manuscript. SK, JE and JM participated
in the coordination of the study and helped to draft the manuscript. All
authors read and approved the final manuscript.
Competing interests
PD Paré is the principal investigator of a project funded by GSK to develop
CT based algorithms to quantify emphysema and airway disease in COPD.
With collaborators he has received ~ $300,000 to develop and validate these
techniques. These funds he have been applied solely to the research to
support programmers and technicians. Peter Pare was also PI of a Merck
Frosst supported research program to investigate gene expression in the
lungs of patients who have COPD. He and collaborators have received ~
$200,000 for this project. These funds have supported the technical
personnel and expendables involved in the project. PP has established a
new contract with Merck to discover genetic predictors of gene expression
in lung tissue. With collaborators he will receive $95,000 over the next year
to do this work. The funds will support personnel and buy supplies. PP sits
on an advisory board for Talecris Biotherapeutics who make anti-one
antitrypsin replacement therapy.
JC Hogg has served as a consultant, given lectures and participated in
advisory boards of several major pharmaceutical companies in the past five
years. The total reimbursement for these activities is less than $20000.00. His
University (UBC) has also received industry sponsored grants from GSK and
Merck on which he serve as the PI.
DD Sin has received research funding from GlaxoSmithKline and
AstraZeneca for projects on chronic obstruction pulmonary disease. DD Sin
has also received honoraria for speaking engagements for talks on COPD
sponsored by these organizations.
HO Coxson received $4800 in 2006 - 2008 for serving on the steering
committee for the ECLIPSE project for GSK. In addition HC is the co-
investigator on two multi-center studies sponsored by GSK and has received
travel expenses to attend meetings related to the project. HC has three
contract service agreements with GSK to quantify the CT scans in subjects
with COPD and a service agreement with Spiration Inc to measure changes
in lung volume in subjects with severe emphysema. A percentage of HC’s
salary between 2003 and 2006 (15,000 US $/year) derives from contract
funds provided to a colleague PD Pare by GSK for the development of
validated methods to measure emphysema and airway disease using
computed tomography. HC is the co-investigator (DD Sin PI) on a Canadian
Institutes of Health - Industry (Wyeth) partnership grant.
R Yuan, T Nagao, WM Elliott, L Loy, L Xing, S Kalloger, J English, and J Mayo
have no competing interests in the content of this manuscript.
Received: 15 June 2010 Accepted: 31 October 2010
Published: 31 October 2010
References
1. Burrows B, Knudson RJ, Cline MG, Lebowitz MD: Quantitative relationships
between cigarette smoking and ventilatory function. Am Rev Respir Dis
1977, 115:195-205.
2. Hogg JC, Macklem PT, Thurlbeck WM: Site and nature of airway
obstruction in chronic obstructive lung disease. N Engl J Med 1968,
278:1355-1360.
3. Macklem PT, Mead J: Resistance of central and peripheral airways
measured by a retrograde catheter. J Appl Physiol 1967, 22:395-401.
4. Fraser RS, Paré PD, Colman NC, Muller NL: Diagnosis of Diseases of the Chest
Philadelphia: Saunders, Fourth 1999.
5. Bankier AA, De Maertelaer V, Keyzer C, Gevenois PA: Pulmonary
emphysema: subjective visual grading versus objective quantification
with macroscopic morphometry and thin-section CT densitometry.
Radiology 1999, 211:851-858.
6. Gevenois PA, De Vuyst P, de Maertelaer V, Zanen J, Jacobovitz D, Cosio MG,
Yernault JC: Comparison of computed density and microscopic
morphometry in pulmonary emphysema. Am J Respir Crit Care Med 1996,
154:187-192.
7. Hayhurst MD, MacNee W, Flenley DC, Wright D, McLean A, Lamb D,
Wightman AJ, Best J: Diagnosis of pulmonary emphysema by
computerised tomography. Lancet 1984, 2:320-322.
8. Madani A, Van Muylem A, de Maertelaer V, Zanen J, Gevenois PA:
Pulmonary emphysema: size distribution of emphysematous spaces on
multidetector CT images-comparison with macroscopic and microscopic
morphometry. Radiology 2008, 248:1036-1041.
9. Madani A, Zanen J, de Maertelaer V, Gevenois PA: Pulmonary emphysema:
objective quantification at multi-detector row CT–comparison with
macroscopic and microscopic morphometry. Radiology 2006,
238:1036-1043.
10. Muller NL, Staples CA, Miller RR, Abboud RT: “Density mask”. An objective
method to quantitate emphysema using computed tomography. Chest
1988, 94:782-787.
11. Gould GA, MacNee W, McLean A, Warren PM, Redpath A, Best JJ, Lamb D,
Flenley DC: CT measurements of lung density in life can quantitate distal
airspace enlargement - an essential defining feature of human
emphysema. Am Rev Respir Dis 1988, 137:380-392.
12. Coxson HO, Rogers RM, Whittall KP, D’Yachkova Y, Pare PD, Sciurba FC,
Hogg JC: A quantification of the lung surface area in emphysema using
computed tomography. Am J Respir Crit Care Med 1999, 159:851-856.
13. Lang MR, Fiaux GW, Gillooly M, Stewart JA, Hulmes DJ, Lamb D: Collagen
content of alveolar wall tissue in emphysematous and non-
emphysematous lungs. Thorax 1994, 49:319-326.
Yuan et al. Respiratory Research 2010, 11:153
/>Page 8 of 9
14. Tonelli M, Stern EJ, Glenny RW: HRCT evident fibrosis in isolated
pulmonary emphysema. J Comput Assist Tomogr 1997, 21:322-323.
15. Cardoso WV, Sekhon HS, Hyde DM, Thurlbeck WM: Collagen and elastin in
human pulmonary emphysema. Am Rev Respir Dis 1993, 147:975-981.
16. Mishima M, Hirai T, Itoh H, Nakano Y, Sakai H, Muro S, Nishimura K, Oku Y,
Chin K, Ohi M, et al: Complexity of terminal airspace geometry assessed
by lung computed tomography in normal subjects and patients with
chronic obstructive pulmonary disease. Proc Natl Acad Sci USA 1999,
96:8829-8834.
17. Miller A, Thornton JC, Warshaw R, Anderson H, Teirstein AS, Selikoff IJ:
Single breath diffusing capacity in a representative sample of the
population of Michigan, a large industrial state. Predicted values, lower
limits of normal, and frequencies of abnormality by smoking history. Am
Rev Respir Dis 1983, 127:270-277.
18. Hogg JC, Chu F, Utokaparch S, Woods R, Elliott WM, Buzatu L,
Cherniack RM, Rogers RM, Sciurba FC, Coxson HO, Pare PD: The nature of
small-airway obstruction in chronic obstructive pulmonary disease. N
Engl J Med 2004, 350:2645-2653.
19. Howard CV, Reed MG: Unbiased Stereology: Three-Dimensional Measurement
in Microscopy, Second Edition Summary Liverpool, UK: Taylor & Francis Inc,
Second 2004.
20. Yuan R, Mayo JR, Hogg JC, Pare PD, McWilliams AM, Lam S, Coxson HO:
The Effects of Radiation Dose and CT Manufacturer on Measurements of
Lung Densitometry. Chest 2007, 132:617-623.
21. Hedlund LW, Vock P, Effmann EL: Evaluating lung density by computed
tomography. Semin Respir Med 1983, 5:76-87.
22. Coxson HO, Whittall KP, Nakano Y, Rogers RM, Sciurba FC, Keenan RJ,
Hogg JC: Selection of patients for lung volume reduction surgery using
a power law analysis of the computed tomographic scan. Thorax 2003,
58:510-514.
23. Feldman HA: Families of lines: random effects in linear regression
analysis. J Appl Physiol 1988, 64:1721-1732.
24. Verbeke G, Molenberghs G: Linear Mixed Models for Longitudinal Data
Springer-Verlag New York 2000.
25. Ljung L: System Identification: Theory for the User Upper Saddle River, NJ:
Prentice-Hal PTR 1999.
26. Rabe KF, Hurd S, Anzueto A, Barnes PJ, Buist SA, Calverley P, Fukuchi Y,
Jenkins C, Rodriguez-Roisin R, van Weel C, Zielinski J: Global strategy for
the diagnosis, management, and prevention of chronic obstructive
pulmonary disease: GOLD executive summary. Am J Respir Crit Care Med
2007, 176:532-555.
27. Miller RR, Muller NL, Vedal S, Morrison NJ, Staples CA: Limitations of
computed tomography in the assessment of emphysema. Am Rev Respir
Dis 1989, 139:980-983.
28. Lindsey JK, Jones B: Choosing among generalized linear models applied
to medical data.
Stat Med 1998, 17:59-68.
doi:10.1186/1465-9921-11-153
Cite this article as: Yuan et al.: Quantification of lung surface area using
computed tomography. Respiratory Research 2010 11:153.
Submit your next manuscript to BioMed Central
and take full advantage of:
• Convenient online submission
• Thorough peer review
• No space constraints or color figure charges
• Immediate publication on acceptance
• Inclusion in PubMed, CAS, Scopus and Google Scholar
• Research which is freely available for redistribution
Submit your manuscript at
www.biomedcentral.com/submit
Yuan et al. Respiratory Research 2010, 11:153
/>Page 9 of 9