Báo cáo y học: "Automated evaluation of autoantibodies on human epithelial-2 cells as an approach to standardize cell-based immunofluorescence tests" pdf
Bạn đang xem bản rút gọn của tài liệu. Xem và tải ngay bản đầy đủ của tài liệu tại đây (814.52 KB, 9 trang )
RESEARC H ARTIC LE Open Access
Automated evaluation of autoantibodies on
human epithelial-2 cells as an approach to
standardize cell-based immunofluorescence tests
Karl Egerer
1*†
, Dirk Roggenbuck
2†
, Rico Hiemann
3
, Max-Georg Weyer
4
, Thomas Büttner
2
, Boris Radau
2
,
Rosemarie Krause
1
, Barbara Lehmann
1
, Eugen Feist
1
, Gerd-Rüdiger Burmester
1
Abstract
Introduction: Analysis of autoantibodies (AAB) by indirect immunofluorescence (IIF) is a basic tool for the
serological diagnosis of systemic rheumatic disorders. Automation of autoantibody IIF reading including pattern
recognition may improve intra- and inter-laboratory variability and meet the demand for cost-effective assessment
of large numbers of samples. Comparing automated and visual interpretation, the usefulness for routine laboratory
diagnostics was investigated.
Methods: Autoantibody detection by IIF on human epithelial-2 (HEp-2) cells was conducted in a total of 1222
consecutive sera of patients with suspected systemic rheumatic diseases from a university routine laboratory (n =
924) and a private referral laboratory (n = 298). IIF results from routine diagnostics were compared with a novel
automated interpretation system.
Results: Both diagnostic procedures showed a very good agreement in detecting AAB (kappa = 0.828) and
differentiating respective immunofluorescence patterns. Only 98 (8.0%) of 1222 sera demonstrated discrepant
results in the differentiation of positive from negative samples. The contingency coefficients of chi-square statistics
were 0.646 for the university laboratory cohort with an agreement of 93.0% and 0.695 for the private laboratory
cohort with an agreement of 90.6%, P < 0.0001, respectively. Comparing immunofluorescence patterns, 111 (15.3%)
sera yielded differing results.
Conclusions: Automated assessment of AAB by IIF on HEp-2 cells using an automated interpretation system is a
reliable and robust method for positive/negative differentiation. Employing novel mathematical algorithms,
automated interpretation provides reproducible detection of specific immunofluorescence patterns on HEp-2 cells.
Automated interpretation can reduce drawbacks of IIF for AAB detection in routine diagnostics providing more
reliable data for clinicians.
Introduction
Disease-specific autoantibodies (ABBs) are a serological
phenomenon of systemic rheumatic conditions and
autoimmune liver disorders. Despite the development of
enzyme-linked immunosorbent immunoassay (ELISA)
and multiplexing technologies for the detection of dis-
ease-specific AABs, the screeni ng for anti-nuclear anti-
bodies (ANAs) by indirect immunofluorescence (IIF)
assays remains a standard method in the current
diagnostic approach [1-6]. Several substrates have been
proposed for ANA IIF assays; however, the screening for
non-organ-specific AABs on human epithelial (HEp-2)
cells is the most established method used [7-11]. In gen-
eral, assessment of ANAs is followed by detection of
specific AABs to, for example, extractable nuclear anti-
gens (ENAs) and cytoplasmic antigens by immunoassays
employing purified native or recombinant antigens. This
two-st age approach comprises the following benefits: (a)
highly sensitive screening of the most frequent and
clinically relevant non-organ-specific AABs, (b) optimal
* Correspondence:
† Contributed equally
1
Department of Rheumatology and Clinical Immunology, Charité-
Universitätsmedizin Berlin, Charitéplatz 1, 10117 Berlin, Germany
Egerer et al. Arthritis Research & Therapy 2010, 12:R40
/>© 2010 Egere r et al.; licensee BioMed Central Ltd. This is an open access article distributed under the terms of the Creative Commons
Attribution License (http: //creativecommons.org/licenses/by/2 .0), which permits unrestricted use, distribution, and reproduction in
any medium, provided the original work is properly cited.
combination with other assay techniques for the down-
stream differentiation of AAB reactivities based on the
IIF pattern detected and the diagnosis suspected, (c)
assessment of clinically relevant AABs without the need
for further testing (for example, anti-centromere AABs),
and (d) evaluation of AABs detectable only by IIF in
case of unknown autoantigenic targets or non-available
commercial assays [12-14]. Due to the key position of
ANA screening in the serol ogical diagnosis of systemic
rheumatic diseases, consistent reproducibility and high
quality of HEp-2 cell-based IIF assays are required
[8,15,16]. However, the visual and therefore subjective
evaluation of cell-based IIF assays complicates the stan-
dardized and reproducible evaluation of HEp-2 cell
assays. Interpretation of immunofluorescence patterns is
influenced by the knowledge and individual qualification
of the investigator. Thus, a high intra- and interlabora-
tory variability is common and represents a major diag-
nostic problem, especially in non-specialized laboratories
[17,18]. Automated reading of immunofluorescence pat-
terns by automated interpretation systems with intelli-
gent pattern recognition can overcome this issue
[18,19]. In addition, automation of IIF pattern reading
canprovideareliablebasisforcost-effectiveserological
diagnostics for laboratories with large sample numbers.
In particu lar, the opportun ity of modern electronic data
management alleviates theheavyworkloadinsuch
laboratories.
In this study, we compared the first automated inter-
pretation system available for cell-based IIF with the
currently established visual evaluation method in routine
diagnostics of both a university and a private rheumatol-
ogy referral laboratory. Visual findings of positive/nega-
tive discrimination and AAB pattern detection were
compared with data automatically obtained by this sys-
tem. Perspectives of automated interpretation of cell-
based IIF tests will be discussed.
Materials and methods
Consecutive serum samples of 924 patients with a sus-
pected diagnosis of systemic rheumatic diseases were
referred to the routine laboratory a t the Department of
Rheumatology and Clinical Immunology of t he Charité
Universitätsmedizin Berlin. ANAs were determined
using a HEp-2 cell-based assay. Samples with a titer of
1 in 320 or higher were scored as positive and subse-
quently tested for AABs against ENA. Samples with a
titer of 1 in 80 or 1 in 160 were scored as weakly posi-
tive. Moreover, to assess the performance of the auto-
mated interpretation in a different setting, 288
consecutive serum samples were tested from a private
referral laboratory. This laboratory receives mainly sam-
ples from general practiti oners and small- and medium-
sized hospitals to provide serological findings for the
clarification of suspected rheumatic symptoms. Final
diagnoses are usually not reported to the laboratory.
The study was approved by the local ethics committee
(EA1/001/06). Written informed consent was obtained
from each patient.
Detection of anti-nuclear antibodies by HEp-2 cell assay
ANAs in patient samples were assessed by commercial
ANA assays in accordance with the instructions of the
manufacturer (GA Generic Assays GmbH, Dahlewitz,
Germany). Briefly, samples diluted in phosphate-buf-
fered saline were incubated on HEp-2 cells fixed on
glass slides in a moisture chamber for 30 minutes at
room temperature (RT). The screening dilution was 1 in
160, except for individuals younger than 14 years old, in
whom a screening dilution of 1 in 80 was applied. After
wash ing, bound AABs were detected by incubation with
fluorescein isothiocya nate- conjugated sheep anti-hu man
immunoglobulin for 30 minutes at RT. Subsequently,
slides were washed, embedded with 4’,6-diamidino-2-
phenylindol (DAPI)-containing medium, and assessed
either visually with a fluorescence microscope (Axiovert
40; Carl Zeiss, Jena, Germany, and Eurostar; Euroimmun
AG, Lübeck, Germany) or automatically with the inter-
pretation system (AKLIDES®; Medipan GmbH, Dahle-
witz, Germany). Observers conducting the visual
assessment were DR, M-GW, TB, RK, and BL.
Automated interpretation of HEp-2 cell assay data
The concept of the automated interpretation system
AKLIDES® for evaluation of ANAs including pattern
rec ognition is based on IIF using HEp-2 cells (Figu re 1)
[18,19]. Briefly, IIF patterns of serum samples were
assessed automatically on HEp-2 cells (GA Generic
Assays GmbH) by using a motorized inverse microscope
(Olympus IX81; Olympus Corporation, Tokyo, Japan)
with a motorized scanning stage (Märzhäuser Wetzlar
GmbH & Co. KG, Wetzlar, Germany), 400-nm and 490-
nm light-emitting diodes (CoolLED Ltd., Andover, UK),
and a grey-scale camera (Kappa, Gleichen, Germany).
The interpretation system is controlled by the specially
designed software (AKLIDES®), which consists of mod-
ules for device and autofocus control, image analysis,
and pattern recognition algorithms. The novel autofocus
based on Haralick’ s image characterization of objects
through grey-scale transition used D API as fluorescent
dye for object recognition and focusing. To eliminate
artifacts, an additional qualitative image analysis was
performed by dividing the image into subobjects of
equal size.
Object segmentation was conducted by histogram-
based threshold algorithm followed by watershed trans-
formation [20]. Segmented objects were characterized by
regional, topological, and texture/surface descriptors.
Egerer et al. Arthritis Research & Therapy 2010, 12:R40
/>Page 2 of 9
More than 1,400 object-describing criteria were imple-
mented. Mitotic cells were identified by DAPI staining.
Classification was achieved through the combination of
structure and texture characteristics by definition of
rules for each pattern.
Immunofluorescence image data were evaluated
according to the fo llowing hierarchy: (a) positivity, (b)
localization of staining (nuclear, cytoplasmic, chromatin
of mitotic cells), and (c) determination of nuclear pat-
terns: homogeneous (homogeneous or speckled pattern
with specific staining of the metaphase chromatin),
speckled (fine, medium, or coarse speckled staining of
interphase nuclei), nucleolar (homogeneous or speckled
staining of nucleoli with weak nuclear staining or with-
out nuclear staining), centromere (more than 30 nuclear
dots in the interphase nucleus and metaphase
chromatin), and multiple nuclear dots (multiple dots,
fewer than 30 nuclear dots in the interphase nucleus).
A reactivity index (RI) was calculated by combining
absolute image intensity, contrast, and number of grey-
scale levels of the total image for the assessment of
image data. Since RI is influenced by exposure time,
which depends on the highest image signal after exclu-
sion of artifacts, even patterns with weak absolute sig-
nals like centrioles or nuclear dots can be detected. The
determination of threshold value s for the differentiation
of positive signals was conducted on the basis of RI
values of 200 normal blood donors.
With this software, the following six main patterns
can be detected readily on HEp-2 cells: cytoplasmic,
homogeneous, speckled, nucleolar, centromere, and
multiple nuclear dots. Further stratification of nuclear
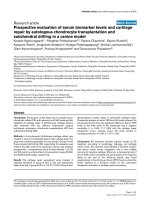
Figure 1 Flowchart of automated human epithelial (HEp-2) cell assay interpretation by the automated reading system [18]. The
fundamental analysis chain of the image processing by the automated system is divided into acquisition, quality control, segmenting, object
description, and object classification. Segmented objects were described by boundary, regional, topological, and texture/surface descriptors.
Digital features were combined to rules, analogous to rules defined by experts.
Egerer et al. Arthritis Research & Therapy 2010, 12:R40
/>Page 3 of 9
or cytoplasmic patterns was performed by retrospective
visual examination if required for discussion of differing
results . Given an ave rage workload of about 50 determi-
nations a day, the system provides sufficient data storage
capacity for 1 year.
Statistical analysis
Chi-square test was used to c heck the relationship
between the two classification systems. To test for the
strength of agreement, inter-rater agreement statistics
was conducted [21]. McNemar test was performed to
check the difference for paired proportions. P values of
less than 0.05 were considered significant. Calculations
were performed by using MedCalc statistical software
(MedCalc, Mariakerke, Belgium).
Results
Comparison of positive and negative findings of patient
sera referred to a routine university laboratory
Consecutive sera of 924 patients with suspected systemic
rheumatic disease were evaluated for the presence of
ANAs in a routine university laboratory. ANAs were
detected by HEp-2 cell assay and interpreted either
visually by an experienced investigator or by automated
reading and pattern recognition with the system. Samples
were blinded for e valuation. Automated evaluation
repo rted 546 sera (59.1%) as positive, 140 sera (15.1%) as
weakly positive, and 238 sera (25.8%) as negative in
regard to the presence of ANAs. Out of the 546 positively
scored sera, 543 sera (99.5%) were confirmed by visual
examination as positive or weakly positive (Table 1). Two
of the three discrepant sera demonstrated a cytoplasmic
pattern, which was assessed as a negative ANA by visual
examination (Figure 2). Cytoplasmic patterns of these
samples were defined by retrospective examination. The
third discrepant sample showed an artifact, leading to a
positive finding by the automated system.
Out of 140 sera scored as weakly positive by the sys-
tem, 113 sera (80.7%) were also interpreted as weakly
positive by visual examination and one serum (1.0%)
was interpreted as positive by visual examination. The
26 sera assessed as negative by visual examination
(18.6%) demonstrated mainly weakly positive speckled
staining of the nucleus in the automated system and
this was scored as irrelevant by visual reading.
Out of 238 sera scored negative by the system, 199
sera (83.6%) were also assessed as negative by visual
examination. In fact, none of these negative samples was
evaluated as positive by visual examination. Onl y 39
sera (16.4%) were assessed as weakly positive, showin g a
titer of 1 in 80 with unspecific patterns by visual assess-
ment. Thus, there was an agreement of 93.0% (859/924)
regarding the discrimination of positive and negative
samples by both approaches in this university laboratory.
Chi-square statistics revealed a contingency coefficient
of 0.646 (P < 0.0001). When weakly positive and defi-
nitely positive samples were combined into one group,
the difference of 1.08% according to the McNemar test
between both methods for positive/negative differentia-
tion was not significant (95% confidence interval
[CI] -0.77% to 2.84%; P = 0.25).
Comparison of pattern assessment of patient sera
referred to a routine university laboratory
There was a high agreement of 90.1% (492/546) com-
paring the visually and automatically define d fluores-
cence patterns of the samples reported positive by the
automated system. The differing samples mainly demon-
strated mixed patterns, which w ere assessed by visual
expert examination and automated reading algorithms
of the automated syste m with different emphasis of one
or the other underlying pattern. Investigators empha-
sized the staining of nucleoli when assessing the combi-
nation of speckled and nucleolar patterns visually. In
contrast, the mathematical software algorithms included
the denser distribution of the speckled pattern with
more value into decision making. A similar situation
was found with the combination of nuclear and cyto-
plasmic patterns. When this mixed pattern was assessed,
visual interpretation of experts tended to emphasize the
nuclear staining (speckled, nucleolar). In contrast, the
system algorithms emphasize the cytoplasmic staining in
case of high-fluorescence signals.
Discrepant assessment of patterns was found with sera
containing antibodies to nuclear membrane targets.
These patterns were evaluated by the system algorithms
as speckled. In contrast, the visual assessment clearly
detected the increased speckled staining at the border of
the nucleus (Figure 3). Sera containing antibodies to the
Table 1 Comparison of automated and visual anti-nuclear antibody interpretation in a university routine laboratory
Visual interpretation
Positive Weak positive Negative Number (percentage)
Automated interpretation Positive 139 404 3 546 (59.1%)
Weak positive 1 113 26 140 (15.1%)
Negative 0 39 199 238 (25.8%)
Number (percentage) 140 (15.1%) 556 (60.2%) 228 (24.7) 924
Egerer et al. Arthritis Research & Therapy 2010, 12:R40
/>Page 4 of 9
Golgi complex were assessed as weakly speckled nuclear
pattern by the software algorithms (Figure 4).
The pattern comparison of the 140 samples scored as
weakly positive by the automated system demonstrated
an agreement of 74.3% (104 sera). Discrepant samples
again showed weak speckled nuclear staining. In sum-
mary, comparison of fluorescence pattern recognition of
the 686 positive and weakly positive findings by the sys-
tem with visual examination demonstrated an agreement
in 596 sera (86.9%).
Comparison of positive and negative findings of patient
sera referred to a private laboratory
Furthermore, 298 consecutive sera referred to a pri-
vate laboratory for the detection of ANAs were
compared with ANA assessment by the system after
routinevisualevaluationbyanexpert(Table2).Sam-
ples were blinded for evaluation. Automated interpre-
tation with the system scored 57 sera (19.1%) of these
298 sera as positive, 16 (5.4%) as weakly positive, and
225 (75.5%) as negative. Of the 57 samples assessed
as positive by the system, 55 sera (96.5%) were
assessed as positive or weakly positive by visual
evaluation.
Evaluation by automated interpret ation scored 16 sera
as weakly positive. Visual assessment determined 12
(75.0%) of these 16 sera to be positive with the same
fluorescence pattern (100.0%). The four sera (25.0%)
scored as negative demonstrated weak speckled fluores-
cence patterns in the system.
Figure 2 Immunofluorescence patterns of two sera (a, b) which were both scored as negative by visual examination but
demonstrated positive cytoplasmic staining by AKLIDES® system. Green color: fluorescein isothiocyanate staining of autoantibody; blue
color: 4’,6-diamidino-2-phenylindol staining of chromatin.
Figure 3 Immunofluorescence patterns of two sera (a, b) which were bot h assessed as positive with speckled pattern by AKLIDES®
system but revealed staining of the nuclear membrane by visual examination. Green color: fluorescein isothiocyanate staining of
autoantibody; blue color: 4’,6-diamidino-2-phenylindol staining of chromatin.
Egerer et al. Arthritis Research & Therapy 2010, 12:R40
/>Page 5 of 9
Out of 225 sera assessed as negative by the automated
system, 201 sera (89.3%) were confirmed as negative by
visual examination. The 24 discrepant sera (10.7%) that
were scored as weakly posi tive with speckled or nucleo -
lar patterns by the investigator and did not reach the
threshold level in the automated system demonstrated
no antibodies to ENA by other techniq ues. Thus, agree-
ment in this patient cohort regarding the differentiation
of positive and negative samples was 90.6% (270/298).
Chi-square statistics revealed a contingency coefficient
of 0.695 (P < 0.0001).
There was a significant difference of 6.04% (95% CI
2.30% to 8.50%; P = 0.0019) for both methods in this
patient cohort by combining positive and weakly posi-
tive samples. When weakly positive results were
excluded and positive and negative samples only were
taken into account, the difference of 0.81% (95% CI
-0.50% to 0.81%) was not significant.
In total, only 98 out of 1,222 sera (8.0%) demonstrated
discrepant results regardin g positive and negative differ-
entiation by visual and automated interpretation (Figure
5). When positive and weakly positive samples were
combined into one group, the strength of agreement
was very good (kappa = 0.828, 95% CI 0.795 to 0.860).
For the assessment of one sample, the automated system
required 60 seconds on average in a walk-away mode.
Comparison of pattern assessment of patient sera
referred to a private laboratory
Fifty-one of the 55 se ra (92.7%) of sera scored positive
by the automated system showed agreement in fluores-
cence pattern detection by visual and automated inter-
pretation. Discrepant results were obtained when the
AKLIDES® softwa re algorithms assessed cytoplasmic
fluorescence signals as nuclear staining due to the
superposition of the nucleus by the cytoplasmic staining.
Discussion
The detection of A ABs like ANAs by IIF was one of the
first techniques available in routine laboratories for the
serological diagnosis of systemic rheumatic diseases
[22,23]. ANAs were even included in the classification
criteria of systemic lupus erythematosus [24]. However,
due to insufficient automation, poor standardization,
and need of extensive expert experience in pattern
recognition, automated ELISA and recently multiplexing
Figure 4 Immunofluorescence pattern with staining of the
Golgi complex, which was identified by AKLIDES® system as
cytoplasmic speckled pattern. Green color: fluorescein
isothiocyanate staining of autoantibody; blue color: 4’,6-diamidino-2-
phenylindol staining of chromatin.
Table 2 Comparison of automated and visual anti-nuclear antibody interpretation in a referral routine laboratory
Visual interpretation
Positive Weak positive Negative Number (percentage)
Automated interpretation Positive 44 11 2 57 (19.1%)
Weak positive 0 12 4 16 (5.4%)
Negative 0 24 201 225 (75.5%)
Number (percentage) 44 (14.8%) 47 (15.8%) 207 (69.4%) 298
Figure 5 Comparison of po sitive and negative findi ngs of
1,222 patient sera referred to a routine university laboratory
(white bars) and a private laboratory (black bars). Negative
samples demonstrated titers below 1 in 80, weak positive samples 1
in 80 or 1 in 160, and positive samples 1 in 320 or above.
Egerer et al. Arthritis Research & Therapy 2010, 12:R40
/>Page 6 of 9
assays have frequently been used for ANA assessment
[25,26]. Not only for ANAs, there is an o ngoing debate
whether these new techniques may replace immuno-
fluorescence given that their limited sensitivity might be
problematic for a screening method [27-31].
Until recently, reliable diagnostic tools for the auto-
mated interpretation of cell-based IIF tests like ANA
detection on HEp-2 cells have not been available for
routine laboratories. However, the use of digital
images of HEp-2 c ell-based assays for diagnostic aims
[32,33] and the superiority of automated in contrast to
subjective pattern classification have already been
demonstrated [34]. Thus, the objective of this study
was the comparison of the current visual subjective
interpretation of HEp-2 cell-based assays for ANA
detection with results obtained by the first automated
interpretation system. Since the detection of ANAs is
employed as serological screening for patients with
suspected rheumatic disorders on the one hand and is
part of classification criteria of systemic rheumatic
diseases on the other, two patient groups tested with
differing laboratory background regarding experience
in ANA detection and prevalence of disease were
included in the study. Consecutive sera of both a uni-
versity laboratory specialized in rheumatic disease
diagnostics and a private referral laboratory covering
hospitals and out-patient departments were included
in the study.
The basic precondition for the use of automated inter-
pretation systems in routine diagnostics is the correct
and reproducible differ entiation of positive and negative
samples. The comparison of visually and automatically
obtained findings is hindered due to the lack of readily
available standards with defined cutoffs for the defini-
tion of positive signals on HEp-2 cells in IIF assays. The
Centers for Disease Control and Prevention (Atlanta,
GA, USA) provide serum standards for specific patterns
which are recommended to be employed for quality
management. Laboratories providing ANA detection by
HEp-2 cell assays frequently report different titers since
cutoffs depend on technical equipment, expert knowl-
edge, and patient population of the corresponding
laboratory.
By means of the automated system, a very good agree-
ment of 92.0% (kappa = 0.828) was obtained for the dif-
ferentiation of positive and negative samples comparing
automated interpretation w ith visual assessment by
experienced examiners in different patient cohorts.
There was no significant difference for either interpre-
tation method for the university patient cohort in differ-
entiating positive from negative samples in our study.
Afterexclusionoftheweaklypositivesamples,thedif-
ference for both interpretation methods was also not
significant for the patient cohort evaluated in the private
referral laboratory. In such a cohort, a low prevalence of
systemic rheumatic disease is usually expected. Samples
with low ANA titers of 1 in 160 or less are not sug-
gested to be subjected to further anti-ENA testing
unless systemic rheumatic disease is strongly suspected
[35]. In this context, automated interpretation of ANAs
of this study is not significantly different from visual
reading by experts regarding at least samples with ANA
titers of more than 1 in 160.
The relatively high variability of routinely employed
pattern recognition of ANA fluorescence images on
HEp-2 cells is a challenge for the implementation of
automated pattern recognition. Thus, different criteria
exist, for example, for the description of coarse and
fine speckled patterns [36]. Otherwise, a nucleolar pat-
tern is usually defined by the positive staining of
nucleoli but has to be specified by further staining of
the chromatin region. The nucleolar staining can
appear as homogeneous, clumpy, fine speckled, and
speckled with mitotic dots and can be associated with
AABs against PM-Scl complex, TH/To, fibrillarin,
RNA polymerase I, and RNA helicase II. Anti-polymer-
ase III or Ku AABs often demonstrate a fine speckled
staining of the interphase chromatin additionally.
Initiatives for the standardization of fluorescence pat-
terns on HEp-2 cells for ANA detection have aimed at
bridging the gap between routine diagnostics and
science. Thus, five main patterns are recommended for
the differentiation of nuclear staining patterns [17].
Elementary evaluation models for single patterns
regarding the classification of pleomorphic patterns
have already been developed [33].
The drawbacks of recently published approaches for
automated pattern recognition appear to include an
over-evaluation of final steps in image assessment like
object extraction and classification [37-40]. In particular,
self-learning classificators [39] have to be reviewed criti-
cally since local erroneous self-learning cannot lead to
improvement of interlaboratory variability. Frequently,
highly qualitative images are preselected, paving the way
for human bias of subsequent findings.
In our study, agreement of pattern recognition
between automated and visual assessment was 85.0%.
This congruence reached 90.0% when only positive sam-
ples were taken into account. Weakly positive samples
detected by visual examination demonstrated titers
below 1 in 160. The latter finding confirms data of a
recently published study [35].
The high agreement of our study between automated
and visual interpretation of AABs results supports
recent data showing that the success of automated inter-
pretation systems depends essentially on the first pro-
cessing steps like qualitative image acquisition and
quality control of object identification [18,38].
Egerer et al. Arthritis Research & Therapy 2010, 12:R40
/>Page 7 of 9
The system used in the present study with novel pat-
tern recognition algorithms for the automated assess-
ment of HEp-2 cell assays may be employed for efficient
AAB screening, especia lly in laboratories with high
numbers of determin ation due to cost-effective manage-
ment of data and human resources. The system can be
readily implemented into routine diagnostics with rea-
sonable demand of operator training. Findings provided
by the system should be approved by an expert with
experience in routine ANA reading due to the difficulty
in assessing sera with differing AABs resulting in mixed
patterns. Titer prediction enabled by the standardization
of the fluorescence signal can further improve cost-
efficiency [19,41].
Conclusions
The standardized evaluation of HEp-2 cell assays by
automated interpretation systems can pave the way for
reproducible and comparable results in and between
laboratories. Archiving of digitized image data improves
data management and providesthebasisforefficient
exchange of data. Automated interpretation systems for
cell-based IIF assays can minimize the drawbacks
regarding other automated techniques and strengthen
the role of immunofluorescence for serological screening
of autoimmune diseases.
Abbreviations
AAB: autoantibody; ANA: anti-nuclear antibody; CI: confidence interval; DAPI:
4’,6-diamidino-2-phenylindol; ELISA: enzyme-linked immunosorbent
immunoassay; ENA: extractable nuclear antigen; HEp-2: human epithelial; IIF:
indirect immunofluorescence; RI: reactivity index; RT: room temperature.
Acknowledgements
This work was supported by German Federal Ministry of Education and
Research grant 03WKR02A and Brandenburg Ministry of Economics and
European Union grant 80133708.
Author details
1
Department of Rheumatology and Clinical Immunology, Charité-
Universitätsmedizin Berlin, Charitéplatz 1, 10117 Berlin, Germany.
2
GA Generic
Assays GmbH, Ludwig-Erhard-Ring 3, 15287 Dahlewitz/Berlin, Germany.
3
University of Applied Science Lausitz, Großenhainer Str. 57, 01968
Senftenberg, Germany.
4
Medizinisches Versorgungszentrum für
Laboratoriumsmedizin, Mikrobiologie, Virologie und Infektionsepidemiologie,
Hygiene und Umweltmedizin, Dr. Löer - Dr. Treder und Kollegen, Hafenweg
11, 48155 Münster, Germany.
Authors’ contributions
KE, DR, RH, TB, BR, RK, and BL carried out the immunofluorescence assays
manually and automatically. EF, MGW and GRB conceived of the study and
participated in its design and coordination and helped to draft the
manuscript. All authors read and approved the final manuscript.
Competing interests
DR is a shareholder of GA Generic Assays GmbH and Medipan GmbH. Both
companies are diagnostic manufacturers. The other authors declare that
they have no competing interests.
Received: 29 December 2009 Revised: 19 February 2010
Accepted: 9 March 2010 Published: 9 March 2010
References
1. Damoiseaux JG, Tervaert JW: From ANA to ENA: How to proceed?
Autoimmun Rev 2006, 5:10-17.
2. Fritzler MJ: Challenges to the use of autoantibodies as predictors of
disease onset, diagnosis and outcomes. Autoimmun Rev 2008, 7:616-620.
3. Ardoin SP, Pisetsky DS: Developments in the scientific understanding of
lupus. Arthritis Res Ther 2008, 10:218.
4. Peene I, Meheus L, Veys EM, De Keyser F: Detection and identification of
antinuclear antibodies (ANA) in a large and consecutive cohort of serum
samples referred for ANA testing. Ann Rheum Dis 2001, 60:1131-1136.
5. Sordet C, Goetz J, Sibilia J: Contribution of autoantibodies to the
diagnosis and nosology of inflammatory muscle disease. Joint Bone Spine
2006, 73:646-654.
6. Worman HJ, Courvalin JC: Antinuclear antibodies specific for primary
biliary cirrhosis. Autoimmun Rev 2003, 2:211-217.
7. Hartung K, Seelig HP: Laboratory diagnostics of systemic autoimmune
diseases. Part 1. Collagenoses. Z Rheumatol 2006, 65:709-724.
8. Tozzoli R, Bizzaro N, Tonutti E, Villalta D, Bassetti D, Manoni F, Piazza A,
Pradella M, Rizzotti P, Italian Society of Laboratory Medicine Study Group
on the Diagnosis of Autoimmune Diseases: Guidelines for the laboratory
use of autoantibody tests in the diagnosis and monitoring of
autoimmune rheumatic diseases. Am J Clin Pathol 2002, 117:316-324.
9. Wiik AS, Gordon TP, Kavanaugh AF, Lahita RG, Reeves W, van Venrooij WJ,
Wilson MR, Fritzler M, IUIS/WHO/AF/CDC Committee for the Standardization
of Autoantibodies in Rheumatic and Related Diseases: Cutting edge
diagnostics in rheumatology: the role of patients, clinicians, and
laboratory scientists in optimizing the use of autoimmune serology.
Arthritis Rheum 2004, 51:291-298.
10. Wiik AS: Anti-nuclear autoantibodies: clinical utility for diagnosis,
prognosis, monitoring, and planning of treatment strategy in systemic
immunoinflammatory diseases. Scand J Rheumatol 2005, 34:260-268.
11. Craig WY, Ledue TB, Johnson AM, Ritchie RF: The distribution of
antinuclear antibody titers in “normal” children and adults. J Rheumatol
1999, 26:914-919.
12. Andrade LE, Chan EK, Peebles CL, Tan EM: Two major autoantigen-
antibody systems of the mitotic spindle apparatus. Arthritis Rheum 1996,
39:1643-1653.
13. Herrera-Esparza R, Avalos-Diaz E, Barbosa-Cisneros O: Anti-NuMA
antibodies: an uncommon specificity in scleroderma sera. Rev Rhum Engl
Ed 1999, 66:315-318.
14. Montecucco C, Caporali R, Cobianchi F, Biamonti G: Identification of
autoantibodies to the I protein of the heterogeneous nuclear
ribonucleoprotein complex in patients with systemic sclerosis. Arthritis
Rheum 1996, 39:1669-1676.
15. Brand F, Martin F, Philipp S, Rößler J, Hansen B, Anderer U: Difference in
fluorescence pattern of cytoplasmic and nuclear antigens in cultivated
human cells dependent on the applied fixation procedure. Cell Prolif
2005, 38:205.
16. Du L, Fukushima S, Sallmyr A, Manthorpe R, Bredberg A: Exposure of HEp-2
cells to stress conditions influences antinuclear antibody reactivity. Clin
Diagn Lab Immunol 2002, 9:287-294.
17. Sack U, Conrad K, Csernok E, Frank I, Hiepe F, Krieger T, Kromminga A, von
Landenberg P, Messer G, Witte T, Mierau R, for the German EASI (European
Autoimmunity Standardization Initiative): Autoantibody detection using
indirect immunofluorescence on HEp-2 cells. Ann N Y Acad Sci 2009,
1173:166-173.
18. Hiemann R, Büttner T, Krieger T, Roggenbuck D, Sack U, Conrad K:
Challenges of automated screening and differentiation of non-organ
specific autoantibodies on HEp-2 cells. Autoimmun Rev 2009, 9:17-22.
19. Hiemann R, Hilger N, Michel J, Nitschke J, Böhm A, Anderer U, Weigert M,
Sack U: Automatic analysis of immunofluorescence patterns of HEp-2
cells. Ann N Y Acad Sci 2007, 1109:358-371.
20. Vincent L, Soille P: Watersheds in digital spaces: an efficient algorithm
based on immersion simulations. IEEE Trans Pattern Anal Mach Intell 1991,
13:583-598.
21. Cohen J: A coefficient of agreement for nominal scales. Educational and
Psychological Measurement 1960, 20:37-46.
22. Tan EM: Autoantibodies to nuclear antigens (ANA): their immunobiology
and medicine. Adv Immunol 1982, 33:167-240.
23. Solomon DH, Kavanaugh AJ, Schur PH, American College of Rheumatology
Ad Hoc Committee on Immunologic Testing Guidelines: Evidence-based
Egerer et al. Arthritis Research & Therapy 2010, 12:R40
/>Page 8 of 9
guidelines for the use of immunologic tests: antinuclear antibody
testing. Arthritis Rheum 2002, 47:434-444.
24. Tan EM, Cohen AS, Fries JF, Masi AT, McShane DJ, Rothfield NF, Schaller JG,
Talal N, Winchester RJ: The revised criteria for the classification of
systemic lupus erythematosus. Arthritis Rheum 1982, 25:1271-1277.
25. Bayer PM, Bauerfeind S, Bienvenu J, Fabien N, Frei PC, Gilburd B, Heide KG,
Hoier-Madsen M, Meroni PL, Monier JC, Monneret G, Panzeri P, Shoenfeld Y,
Spertini F, Wiik A: Multicenter evaluation study on a new HEp2 ANA
screening enzyme immune assay. J Autoimmun 1999, 13:89-93.
26. Shovman O, Gilburd B, Barzilai O, Shinar E, Larida B, Zandman-Goddard G,
Binder SR, Shoenfeld Y: Evaluation of the BioPlex 2200 ANA screen:
analysis of 510 healthy subjects: incidence of natural/predictive
autoantibodies. Ann N Y Acad Sci 2005, 1050:380-388.
27. Emlen W, O’Neill L: Clinical significance of antinuclear antibodies:
comparison of detection with immunofluorescence and enzyme-linked
immunosorbent assays. Arthritis Rheum 1997, 40:1612-1618.
28. Kroshinsky D, Stone JH, Bloch DB, Sepehr A: Case records of the
Massachusetts General Hospital. Case 5-2009. A 47-year-old woman with
a rash and numbness and pain in the legs. N Engl J Med 2009,
360:711-720.
29. Mahler M, Ngo JT, Schulte-Pelkum J, Luettich T, Fritzler MJ: Limited
reliability of the indirect immunofluorescence technique for the
detection of anti-Rib-P antibodies. Arthritis Res Ther 2008, 10:R131.
30. Conrad K, Ittenson A, Reinhold D, Fischer R, Roggenbuck D, Büttner T,
Bosselmann HP, Steinbach J, Schössler W: High sensitive detection of
double-stranded DNA autoantibodies by a modified Crithidia luciliae
immunofluorescence test. Ann N Y Acad Sci 2009, 1173:180-185.
31. Nordal EB, Songstad NT, Berntson L, Moen T, Straume B, Rygg M:
Biomarkers of chronic uveitis in juvenile idiopathic arthritis: predictive
value of antihistone antibodies and antinuclear antibodies. J Rheumatol
2009, 36:1737-1743.
32. Rigon A, Soda P, Zennaro D, Iannello G, Afeltra A: Indirect
immunofluorescence in autoimmune diseases: assessment of digital
images for diagnostic purpose. Cytometry B Clin Cytom 2007, 72:472-477.
33. Soda P: Early experiences in the staining pattern classification of HEp-2
slides. Proceedings of the Twentieth IEEE International Symposium on
Computer-Based Medical Systems Washington, DC: IEEE Computer Society
2007, 219-224.
34. Hu Y, Murphy RF: Automated interpretation of subcellular patterns from
immunofluorescence microscopy. J Immunol Methods 2004, 290:93-105.
35. Kang I, Siperstein R, Quan T, Breitenstein ML: Utility of age, gender, ANA
titer and pattern as predictors of anti-ENA and -dsDNA antibodies. Clin
Rheumatol 2004, 23:509-515.
36. Reimer G, Steen VD, Penning CA, Medsger TA, Tan EM:
Correlates between
autoantibodies to nucleolar antigens and clinical features in patients
with systemic sclerosis (scleroderma). Arthritis Rheum 1988, 31:525-532.
37. Glory E, Murphy RF: Automated subcellular location determination and
high throughput microscopy. Dev Cell 2007, 12:7-16.
38. Hiemann R, Hilger N, Sack U, Weigert M: Objective quality evaluation of
fluorescence images to optimize automatic image acquisition. Cytometry
A 2006, 69:182-184.
39. Perner P, Perner H, Müller B: Mining knowledge for HEp-2 cell image
classification. Artif Intell Med 2002, 26:161-173.
40. Soda P, Iannello G: A multi-expert system to classify fluorescent intensity
in antinuclear autoantibodies testing. Proceedings of the Nineteenth IEEE
International Symposium on Computer-Based Medical Systems Washington,
DC: IEEE ComputerSociety 2006, 219-224.
41. Hollingsworth PN, Dawkins RI, Peter JB: Precise quantitation of antinuclear
antibodies on HEp-2 cells without the need for serial dilution. Clin Diagn
Lab Immunol 1996, 3:374-377.
doi:10.1186/ar2949
Cite this article as: Egerer et al.: Automated evaluation of
autoantibodies on human epithelial-2 cells as an approach to
standardize cell-based immunofluorescence tests. Arthritis Research &
Therapy 2010 12:R40.
Submit your next manuscript to BioMed Central
and take full advantage of:
• Convenient online submission
• Thorough peer review
• No space constraints or color figure charges
• Immediate publication on acceptance
• Inclusion in PubMed, CAS, Scopus and Google Scholar
• Research which is freely available for redistribution
Submit your manuscript at
www.biomedcentral.com/submit
Egerer et al. Arthritis Research & Therapy 2010, 12:R40
/>Page 9 of 9