Báo cáo y học: " Real time analysis of b2-adrenoceptor-mediated signaling kinetics in Human Primary Airway Smooth Muscle Cells reveals both ligand and dose dependent differences" ppt
Bạn đang xem bản rút gọn của tài liệu. Xem và tải ngay bản đầy đủ của tài liệu tại đây (777.11 KB, 10 trang )
RESEA R C H Open Access
Real time analysis of b
2
-adrenoceptor-mediated
signaling kinetics in Human Primary Airway
Smooth Muscle Cells reveals both ligand and
dose dependent differences
Charlotte K Billington
*
and Ian P Hall
Abstract
Background: b
2
-adrenoceptor agonists elicit broncho dilator responses by binding to b
2
-adrenoceptors on airway
smooth muscle (ASM). In vivo, the time between drug administration and clinically relevant bronchodilation varies
significantly depending on the agonist used. Ou r aim was to utilise a fluoresce nt cyclic AMP reporter probe to
study the temporal profile of b
2
-adrenoceptor-mediated signaling induced by isoproterenol and a range of
clinically relevant agonists in human primary ASM (hASM) cells by using a modified Epac protein fused to CFP and
a variant of YFP.
Methods: Cells were imaged in real time using a spinning disk confocal system which allowed rapid and direct
quantification of emission ratio imaging following direct addition of b
2
-adrenoceptor agonists (isoproterenol,
salbutamol, salmeterol, indacaterol and formoterol) into the extracellular buffer. For pharmacological comparison a
radiolabeling assay for whole cell cyclic AMP formation was used.
Results: Temporal analysis revealed that in hASM cells the b
2
-adrenoceptor agonists studied did not vary
significantly in the onset of initiation. However, once a response was initiated, significant differences were observed
in the rate of this response with indacaterol and isoproterenol inducing a significantly faster response than
salmeterol. Contrary to expectation, reducing the concentration of isoproterenol resulted in a significantly faster
initiation of response.
Conclusions: We conclude that confocal imaging of the Epac-based probe is a powerful tool to explore b
2
-
adrenoceptor signaling in primar y cells. The ability to analyse the kinetics of clinically used b
2
-adrenoceptor
agonists in real time and at a single cell level gives an insight into their possible kinetics once they have reached
ASM cells in vivo.
Introduction
Frontline drugs in the treatment of asthma and chronic
obstructive pulmonary disease (COPD) target b
2
-adreno-
ceptors on airway smooth muscle cells and thereby elicit
a bronchodilatory response. These drugs are grouped
into short-acting and long-acting b
2
-adrenoceptor ago-
nists (SABAs and LABAs respectively) [1]. SABAs
include salbutamol (albuterol) whilst LABAs include
salmeterol and terbutaline. Formoterol can be consid-
ered as both short-acting and long-acting due to its
rapid onse t and long duration of action [2]. Recently a
new category was created to encompass the Ultra-long-
acting b
2
-adrenoceptor agonists such as indacaterol [3].
Following binding of agonist to b
2
-adrenoceptors on
airway smooth muscle, a well-documented signaling cas-
cade is initiated resulting in activation of adenylyl
cyclase, cyclic AMP formation, protein kinase A (PKA)
activation and ultimately airway relaxation [4]. In addi-
tion to PKA activation, cyclic AMP also binds to and
activates Epac whose functi onal role in airway smooth
* Correspondence:
Division of Therapeutics and Molecular Medicine, Nottingham Respiratory
Biomedical Research Unit, Floor D, South Block, University Hospital of
Nottingham, The University of Nottingham, Nottingham, NG7 2UH, UK
Billington and Hall Respiratory Research 2011, 12:89
/>© 2011 Billington and Hall; licensee BioM ed Central Ltd. This is an Open Access article distributed under the terms of the Creative
Commons Attribution License ( 0), which permits unrestricted use , distribution, and
reproduction in any medium, provided the original work is properly cited.
muscle cells has recently received significant scrutiny
with investigators attempting to dissect PKA- versus
Epac-mediated functional outputs [5-9].
In vivo, the time between drug administration and
bronchodilation varies significantly depending on the
b
2
-adrenoceptor agonist used (e.g. < 2 minutes for sal-
butamol c ompared to ~30 minutes for salmeterol) [2].
Much of this variability, particularly with respect to sal-
meterol, is hypothesised to be due to pharmacokinetic
properties governing distribution in the airways where
more lipophilic compounds become retarded by succes-
sive cell membranes (Sears et al., 2005). Whilst it is easy
to measur e the total time between drug administration
and clinical effect in vivo for a range of b
2
-adrenoceptor
agonists, it is much more difficult to decipher the
mechanisms responsible for the observed differe nces
between agonists.
In this study we aimed to quantify agonist-specific dif-
ferences in the onset of b
2
-adrenoceptor activation at
the membrane of the target cell, the human airway
smooth muscle cell. Our aim was also to investigate in
real time the lag between the addition of b
2
-agonist to
the buffer surrounding the cell and the initiation of b
2
-
adrenoceptor-medi ated signal ing in addition to the sub-
sequent rate of this response. For the studies described
in this paper, we cho se to use a previously reported and
well-characterised fluorescent reporter probe as a read-
out for b
2
-adrenoceptor-mediated signaling designed,
cloned and characterised by Jalink and colleagues,
namely CFP-Epac(dDEP, CD)-VENUS [10,11]. This
probe is homogenously distributed throughout the cell
thus cyclic AMP responses can be imaged in a global
manner. The probe was visualised in real time on a
spinning disk confocal microscope which, in contrast to
laser scanning confoc al microscopes, does not require
extensive corrective measurements and algorithms to
overcome the instability of excitation sources and coun-
teract the manipulation by the user of pinhole size,
detector gain, amplifier offset, amplifier gain and excita-
tion intensities between exper iments. In addition, as the
probe described is a single polypeptide and thus has
fixed stoichiometry of fluorescent proteins, we were able
to quantify emission ratioing as can be done with a
widefield microscope, however with the advantage of
acquiring high quality confocal images (discussed in
[12]. The resulting timecourse refle cting the conforma-
tional change of the probe due t o the binding of cyclic
AMP was analysed in terms of (1) time lag b etween the
direct ad dition of drug into the buffer surrounding the
cell and the initiation of a measurable r esponse by the
probe (i.e. an increase in the emission ratio from base-
line) and (2) the rate of this response. Analyses involved
comparing responses to isoproterenol and a range of
clinically relevant b
2
-adrenoceptor agonists.
Here we report that when the initiation of Epac repor-
ter activity was assessed, there was no difference
between the b
2
-adrenoceptor agonists studied. However,
in terms of the rate of response, indacaterol and isopro-
terenol were observed to be faster than salmeterol
whereas salbutamol and formoterol exhibited intermedi-
ate rate of response times. When the kinetics of differ-
ent concentratio ns of isoproterenol were compa red
surprisingly the time between direct drug addition and
an initiation of a response was significantly slower with
higher concentrations of isoproterenol.
Methods
Human Airway Smooth Muscle Cell culture
Human a irway smooth muscle (hASM) cells were pre-
pared as previously described either from explants of
trachealis muscle obtained from individuals free of
respiratory disease [13] or via enzymatic dispersion from
individuals undergoing thoracotomy [14]. Ethical
approval was obtained from the Nottingham Local Ethi-
cal Research Committee (EC00/165). Cells were routi-
nely cultured in Dulbecco’ s modified Eagles media
(DMEM) containing 10% fetal calf serum and glutami ne
(2 mM) and incubated a t 37°C in 5% CO
2
and 95% air.
Cells isolated and cultured in this way have been exten-
sively characterised and shown to retain many of the
phenotypic properties of freshly isolated airway smooth
muscle cells [15,16].
Transfection of hASM cells
hASM cells were allowed to reach 50-80% confluency
prior to transfect ion and then incubated for a further
24-48 h. L ipofectamine 2000 (Invitrogen, Paisley, UK)
was used as the transfection reagent as per manufac-
turer’s instructions. Three microlitres of Lipofectamine
2000 and 1 μg CFP-Epac(dDEP,CD)-VENUS were used
per 35 mm diameter glass-bottomed dish.
Imaging Fluorescence Resonance Energy Transfer (FRET)
Primary hASM cells were seeded into 35 mm No.0
glass-bottomed dishes (Mattek Corp., Ashland, MA,
USA) and transfected as described above. Cells selected
for imaging had similar levels of fluorescence and dis-
played a diffuse distribution of CFP-Epac(dDEP,CD)-
VENUS throughout the cell. For imaging purposes cells
were rinsed twice with KREBs buffer (118 mM NaCl,
4.7 mM KCl, 1.2 mM MgSO
4
, 1.3 mM CaCl
2
,1.2mM
KH
2
PO
4
,4.2mMNaHCO
3
, 10 mM HEPEs, 11.7 mM
Glucose) prior to 2 ml KREBs buffer being added to the
well. As required drugs were added to the well in 20 μl
volumes. Cells were imaged on an inverted microscope
(Zeiss AxioObserver) w ith widefield and spinning disk
confocal capabilities (imaging system including Yoko-
gawa CSU22 spinning disk confocal head assembled by
Billington and Hall Respiratory Research 2011, 12:89
/>Page 2 of 10
Improvision, Perkin Elmer, Coventry, UK). All studies
utilised a 63× water immersion objective (1.3 numerical
aperture, Zeiss). For confocal images, cells were excited
with a laser emitting at 440 nm and the emission of
CFP and YFP were detected by rapid switching of 470
nm and 535 nm bandpass filters positioned in a filter
wheel and the FRET ratios measured as changes in the
470 nm/535 nm emission intensities. Images were
acquired and processed with Volocity 5.0 software
(Improvision, Perkin Elmer, Coventry, UK).
Cyclic AMP Assay
Tritiated cyclic AMP production was assayed using a
prelabeling assay exactly as previously described [13].
Data Analysis and Statistical Procedures
Differences between the results following exposure to
b
2
-adrenoceptor agonists were compared by analysis of
variance (ANOVA) in conjunction with Bonferroni’s
post hoc test. Figures represent mean values (± SEM).
Statistical analyses, curve fitting and generation of EC
50
data were performed by using GraphPad Prism v5
(GraphPad, San Diego, CA, USA); a P-value < 0.05 was
considered significant.
Materials
All chemicals were analytical grade or higher. Plastic-
ware was from Costar (High Wycombe, UK). Glass-bot-
tomed dishes were from Mattek (Ashland, MA, USA).
All chemicals and reagents were purchased from Sigma-
Aldrich (Poole, UK) unless otherwise stated. The CFP-
Epac(dDEP,CD)-VENUS construct was a kind gift from
Dr Kees Jalink (NKI, Amsterdam, Netherlands). Lipofec-
tamine 2000 was from Invitrogen (Paisley, UK).
Results
Real time emission ratio imaging of Epac-based probe
In a previous publication, we described how b
2
-adreno-
ceptor-mediated cyclic AMP signaling was assessed in
hASM cells by visualising and measuri ng changes in
ratio imaging between CFP and YFP variant fluoro-
phores fused to Epac1 [17]. We were able to extend
these studies by utilising a higher magnification lens, a
more sensitive camera and by transferring the studies to
a confocal rather than epifluorescent microscope. Whilst
it is possible to quantify Fluorescence Resonance Energy
Transfer (FRET)/emission ratioing using a classic laser
point scanning microscope, this is associated with a
number of challenging technical issues (see introduc-
tion). In these studies we therefore used a spinning disk
confocal microscope (see methods) which allows altera-
tions in the emission ratio to be assessed at high magni-
fication and high speed. It is particularly suited to use
with single-polypeptide F RET sensors and allows
changes in emission ratio to be directly quantified and
traces to be visualised live.
The single polypeptide cytosolic probe utilised in these
studies termed CFP-Epac(dDEP,CD)-VENUS, was pro-
duced by the Jalink group and has been described pre-
viously [10,17] . Figure 1A shows CFP emission following
excitation at 430 nm in a typical hASM cell 48 hours
after transfection with CFP-Epac(dDEP,CD)-VENUS and
confirms the cytosolic distribution of the probe as
reported by ourselves and others [10,17]. As under basal
conditions the CFP and YFP-variant (Venus) fluoro-
phores of CFP-Epac(dDEP,CD)-VENUS are in close
proximity FRET occurs. Figure 1B shows an uncorrected
image of this i.e. YFP emission following excitation of
CFP at 430 nm in the same hASM cell under basal
conditions.
Exposure to elevators of cyclic AMP, in this case the
non-selective b-adrenoceptor agonist, isoproterenol (10
μM), results in the binding of cyclic AMP to Epac and a
subsequent conformational change of Epac leading to an
increased distance between the CFP and YFP termini of
the probe and a subsequent loss of FRET. The trace of
the changes in emission ratio are shown in Figure 1C.
Traces such as this were used to extract the data shown
in the majority of the figures in this m anuscript. As
hASM cells solely express the b
2
-adrenoceptor subtype,
all responses to isoproterenol essentially reflect b
2
-adre-
noceptor activation [16].
Pharmacological profile of isoproterenol determined via
confocal FRET
Previous studies using widefield imaging of the Epac-
based probe had enabled us to produce concentration
response curves to isoproterenol by perfusing a single
cell with increasing doses of drug, allowing time fo r cel-
lular recovery after each dose [17]. We extended these
studies to see whether a full concentration curve could
be produced from confocal FRET data. As confocal ima-
ging only utilises fluorescent signals from a thin o ptical
slice rather than the entire thickness of t he cell (as in
widefield imaging) we were concerned that the vastly
reduced number of fluorescent events that would be
measured confocally may g ive variable data. Despit e the
technically challenging nature of these experiments and
the potential for inter-cell variability, it was possible to
produce a concentration response curve to isoproterenol
as shown in Figure 2A (pEC
50
= 8.6 ± 0.25, n = 3-9).
When compared with a concentration response curve
produced by a traditional radiolabeling assay
(Figure 2B), it is apparent that maximal Epac probe acti-
vation occurs at concentrations of isoproterenol which
are submaximal in terms of whole cell cyclic AMP mea-
sured using radiolabeling assays (pEC
50
= 7.75 ± 0.07, n
= 3). This implies probe saturation may be occurring at
Billington and Hall Respiratory Research 2011, 12:89
/>Page 3 of 10
concentrations of isoproterenol above around 10
-7
M
and 10
-6
M.
Pharmacological profile of a range of b
2
-adrenoceptor
agonists determined via confocal emission ratio imaging
In addition to isoproterenol, we assessed the fold
increase in confocal emission ratio imaging in response
to a range of clinically relevant b
2
-adrenoceptor agonists
at co ncentrations we have prev iously shown to be maxi-
mal for cyclic AMP formation [18] namely salbutamol
(1 μM), salmeterol (100 nM), for moterol (1 μM) and
indacatero l (1 μM) (Figure 3). When confocal emission
ratioing was utilised as a readout, only salmeterol
produced a significantly smaller response than isoproter-
enol (10 μM) suggesting, as highlighted in the previous
section, that the Epac probe is maximally activated at
lower concentrations than are maximal for who le cell
cyclic AMP formation.
Temporal profile of a range of b
2
-adrenoceptor agonists
One major advantage of the described Epac-based
studies utilising the spinning disk imaging system i s
the ability to measure b
2
-adrenoceptor-mediated
responses at high speed and in real time. Thus given
the clinical differences in rate of onset of action
of these drugs we explored the rate of cyclic
A
B
C
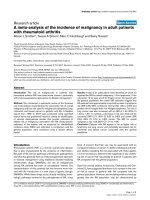
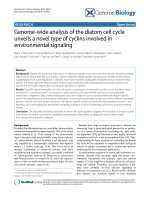
Figure 1 Isoproterenol-induced changes in cyclic AMP activity in a single hASM cell imaged via confocal microscopy using the altered
emission profile of CFP-Epac(dDEP,CD)-VENUS as a readout. CFP-Epac(dDEP,CD)-VENUS expression 48 hours post-transfection is shown in
panel A (CFP excited with 440 nm and 480 nm CFP emission fluorescence recorded). Panel B shows uncorrected FRET in the same cell under
basal conditions (CFP excited with 440 nm and 535 nm FRET emission fluorescence recorded). Panel C is a representative trace of the altered
emission ratio (essentially a change in FRET) in real time in response to 10 μM isoproterenol (+ Iso).
Billington and Hall Respiratory Research 2011, 12:89
/>Page 4 of 10
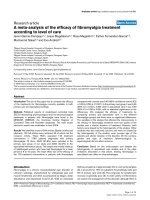
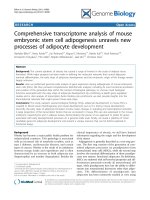
Figure 2 Cyclic AMP activation induced by a range of doses of isoproterenol in hASM cells using (A) CFP-Epac(dDEP,CD)-VENUS
activation or (B)
3
H-cyclic AMP formation as a readout. (A) For Epac-based studies single hASM cells expressing CFP-Epac(dDEP,CD)-VENUS
were excited at 440 nm and the emission ratio (470/535) changes collected in real time. The maximal ratio was recorded and plotted. Data are
expressed as fold over basal. Each data point represents the mean (± SEM) of 3-9 separate experiments. (B) For studies investigating
3
H-cyclic
AMP formation, monolayers of hASM cells in 24 well plates were labelled with
3
H-adenine for 2 hours and then exposed to the appropriate
concentrations of isoproterenol for 5 minutes. The reaction was terminated by addition of hydrochloric acid and total
3
H-labelled cyclic AMP was
collected via column-based separation and quantified by scintillation counting [13]. Data are expressed as fold over basal. Each data point
represents the mean (± SEM) of 3-6 experiments.
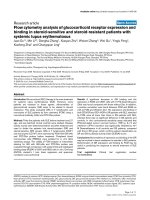
Figure 3 Cyclic AMP activation induced by single doses of a range of b
2
-adrenoceptor agonists in hASM cells using (A) CFP-Epac
(dDEP,CD)-VENUS activation or (B)
3
H-cyclic AMP formation as a readout. b
2
-adrenoceptor agonists studied were isoproterenol (10 μM),
salbutamol (1 μM), salmeterol (100 nM), indacaterol (1 μM) and formoterol (1 μM). (A) For FRET-based studies single hASM cells expressing CFP-
Epac(dDEP,CD)-VENUS were excited at 440 nm and the emission ratio (470/535) changes collected in real time. The maximum ratio observed
was recorded and plotted. Data are expressed as fold over basal. Each data point represents the mean (± SEM) of 6-16 separate experiments.
**denotes P < 0.01. (B) For studies investigating
3
H-cyclic AMP formation, monolayers of hASM cells in 24 well plates were labelled with
3
H-
adenine for 2 hours and then exposed to the appropriate concentrations of b
2
-adrenoceptor agonist for 5 minutes. The reaction was terminated
by addition of hydrochloric acid and total
3
H-labelled cyclic AMP was collected via column-based separation and quantified by scintillation
counting [13]. Data are expressed as fold over basal. Each data point represents the mean (± SEM) of 3-9 experiments. * denotes P < 0.05,
**denotes P < 0.01.
Billington and Hall Respiratory Research 2011, 12:89
/>Page 5 of 10
AMP-induced Epac activation that the different b
2
-
adrenoceptor agonists could achieve. Previous attempts
to look at early time points using whole cell cyclic
AMP assays have been problematic due to the techni-
cal constraints of the assay. Rapid imaging (5 second
intervals) using the Epac probe allows this problem to
be addressed. Temporal analyses included measuring
(1) time lag between the d irect addition of drug into
the buffer surrounding the cell and the initiation of a
measurable response by the probe (Figure 4A), (2)
time between the initiation o f the response and the
time at which this was maximal (Figure 4B) and (3) a
combination of (1) and (2), i.e. the total time between
drug addition and maximal effect (Figure 4C). Figure
4D depicts which part of the response was analysed
for e ach set of results.
No significant differe nce was observed between b
2
-
adrenoceptor agonists in the time between direct addi-
tion of the drug and the initiation of a response. Inter-
estingly however, salmeterol, despite its known slo w
duration of onset of bronchodilation, exhibited a trend
towards a faster onset of response than most of the b
2
-
adrenoceptor agonists studied although this did not
rea ch significance. Significant differences were observed
inthetimestakenforaresponsetoreachamaximal
point with salmeterol being significantly slower than iso-
proterenol and indacaterol whilst salbutamol and formo-
terol were intermediate to these (Figure 4B). When the
total time between drug addition and maximal response
was assessed, no significant difference was observed
between b
2
-adrenoceptor agonists, and all agents
achieved maximum activation within 5 minutes.
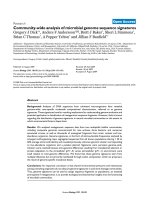
Figure 4 Time taken for a range of b
2
-adrenoceptor agonists to (A) initiate an increase in CFP-Epac(dD EP,CD)-VE NUS activation and
(B) to induce a maximal response c.f. initiation. The time between response initiation and maximal response is shown in C. The labelled
trace in D depicts how these data were obtained from real time traces. The b
2
-adrenoceptor agonists studied were isoproterenol (10 μM),
salbutamol (1 μM), salmeterol (100 nM), indacaterol (1 μM) and formoterol (1 μM). Single hASM cells expressing CFP-Epac(dDEP,CD)-VENUS were
excited at 440 nm and the emission ratio (470/535) changes collected in real time. Each data point represents the mean (± SEM) of 6-19
experiments. * denotes P < 0.05, ***denotes P < 0.001.
Billington and Hall Respiratory Research 2011, 12:89
/>Page 6 of 10
Analysis of the rate of b
2
-adrenoceptor-agonist mediated
responses
To ensure that the differences observed in Figure 4
could not solely be explained by saturation of the Epac
probe, the first 30 seconds of each response was ana-
lysed. It was observed that in this time period none of
the b
2
-adrenoceptor agonists studied had achieved maxi-
mal activation and hence we were satisfied that the
probe was not saturating in this time period. This initial
responsewasanalysedbothbyareaunderthecurve
(AUC) (Figure 5A) and ratio change per minute. The
trends observed in Figure 4 were still apparent following
these analyses with salmeterol causi ng b
2
-adrenoceptor-
induced probe activation at a significantly slower rate
than isoproterenol and indacaterol and with the
response to salbutamol being intermediate to these.
When ratio change per minute was analysed again sal-
meterol exhibited a significantly slower change than iso-
proterenol and indacaterol (n = 6-13, p < 0.01 for both
comparisons). In addition, formoterol demonstrated a
significantly slower increase in probe activation com-
pared to isoproterenol in terms of ratio change per min-
ute (n = 6-13, p < 0.05).
Lower concentrations of isoproterenol initiate Epac-based
probe activation faster than higher concentrations
Having studied the temporal profile of different b
2
-adre-
noceptor agonists, finally we investigated whether ago-
nist concentration impacted response times (Figure 6).
Contrary to expectation it was determined that higher
concentrations of isoproterenol were significantly slower
to initiate a b
2
-adrenoceptor-mediated response. How-
ever, this difference was observed in the time lag
between the point of drug addit ion and the respo nse
initiation as oppose to between drug initiation and
maximal response. The difference in respon se was large,
with 10
-5
M isoproterenol taking almost 10 times as
long to initiate a response compared with 10
-6
M(p<
0.05, n = 6-19). This does not appear to be a non-speci-
fic effect seen only at high doses as a further concentra -
tion-dependent decrease in the rate of onset of
Figure 5 Re-analysis of data shown in figure 4 concentrating on the response observed in the first 30 seconds after initiation i.e. at a
timepoint whereby probe saturation has not occurred. Data was analysed via (A) Area Under the Curve (AUC). B outlines the region utilised
for these additional analyses. Each data point represents the mean (± SEM) of 6-19 experiments.* denotes P < 0.05, ** denotes P < 0.01.
Figure 6 Time taken for a range of concentrations of the b
2
-
adrenoceptor agonist isoproterenol (10
-8
M-10
-5
M) to initiate an
increase in CFP-Epac(dDEP,CD)-VENUS activation. These data
were obtained from real time traces comparable to those depicted
in Figure 4D. Single hASM cells expressing CFP-Epac(dDEP,CD)-
VENUS were excited at 440 nm and the emission ratio (470/535)
changes collected in real time. Each data point represents the mean
(± SEM) of 4-19 experiments. * denotes P < 0.05.
Billington and Hall Respiratory Research 2011, 12:89
/>Page 7 of 10
activation was observed between hASM cells exposed
to10
-6
M versus 10
-8
M isoproterenol (p < 0.05, n = 6).
Discussion
In this paper we describe b
2
-adrenoceptor-mediated
activation of the Epac-based probe, CFP-Epac(dDEP,
CD)-VENUS in human primary airway smooth muscle
(hASM) cells. By transfecting this probe into hASM
cells, we were able to image and quantify pharmacologi-
cal and temporal information regarding cyclic AMP
activity following exposure to a range of b
2
-adrenocep-
tor agonists. We chose to utilise this monomeric Epac-
based probe in preference to the multimeric PKA-based
probe initially utilised by Zaccolo and colleagues [19]
mainly as only monomeric reporter probes are suitable
for the high speed emission ratio imaging experiments
required for this study [12] but also as the Epac-based
probe has been reported to have a larger dynamic range
and to be sensitive to lower concentrations of cyclic
AMP than the PKA-based probe [11]. As highlighted in
the introduction, the spinning disk confocal imaging sys-
tem offers major advantages over the commonly used
laser scanning confocal microscopes when used for real
time visualisation and quantification of FRET-based
probes in live cells and although it produces confocal
images, in terms of simplicity of data analysis a nd con-
trols, it can be considered as being equivalent to wide-
field systems. It is thus not subject to the technical
issues affecting laser scanning confocal microscopes
which have been described previously [12,20]. T he spin-
ning disk system is also particularly powerful in terms
of the ability to assess Epac a ctivation at short time
intervals (time interval between image acquisition is ~5
seconds in the studies shown in this paper) which has
all owed the dynamics of the onset of these agents to be
assessed accurately in this hASM cultured cell system.
The concept of different ligands inducing diverse
responses via the same G-protein coupled receptor
(GPCR) in terms of magnitude of effect (i.e. full versus
partial agonists) has been accepted for many years. It is
now increasingly clear, however, that there are also
ligand-dependent differences in the extent to which dis-
parate signaling pathways are activated despite the same
GPCR being activated. Perhaps the most extreme exam-
ple of this was seen in a study by Woo et al.,who
observed different isomers of fenoterol to drive endo-
genous b
2
-adrenoceptors to signal via Gs- or Gi-proteins
to a different extent. Specifically S,R isomers of fenoterol
acting at b
2
-adrenoceptors in adult rat cardiomyocy tes
were observed to signal to a greater extent via Gi-
mediated ERK activation when compared with R,R iso-
mers whilst the converse was observed when Gs-
mediated effects were quantified [21]. As this phenom-
enon has become more widely reported it has attra cted
a variety of labels including biased agonism, conforma-
tional selection, stimulus trafficking, ligand-directed sig-
naling and ligand functional selectivity; however a
consensus term has not yet been chosen [22]. It has also
been the subject of a number of reviews [23-27] with
ligand-directed signaling specifically at b -adrenoceptors
being systematically reviewed by Evans et al., last year
[22]. As outlined in these reviews, the accepted explana-
tion for ligand-directed signaling is the ability of diverse
ligands to induce varied conformational receptor states
resulting in the favouring of one downstream pathway
over another which has intriguing therapeutic
implications.
Despite the recent expansion of studies investigating
ligand-directed signaling in terms of response size,
downstream effectors, and subsequent receptor desensi -
tiation or internalisation, there are limited reports of the
kinetics of these effects and only one utilise endogenous
b
2
-adrenoceptors in human primary cells [28]. In their
review, Evans et al., [22] highlighted the importance of
confirming “proof of principle” studies of ligand-directed
signaling in recombinant systems by utilising more ther-
apeutically relevant models where receptors are present
at nearer physiological levels and we believe that the
single cell imaging of hASM cells described in this
manuscript provided an ideal system in which to investi-
gate ligand-directed signaling at endogenous b
2
-
adrenoceptors.
Utilising HEK293-GloSensor cells and human bron-
chial smooth muscle cells both endogenously expressing
b
2
-adrenoceptors Rosethorne and colleagues reported a
correl ation between intrinsic agonist efficacy and rate of
cyclic AMP generation [28]. Lohse and colleagues also
observed partial agonists to elicit slower responses than
full agonists in their studies into the kinetics of recom-
binant b
2
-adrenoceptor activation in HEK293 and CHO
cells following exposure to both endogenous (epinephr-
ine and norepinephrine) and synthetic (isoproterenol,
fenoterol and terbutaline) ligands [29]. This finding
echoed previous work from the same group when the
a
2A
-adrenoceptor was investigated [30].
In our studies, significant ligand-dependent differences
in the kinetics of the signaling response of endogenous
b
2
-adrenoceptors were also observed. In terms of the
time lag between drug addition and initiation of
response, higher efficacy did not appear to translate into
faster response initiation, indeed it was interesting to
note that the partial agonist salmeterol initiated a
response as rapidl y as the other agonists studied (Figure
4A). However, salmeterol was significantly slower to
reach a maximal response implying that this phase o f
signaling could be dependent upon drug efficacy. This
was perhaps surprising as it occurr ed despite salmeterol
requiring a smaller rise in ratio change compared to
Billington and Hall Respiratory Research 2011, 12:89
/>Page 8 of 10
isoproterenol before a maximum response was observed
i.e. at maximal activity salmeterol induced a 1.13 fold
increase over baseline whereas ma ximal probe activation
was induced by isoproterenol 1.25 fold over baseline
(see Figure 3).
In addition to the correlation between efficacy and
rate of cyclic AMP response, Rosethorne et al disc ussed
the link between rate of response and the lipophilicity of
each compound with the expectation being that
increased lipophilicity would correlate with a slower rate
of response. Although salmeterol and indacaterol exhibit
almost identical lipophilici ty, salmeterol demons trated a
slower onset of action than indacaterol and indacaterol
induced cyclic AMP formation at an even faster rate
than the hydrophilic salbutamol which led the authors
to conclude that efficacy was a stronger determinant of
clinical onset than lipophilicity.
Our data also does not support increased lipophilicity
of the agonist as being t he key driver f or a slower rate
of onset and, as mentioned above, salmeterol was
observed to initiate a response as rapidly as all the other
agonists studied (Figure 4A). Interestingly there is a
trend towards the more lipophilic drugs (indacaterol,
salmeterol) initiating a rate of response faster than the
hydrophilic ones (isoproterenol, salbutamol).
One very surprising finding from our data was the
concentration-dependent effect of isoproterenol on the
rate of b
2
-adrenoceptor-mediated Epac probe activation.
Two very recent studies report temporal data of b
2
-
adrenoceptor-mediated activity and each of these
showed an increased rate of response correlating with
increased agonist concentration [29,31]. The initiation
of resp onse in both of these studies appeared to be con-
centration-independent although this may be an incor-
rect conclusion to draw as the traces may be normalised
such that the initiation of response is at the same point
to allow comparison of response magnitude. Schroder et
al., utilised a novel technique based on dynamic mass
redistribution (DMR) of cellular constituents to quantify
GPCR signaling in real time in live cells and representa -
tive data shown from 4 experiments in CHO cells over-
expressing b
2
-adrenoceptors appears to show a quicker
response to agonist (orcipren aline) at higher concentra-
tions than lower ones although any statistical analysis of
this was not commented on.
A possible explanation for the slower response at high
concentrations of agonist is that an increased proportion
of b
2
-adrenoceptors with bound ligand essentially over-
whelm the downstream cascade inducing a negative
feedback mechanism which slows down the rate at
which the pathway is activ ated without altering the
extent to which it is activated. This negative feedbac k
mechanism could be GRK- or arrestin- or phosphodies-
terase-mediated or could potentially be due to a split in
the cyclic AMP-driven signal between PKA and Epac.
Determining whether the observed phenomenon is
observed with clinically relevant b
2
-adrenoceptor ago-
nists and elucidating the mechanisms involved requires
additional investigation.
In sum mary therefore we describe for the first time a
confocal based imaging assessment of the real time
kinetics of b
2
-adrenoceptor-mediated Epac activation in
primary cultured hASM cells. Both ligand- and concen-
tration-dependent d iffere nces in kinetics w ere observed
and these data suggest that the delayed onset of bronch-
odilation seen with salmeterol is not related to altered
pharmacodynamic effects at the cell surface, but is prob-
ably due to pharmacokinetic effects governing distribu-
tion in the airways as has previously been suggested [2].
These approaches provide valuable insights into the
mechanism of activ ation of downstream pathways sti-
mulated by b
2
-adrenoceptor agonists, and are potentially
extendable into other primary cell systems.
Abbreviations
hASM: human airway smooth muscle; cAMP: cyclic AMP; Epac: Exchange
Protein directly Activated by Cyclic AMP; CFP: Cyan Fluorescent Protein; YFP:
Yellow Fluorescent Protein; FRET: Fluorescence Resonance Energy Transfer.
Acknowledgements
We are grateful to Steven Charlton (Novartis, UK) for providing the
indacaterol used in this project. We are also grateful to Kees Jalink and
colleagues for providing the CFP-Epac(dDEP,CD)-VENUS construct and to
Kees Jalink for helpful discussion. This work was supported by the Medical
Research Council, UK [G0400910]
Authors’ contributions
CKB participated in research design, conducted experiments, performed data
analysis and drafted the manuscript. IPH conceived of the study, participated
in research design and revised the manuscript critically. Both authors read
and approved the final manuscript.
Competing interests
The authors declare that they have no competing interests.
Received: 22 March 2011 Accepted: 2 July 2011 Published: 2 July 2011
References
1. Hall IP TA: Beta-agonists. In Asthma 3 edition. Edited by: Clark TH GS, Lee
TH. London: Chapman and Hall; 1992:341-365.
2. Sears MR, Lotvall J: Past, present and future-beta2-adrenoceptor agonists
in asthma management. Respir Med 2005, 99(2):152-170.
3. Cazzola M, Matera MG: Novel long-acting bronchodilators for COPD and
asthma. Br J Pharmacol 2008, 155(3):291-299.
4. Billington CK, Penn RB: Signaling and regulation of G protein-coupled
receptors in airway smooth muscle. Respir Res 2003, 4(1):2.
5. Roscioni SS, Kistemaker LE, Menzen MH, Elzinga CR, Gosens R, Halayko AJ,
Meurs H, Schmidt M: PKA and Epac cooperate to augment bradykinin-
induced interleukin-8 release from human airway smooth muscle cells.
Respir Res 2009, 10:88.
6. Roscioni SS, Maarsingh H, Elzinga CR, Schuur J, Menzen M, Halayko AJ,
Meurs H, Schmidt M: Epac as a novel effector of airway smooth muscle
relaxation. J Cell Mol Med 2010.
7. Roscioni SS, Prins AG, Elzinga CR, Menzen MH, Dekkers BG, Halayko AJ,
Meurs H, Maarsingh H, Schmidt M: Functional roles of Epac and PKA in
human airway smooth muscle phenotype plasticity. Br J Pharmacol 2011.
8. Yan H, Deshpande DA, Misior AM, Miles MC, Saxena H, Riemer EC,
Pascual RM, Panettieri RA, Penn RB: Anti-mitogenic effects of beta-
Billington and Hall Respiratory Research 2011, 12:89
/>Page 9 of 10
agonists and PGE2 on airway smooth muscle are PKA dependent. FASEB
J 2011, 25(1):389-397.
9. Kassel KM, Wyatt TA, Panettieri RA Jr., Toews ML: Inhibition of human
airway smooth muscle cell proliferation by beta 2-adrenergic receptors
and cAMP is PKA independent: evidence for EPAC involvement. Am J
Physiol Lung Cell Mol Physiol 2008, 294(1):L131-138.
10. van der Krogt GN, Ogink J, Ponsioen B, Jalink K: A comparison of donor-
acceptor pairs for genetically encoded FRET sensors: application to the
Epac cAMP sensor as an example. PLoS ONE 2008, 3(4):e1916.
11. Ponsioen B, Zhao J, Riedl J, Zwartkruis F, van der Krogt G, Zaccolo M,
Moolenaar WH, Bos JL, Jalink K: Detecting cAMP-induced Epac activation
by fluorescence resonance energy transfer: Epac as a novel cAMP
indicator. EMBO Rep 2004, 5(12):1176-1180.
12. Jalink KvR, J: FilterFRET:Quantitative imaging of sensitized emission. In
FRET and FLIM Techniques. Volume 33. Edited by: Gadella TWJ. Burlington:
Elsevier; 2009:289-349.
13. Le Jeune IR, Shepherd M, Van Heeke G, Houslay MD, Hall IP: Cyclic AMP-
dependent transcriptional up-regulation of phosphodiesterase 4D5 in
human airway smooth muscle cells. Identification and characterization
of a novel PDE4D5 promoter. J Biol Chem 2002, 277(39):35980-35989.
14. Peel SE, Liu B, Hall IP: A key role for STIM1 in store operated calcium
channel activation in airway smooth muscle. Respir Res 2006, 7:119.
15. Hall IP, Kotlikoff M: Use of cultured airway myocytes for study of airway
smooth muscle. Am J Physiol 1995, 268(1 Pt 1):L1-11.
16. Hall IP, Widdop S, Townsend P, Daykin K: Control of cyclic AMP levels in
primary cultures of human tracheal smooth muscle cells. Br J Pharmacol
1992, 107(2):422-428.
17. Billington CK, Le Jeune IR, Young KW, Hall IP: A major functional role for
phosphodiesterase 4D5 in human airway smooth muscle cells. Am J
Respir Cell Mol Biol 2008, 38(1):1-7.
18. Sayers I, Hawley J, Stewart CE, Billington CK, Henry A, Leighton-Davies JR,
Charlton SJ, Hall IP: Pharmacogenetic characterization of indacaterol, a
novel beta(2)-adrenoceptor agonist. Br J Pharmacol 2009, 158(1):277-86.
19. Zaccolo M, Pozzan T: Discrete microdomains with high concentration of
cAMP in stimulated rat neonatal cardiac myocytes. Science 2002,
295(5560):1711-1715.
20. van Rheenen J, Langeslag M, Jalink K: Correcting confocal acquisition to
optimize imaging of fluorescence resonance energy transfer by
sensitized emission. Biophys J 2004, 86(4):2517-2529.
21. Woo AY, Wang TB, Zeng X, Zhu W, Abernethy DR, Wainer IW, Xiao RP:
Stereochemistry of an agonist determines coupling preference of beta2-
adrenoceptor to different G proteins in cardiomyocytes. Mol Pharmacol
2009, 75(1)
:158-165.
22. Evans BA, Sato M, Sarwar M, Hutchinson DS, Summers RJ: Ligand-directed
signalling at beta-adrenoceptors. British Journal of Pharmacology 2010,
159(5):1022-1038.
23. Hoffmann C, Zurn A, Bunemann M, Lohse MJ: Conformational changes in
G-protein-coupled receptors-the quest for functionally selective
conformations is open. Br J Pharmacol 2008, 153(Suppl 1):S358-366.
24. Kobilka BK, Deupi X: Conformational complexity of G-protein-coupled
receptors. Trends Pharmacol Sci 2007, 28(8):397-406.
25. Vaidehi N, Kenakin T: The role of conformational ensembles of seven
transmembrane receptors in functional selectivity. Curr Opin Pharmacol
2010, 10(6):775-81.
26. Urban JD, Clarke WP, von Zastrow M, Nichols DE, Kobilka B, Weinstein H,
Javitch JA, Roth BL, Christopoulos A, Sexton PM, et al: Functional selectivity
and classical concepts of quantitative pharmacology. J Pharmacol Exp
Ther 2007, 320(1):1-13.
27. Walker JK, Penn RB, Hanania NA, Dickey BF, Bond RA: New perspectives
regarding beta(2) -adrenoceptor ligands in the treatment of asthma. Br J
Pharmacol 163(1):18-28.
28. Rosethorne EM, Turner RJ, Fairhurst RA, Charlton SJ: Efficacy is a
contributing factor to the clinical onset of bronchodilation of inhaled
beta(2)-adrenoceptor agonists. Naunyn Schmiedebergs Arch Pharmacol
2010, 382(3):255-263.
29. Reiner S, Ambrosio M, Hoffmann C, Lohse MJ: Differential signaling of the
endogenous agonists at the {beta}2-adrenergic receptor. J Biol Chem
2010, 285(46):36188-98.
30. Nikolaev VO, Hoffmann C, Bunemann M, Lohse MJ, Vilardaga JP: Molecular
basis of partial agonism at the neurotransmitter alpha2A-adrenergic
receptor and Gi-protein heterotrimer. J Biol Chem 2006,
281(34):24506-24511.
31. Schroder R, Janssen N, Schmidt J, Kebig A, Merten N, Hennen S, Muller A,
Blattermann S, Mohr-Andra M, Zahn S, et al: Deconvolution of complex G
protein-coupled receptor signaling in live cells using dynamic mass
redistribution measurements. Nature Biotechnology 2010, 28(9):943-950.
doi:10.1186/1465-9921-12-89
Cite this article as: Billington and Hall: Real time analysis of b
2
-
adrenoceptor-mediated signaling kinetics in Human Primary Airway
Smooth Muscle Cells reveals both ligand and dose dependent
differences. Respiratory Research 2011 12:89.
Submit your next manuscript to BioMed Central
and take full advantage of:
• Convenient online submission
• Thorough peer review
• No space constraints or color figure charges
• Immediate publication on acceptance
• Inclusion in PubMed, CAS, Scopus and Google Scholar
• Research which is freely available for redistribution
Submit your manuscript at
www.biomedcentral.com/submit
Billington and Hall Respiratory Research 2011, 12:89
/>Page 10 of 10