Báo cáo y học: " The clinical significance of 5% change in vital capacity in patients with idiopathic pulmonary fibrosis: extended analysis of the pirfenidone trial" potx
Bạn đang xem bản rút gọn của tài liệu. Xem và tải ngay bản đầy đủ của tài liệu tại đây (1.1 MB, 9 trang )
RESEARCH Open Access
The clinical significance of 5% change in vital
capacity in patients with idiopathic pulmonary
fibrosis: extended analysis of the pirfenidone trial
Hiroyuki Taniguchi
1*†
, Yasuhiro Kondoh
1†
, Masahito Ebina
2
, Arata Azuma
3
, Takashi Ogura
4
, Yoshio Taguchi
5
,
Moritaka Suga
6
, Hiroki Takahashi
7
, Koichiro Nakata
8
, Atsuhiko Sato
9
, Yukihiko Sugiyama
10
, Shoji Kudoh
3
,
Toshihiro Nukiwa
2
and for Pirfenidone Clinical Study Group in Japan
Abstract
Background: Our phase III clinical trial of pirfenidone for patients with idiopathic pulmonary fibrosis (IPF) revealed
the efficacy in reducing the decline of vital capacity (VC) and increasing the progression-free survival (PFS) time by
pirfenidone. Recently, marginal decline in forced VC (FVC) has been reported to be associated with poor outcome
in IPF. We sought to evaluate the efficacy of pirfenidone from the aspects of 5% change in VC.
Methods: Improvement ratings based on 5% change in absolute VC, i.e., “improved (VC ≥ 5% increase)”, “stable
(VC < 5% change)”, and “worsened (VC ≥ 5% decrease)” at month 3, 6, 9 and 12 were c ompared between high-
dose pirfenidone (1800 mg/day; n = 108) and placebo (n = 104) groups, and (high-dose and low-dose (1200 mg/
day; n = 55)) pirfenidone (n = 163) and placebo groups. PFS times with defining the disease progression as death
or a ≥ 5% decline in VC were also compared between high-dose pirfenidone and placebo groups, and low-dose
pirfenidone and placebo groups. Furthermore, considering “worsened” and “non-worsened (improved and stable)”
of the ratings at months 3 and 12 as “positive” and “negative”, respectively, and the positive and negative
predictive values of the ratings were calculated in each group.
Results: In the comparison of the improvement ratings, the statistically significant differences were clearly revealed
at months 3, 6, 9, and 12 between pirfenidone and placebo groups. Risk reductions by pirfenidone to placebo
were approximately 35% over the study period. In the comparison of the PFS times, statistically significant
difference was also observed between pirfenidone and placebo groups. The positive/negative predictive values in
placebo and pirfenidone groups were 86.1%/50.8% and 87.1%/71.7%, respectively. Further, the baseline
characteristics of patients worsened at month 3 had generally severe impairment, and their clinical outcomes
including mortality were also significantly worsened after 1 year.
Conclusions: The efficacy of pirfenidone in Japanese phase III trial was supported by the rating of 5% decline in
VC, and the VC changes at month 3 may be used as a prognostic factor of IPF.
Trial Registration: This clinical trial was registered with the Japan Pharmaceutical Information Center (JAPIC) on
September 13
th
, 2005 (Registration Num ber: JAPICCTI-050121).
* Correspondence:
† Contributed equally
1
Dept of Respiratory Medicine and Allergy, Tosei General Hospital, Seto,
Aichi, Japan
Full list of author information is available at the end of the article
Taniguchi et al. Respiratory Research 2011, 12:93
/>© 2011 Taniguchi et al; licensee BioMed Central Ltd. This is an Open Access article distributed under the terms of the Creative
Commons Attribution License ( which permits unrestricted use, distribution, and
reproduction in any medium, provided the ori ginal work is properly cited.
Background
Idiopa thic pulmonary fibrosis (IPF) is a chronic, progres-
sive, and fatal lung disease for which there is no known
cause or proven effective therapy [1,2]. Pirfenidone
(5-methyl-1-phenyl-2-[1H]-pyridone; Shionogi & Co., Ltd.,
Osaka, Japan; MARNAC Inc., Dallas, TX, USA) [3-6] is a
pyridone compound with therapeutic potential for IPF
that has been shown in animal models to have wide-
ranging effects including antifibrotic, anti-inflammatory
and antioxidant activity, although its precise mode of
action is unknown [2,7-11]. A multi-centere, double-blind,
placebo-controlled, randomized phase III clinical trial was
conducted in Japanese patients with IPF to determine the
efficacy and safety of pirfenidone over 52 weeks [12]. Sig-
nificant differences were observed in the decline of vital
capacity (VC; primary endpoint) between placebo group
and high-dose (1800 mg/day) group; and in the secondary
end point, the progression free survival (PFS) time,
between the two groups. Treatment with pirfenidone was
associated with a decreased rate of decline in VC and
increased the PFS time over 52 weeks.
A 10% change in forced VC (FVC) have been reported
to be a promising prognostic indicator, because patients
with ≥ 10% decline in FVC within 6 or 12 months have a
poor prognosis [13-15]. In the treatment guidelines pub-
lished by the American Thoracic Society (ATS)/European
Respiratory Society (ERS) as well, a ≥ 10% change in FVC
and ≥ 15% change in diffusing capacity of the lung for
carbon monoxide (DLCO) are described as indices of
improvement or worsening of disease [16]. To evaluate
changes over a period from 6 months to 1 year, however,
themethodusinga10%changeinFVCasanindexis
not sensitive enough and may not be suitable for actual
clinical setting. Recently, Zappala et al. have reported
that marginal decline in FVC is associated with a poor
outcome in IPF [17]. In this report, the authors demon-
strated that IPF patients had a significantly poor prog-
nosis when the decl ine in FVC after 6 months was either
5% to 10% or ≥ 10%. This information is considered use-
ful for selecting patients with progressive disease and
evaluating therapeutic effects in clinical studies.
Based on this report, we reviewed the efficacy of pirfe-
nidone in the phase III trial in an exploratory manner
using a 5% change in VC as indices, evalu ated the coin-
cidence of the ratings based on 5% change in VC
between months 3 and 12, and ex amined the us efulness
and significance of the 5% change.
Methods
Overall Study Design
This study was a multicentre, double-blind, randomized,
placebo-controlled trial. The diagnosis of IPF was in
accordance with the ATS/ERS Consensus statement [16]
and 4
th
version of the guidel ine of clinical diagnostic
criteria for idiopathic interstitial pneumonia in Japan
[18]. Eligible patients were adults (20 to 75 years ol d)
with IPF diagnosis based on above criteria and meeting
the following SpO
2
criteria: 1) demonstrate oxygen desa-
turation of > 5% difference between resting SpO
2
and
the lowest SpO
2
during a 6-minute steady-state exercise
test (6MET), and 2) the lowest SpO
2
during the 6MET
> 85% while breathing air. Using the data in our pirfeni-
done phase III trial [12], we performed a series of
explorato ry analyses of physiologic variables and charac-
teristics in patients receiving high-dose pirfenidone
[1800 mg/day], low-dose pirfenidone [1200 mg/day] or
placebo.
Setting, Participants, and Randomization
In this phase III study, 325 patients were screened at 73
centers in Japan, and 275 patients were randomized to
one of the three groups: the high-dose, low-dose and pla-
cebo groups. Of the 275 patients, 267 (108, 55 and 104
patients in the high-dose, low-dose and placebo groups,
respectively) were deemed eligible for the full analysis set
(FAS). Eight patients were excluded due to having no
post-baseline data.
Measurements
The primary endpoint was the change in VC from base-
line to Week 52. Secondary endpoints were PFS time
and the change in the lowest SpO
2
during 6MET. VC
was measured every 4 weeks, while the lowest SpO
2
duringthe6METandotherPFTsweredetermined
every 12 weeks.
Statistical Analysis
In order to examine the characteristics of the improve-
ment ratings and PFS based on 5% change in VC in the
comparison of efficacy among treatment groups, and the
clinical significance of the 5% decline in VC at month 3,
we performed following analyses. Significance level of
tests was set at 0.1 (two-sided) according to t he phase
III study [12].
• Categorical analysis based on 5% change in VC
Improvement ratings were defined based on 5% relative
changes in absolute VC from baseline as “improved (≥ 5%
increase)”, “stable (< 5% change)”,and“w orsened (VC ≥
5% decrease)” , using VC values measured at 12, 28, 40,
and 52 weeks after the start of treatment, and these ratings
were used as those at months 3, 6, 9, and 12, respectively.
Then, the distributions of the improvement ratings were
compared between, high-dose pirfenidone (n = 108) and
placebo (n = 104) groups, and (high- and low-dose) pirfe-
nidone (n = 163) and placebo (n = 104) groups, with
Wilcoxon rank sum test. The risk ratio was also calculated
as the ratio of proportion of “worsened” in pirfenidone
group to the proportion in placebo group at each time
Taniguchi et al. Respiratory Research 2011, 12:93
/>Page 2 of 9
point. The principle of the last observation carried forward
(LOCF) was adopted to impute missing values if patient
data were available for ≥ 4 weeks after the baseline. The
number of patients prematurely dropped and for whom
missing observations were imputed was shown in online
supplemental materials of the preceding reports in details
[12,19].
• Comparison of PFS times based on 5% decline in VC or
death
PFS times by definition of disease progression as death
or ≥ 5%relativedeclineinabsoluteVCwereobtained.
(In our previous paper, we used ≥ 10% instead of ≥ 5%
decline i n VC to define PFS times [12].) Then, the
cumulative PFS rates were estimated with Kaplan-Meier
(K-M) method and the distri butions of PF S times were
compared with log-rank test between high-dose pirfeni-
done and placebo groups, and low-dose pirfenidone and
placebo groups. In ad dition, the disease progression was
defined also by ≥ 5% decline in VC on two consecutive
data points or death and similar analyses of PFS times
thus defined were performed.
• Coincidence of the improvement ratings based on 5%
change in VC at months 3 and 12, in terms of positive and
negative predictive values
In order to examine the coincidence of the improvement
rating s at month 3 and 12, that were derived as sh own in
the subsection “Categorical analysis based on 5% change
in VC”, we calculated positive and negative predictive
values in high- and low-dose pirfenidone and placebo
groups, and compared t he positive and negative predic-
tive values between the 2 (or pirfenidone and placebo)
groups. Then, “worsened” and “non-worsened (stable or
improved)” were considered “positive” and “negative” ,
respectively.
• Comparison of the baseline characteristics between
‘worsened’ and ‘non-worsened’ patients at month 3
To examine the profiles of patients with ≥ 5% and < 5%
decline in VC ("worsened” and “non-worsened” patients)
at month 3, the baseline characteristics (i.e. age, body
mass index (BMI), alveolar-arterial oxygen tension (PaO
2
),
SpO
2
, VC, %VC, total lung capacity (TLC), %TLC, DLCO,
%DLCO, KL-6, surfactant protein (SP)-A, SP-D, and dys-
pnea in daily living assessed with Hugh-Jones (H-J) classi-
fication [20]) between “worsened” and “non-worsened”
patients at month 3 were compared with Welch’s t-test.
• Comparison of the clinical outcome after 1 year between
‘worsened’ and ‘non-worsened’ patients at month 3
The clinical outcome (i.e. H-J classification, death, and
acute exacerbation) after 1 year were compared between
“worsened” and “non-worsened” patients at month 3.
Analysis of the H-J classification was performed with
Welch’s T-test. Analyses of the mortality ratio and inci-
dence of acute exacerbation were with Fisher’s exact
test.
• Comparison of PFS times with origin at month 3 between
‘worsened’ and ‘non-worsened’ patients at month 3
PFS times with origin at month 3 were obtained in a simi-
lar manner as described above. Then, the cumulative PFS
rates were estimated with K-M method and the distribu-
tions of PFS times were compared with log-rank test
between “worsened” and “ non-worsened” patients at
month 3.
Results
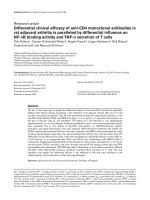
Categorical analysis based on 5% change in VC
Improvement ratings (improved, stable, worsened) based
on 5% relative change in absolute VC at months 3, 6, 9
and 12 are shown in Figures 1-a (for high-dose pirfenidone
and placebo groups) and 1-b (for high- and low-dose pirfe-
nidone and placebo groups). Significant differences in the
distributions of the ratings wer e consistently observed
between high-dose pirfenidone and placebo groups (p =
0.0136, 0.0447, 0.0166, and 0.0053, Risk ratio; 0.578, 0.640,
0.671, and 0.665 at months 3, 6, 9, and 12, respectively)
(Figure 1-a). Significant differences were also seen between
high- and low- dose pirfenidone and placebo groups (p =
0.0064, 0.0381, 0.0091, and 0.0010, Risk ratio; 0.561, 0.652,
0.674, and 0.642 at months 3, 6, 9, and 12, respectively)
(Figure 1-b), and between low-dose pirfenidone and pla-
cebo groups (data not shown). At months 6, 9, and 12,
the risk ratios in (high- and lo w-dose) pirfenidone group
to those in placebo group were approximately 65%., and
the risks to be judged ‘worsened’ were consistently lower
in pirfenidone group by approximately 35%.
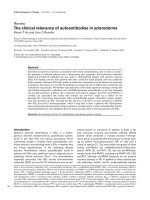
Evaluation using modified progression-free survival based
on 5% decline in VC or death
The modified progression of disease was defined by a
≥ 5% decline in absolute VC from baseline or death.
K-M plots of PFS times based on the definition and the
results of comparison of the distr ibutions of PFS times
among the gro ups with log-rank test are shown in
Figure 2-a. Significant differences were shown in the dis-
tributions of PFS t imes between high-dose and placebo
groups (p = 0.0149), and between low-dose and placebo
groups (p = 0.0034) (Figure 2-a), and b etween (high-
dose and low-dose) pirfenidone and placebo groups (p =
0.0015) (data not shown).
The progression of disease was al so defined by ≥ 5%
decline in VC on two consecutive data points or death,
and K-M plots of the PFS times thus defined and the
results of comparison with log-rank test are shown in
Figure 2-b. Significant differences in the PFS times were
seen between high-dose and placebo groups (p =
0.0011), between low-dose and placebo groups (p =
0.0349) (Figure 2-b), and b etween (high- and low-dose)
pirfenidone and placebo groups (p = 0.0006) (data not
shown).
Taniguchi et al. Respiratory Research 2011, 12:93
/>Page 3 of 9
Positive predictive value, negative predictive value with
the ratings at month 3
Positive and negative predictive values with the ratings
at month 3 in the prediction of those at month 12 in
placebo and pirfendone (high- + low-dose) groups are
shown in Table 1. In the placebo group, a ≥ 5% decline
in VC at month 3 was still present at month 12 at
highly rate (positive predictive value; 86.1% (3 1/36)) and
no decline at month 3 was stable at month 12 at a rate
of about 50% (negative predictive value; 50.8% (34/67)).
On the other hand, in the treated (high- and low-dose
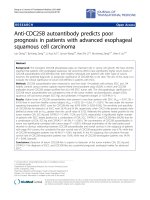
Figure 2 Kaplan-Meier plot of Progression-Free Survival (PFS)
times in groups of IPF patients. a) The disease progression was
defined by a ≥ 5% decline in VC from baseline or death. b) The
disease progression was defined by a ≥ 5% decline in VC from
baseline on two consecutive occasions or death. Solid line: high-
dose; broken line: low-dose; bold broken line: placebo. The
distribution of PFS times were compared with log-rank test.
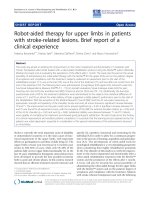
Figure 1 Categorical analysis based on 5% changes i n VC at
months 3, 6, 9, and 12. Improvement ratings based on 5%
changes in VC were defined as “improved (VC 5% increase)”, “stable
(VC < 5% change)”, and “worsened (VC 5% decrease)”, using VC
values measured at months 3, 6, 9, and 12. a) high-dose vs. placebo
groups, b) pirfenidone-treated (high + low-dose) vs. placebo groups.
The results are shown by the frequencies of improved (white areas),
stable (gray areas), and deteriorated (black areas). P-values by
Wilcoxon’s test are indicated at the right.
Table 1 Positive and negative predictive values of the
ratings at month 3 in the prediction of the ratings at
month 12
Placebo group(n = 103)
12M worsened/non-worsened
Worsened Non-worsened
3M worsened/
non-worsened
Worsened 31 (86.1%) 5 (13.9%) 36
Non-worsened 33 (49.2%) 34 (50.8%) 67
64 39 103
Pirfenidone(high + low-dose) group (n = 158)
12M worsened/non-worsened
Worsened Non-worsened
3M worsened/
non-worsened
Worsened 27 (87.1%) 4 (12.9%) 31
Non-worsened 36 (28.4%) 91 (71.7%) 127
63 95 158
Taniguchi et al. Respiratory Research 2011, 12:93
/>Page 4 of 9
pirfenidone) groups, decline at month 3 was still highly
present (positive predictive value; 87.1% (27/31), nearly
equal to one in the placebo group), and no decline at
month 3 was also still stable at month 12 in relatively
highly rate (negative predictive value; 71.7% (91/127)
(Table 1). To put it briefly, the positive predictive values
for pirfenidone and placebo groups were 87.1% and
86.1% respectively, and the difference was not signifi-
cant. On the other hand, the negative predictive values
for pirfenidone and placebo groups were 71.7% and
50.8%, respectively, and significan t difference was seen
(p = 0.0046).
Comparison of the baseline characteristics between
‘worsened’ and ‘non-worsened’ patients at month 3
The baseline characteristics between ‘worsened’ and
‘ non-worsened’ patients at month 3 were compared.
Patients with VC declined by 5% at month 3 generally
had lower means of BMI, PaO
2
, VC, %VC, TLC, %TLC,
and DLCO at baseline (p = 0.0011, 0.0047, 0.0036,
0.0127, 0.0219, 0.0722, 0.0639, respectively), and had
higher means of SP-A, SP-D and H-J classification score
at baseline (p = 0.0281, 0.0344, 0.0765, respectively)
(Table 2).
Comparison of the clinical outcome after 1 year between
‘worsened’ and ‘non-worsened’ patients at month 3
We compared the change in H-J classification score from
baseline to month 1 2 with t-test betwe en 2 classes of
patients, i.e., those with “worsened (VC ≥ 5% decrease)”
and others with “non-worsened (VC < 5% decrease)” at
month 3. As a result, significant difference was seen for
H-J classificat ion score (p = 0.0002) (Table 3). Addi tio n-
ally , mortality rates for the patients with “non-worsened”
and those with “worsened” at month 3 were 2.0% (4/194)
and 9.0% (6/67), respectively, and significant difference
was recognized ( p = 0.0203). Marginal trend was also
seen in the prevalence of acute exacerbation between the
2 classes of patients (p = 0.1031) (Table 4).
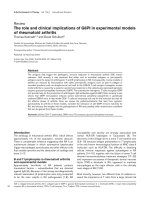
Comparison of PFS times with origin at month 3 between
‘worsened’ and ‘non-worsened’ patients at month 3
K-M plot of the PFS times with origin at month 3 for
patients with and without 5% de cline of VC at month 3,
added the result of log-rank test, is shown in Figure 3.
There was no significant difference in the distributions of
PFS times between the 2 classes of patients (p = 0.8835).
Discussion
We report that the efficacy of pirfenidone in Japanese
phase III trial was supported by the evaluation using the
improvement ratings, PFS times and positive/negative
predictive values based on 5% decline in VC. Further,
the baseline characteristics of patients with ≥ 5% decline
at month 3 were generally severe, and the clinical out-
comes of t hose patients including mortality were also
significantly worsened after 1 year.
According to a preceding report [12], comparison of
the distributions of the improvement ratings (improved,
stable, or worsened) based on 10% change in VC did not
show significant differences between pirfenid one and pla-
cebo groups. The comparison of the ratings using 5%
change in VC, however, revealed significant differences
between pirfenidone and placebo groups at months 3, 6,
9 and 12 (Figure 1), and approximately 35% reduction in
risk in this malignant disease would support the use of
pirfenidone in clinical practice. Thus, when the 5%
change in VC was used as an index, efficacy of the drug
was evaluated with higher sensitivity than when the 10%
change in VC was used . The 5% change in VC may seem
onl y a slig ht change, but the ann ual decline in VC in the
placebo group is said to be approximately 150 to 200 mL
in many recent clinical trials [12,21-25 ]. In the phase III
trial of pirfe nidone, the annual dec line in VC in the pla-
cebo group was 160 mL on average [12], and the mean
baseline VC in the placebo group was 2472.3 mL, from
which the annual rate of decline is calculated to be
approximately 6.5%. That is, if a ≥ 10% change in VC is
used as an index for evaluation over a period of a year, it
may not be sensitive enough to detect efficacy of the
drug, especially for changes within a shorter period of
time such as 3 months and 6 months. Results of this sub
analysis revealed that using a 5% change as an index
improved the chances of detecting efficacy of the drug.
Our results are considerably similar to those of extended
analysis of t he IFIGENIA study investigat ing the effect of
N-acetylcysteine (NAC) in IPF, which also showed signif-
icance of a 5% threshold [26]. However, it should be
noted that use of a smaller change as an index may
require more accurate VC measurements.
According to the preceding report, the progression of
disease was defined by the ≥ 10% decline in VC or
death for evaluation of progression-free survival [12].
Results showed that the p-value of the difference
between groups high-dose and placebo was 0.0280 and
between groups low-dose and placebo was 0.0655. In
this paper, the progression of disease was defined by the
≥ 5% decline in VC from baseline or death, and K-M
plots were generated using thus defined PFS time. As a
result, there were significant difference between groups
high-dose and placebo and between groups low-dose
and placebo (p = 0.0149 and p = 0.0034, respectively),
(Figure 2-a) which seems to be more evident than those
in the previous analysis by 10% decline [12]. When the
progression of disease was defined by a ≥ 5% decline in
VC from baseline on two successive occasions or death,
the highly significant differences were also observed
(Figure 2-b), which supported the result of Figure 2-a.
Taniguchi et al. Respiratory Research 2011, 12:93
/>Page 5 of 9
Early identification of the response to therapeutic
medication provides a clue in clinical decision making
on treatment policy. We analyzed the positive/negative
predictive values using the improvement ratings of
months 3 and 12 based on 5% decline in VC. From the
results of the differences of negative predictive values
between placebo (50.8%) and pirfenidone (71.7%)
groups, the efficacy of pirfenidone was also demon-
strated (p = 0.0046). Thus, about 70% of patients
assessed as non-progression at month 3 in pirfenidone
group might remain in the state at 1 year. However, the
Table 2 Summary statistics of baseline characteristics for patients with ≥ 5% and < 5% decline in VC at month 3
Characteristics 5% decline in VC at Month 3
No Yes Total* P-value
Age Subjects 194 67 261 0.3623
Mean ± S.D. 65.1 ± 6.5 64.1 ± 7.9 64.9 ± 6.9
BMI Subjects 194 67 261 0.0011
Mean ± S.D. 24.7 ± 2.9 23.3 ± 2.9 24.3 ± 3.0
PaO
2
Subjects 192 67 259 0.0047
Mean ± S.D. 81.5 ± 9.6 78.1 ± 7.9 80.6 ± 9.3
SpO
2
Subjects 193 67 260 0.1114
Mean ± S.D. 89.1 ± 2.2 88.6 ± 2.2 89.0 ± 2.2
VC Subjects 194 67 261 0.0036
Mean ± S.D. 2.51 ± 0.67 2.24 ± 0.63 2.44 ± 0.67
%VC Subjects 194 67 261 0.0127
Mean ± S.D. 79.4 ± 17.2 73.3 ± 17.1 77.8 ± 17.3
TLC Subjects 193 67 260 0.0219
Mean ± S.D. 3.76 ± 0.92 3.43 ± 1.01 3.68 ± 0.95
%TLC Subjects 193 67 260 0.0722
Mean ± S.D. 75.0 ± 15.1 70.6 ± 17.8 73.9 ± 15.9
DLCO Subject 193 67 260 0.0639
Mean ± S.D. 9.82 ± 3.23 9.00 ± 3.07 9.61 ± 3.20
%DLCO Subjects 193 67 260 0.1768
Mean ± S.D. 54.4 ± 17.8 51.0 ± 18.0 53.6 ± 17.9
KL-6 Subjects 194 67 261 0.4436
Mean ± S.D. 1308.2 ± 771.0 1401.9 ± 889.2 1332.2 ± 802.3
SP-A Subjects 194 67 261 0.0281
Mean ± S.D. 88.0 ± 43.0 108.3 ± 69.7 93.2 ± 51.8
SP-D Subjects 194 67 261 0.0344
Mean ± S.D. 223.1 ± 130.5 282.1 ± 210.9 238.2 ± 156.8
H-J
classification
Subjects 194 67 261 0.0765
Mean ± S.D. 2.0 ± 0.7 2.2 ± 0.7 2.1 ± 0.7
* Patients for whom the changes in VC at month 3 couldn’t be calculated were deleted from the analysis. The differences in the number of subjects among the
variables at column ‘Total’ were due to missing values at baseline.
TLC, total lung capaci ty; PaO
2
, arterial oxygen tension; SpO
2
, oxygen saturation by pulse oximetry; DLCO, diffusing capacity for carbon monoxide; SP-A (or D),
Surfactant protein-A (or D); BMI, Body Mass Index.
Table 3 Outcome of patients; Change from baseline to
month 12 in H-J classification for patients with ≥ 5% and
< 5% decline in VC
5% decline in VC at month 3
No Yes Total* P-value
Subjects 194 67 261
Mean ± S.D. 0.1 ± 0.7 0.6 ± 0.9 0.2 ± 0.8 0.0002
Table 4 Outcome after month 12; Mortality ratio and
incidence of acute exacerbation in patients with ≥ 5%
and < 5% decline in VC
5% decline in VC at Month
3
No Yes Total* P-value
Subjects 194 67 261*
Mortality (%) 4 (2.04) 6 (8.96) 10 0.0203
Acute exacerbation (%) 7 (3.61) 6 (8.96) 13 0.1031
* Patients for whom the changes in VC at month 3 couldn’t be calculated
were deleted from the analysis.
Taniguchi et al. Respiratory Research 2011, 12:93
/>Page 6 of 9
results of the positive predictive values of placebo and
pirfenidone groups showed that both values were very
high, i.e., 86.1% and 87.1%, respectively. These results
showed that the progression detected at month 3
remained (not reversed) at month 12 in most cases.
Theseanalysessuggestedthepossibilityofidentifying
whether patients respond to pirfenidone or not at early
phase after intervention, and of motivating patients to
continue medication.
On the other hand, it will be a crucial question whether
treatment should be withdrawn in patien ts who decline
by ≥ 5% in VC at mont h 3. Patients with VC declined by
5% at month 3 generally had lower means of PaO2, VC,
%VC, TLC, %TLC, and DLCO at baseline, and had higher
means of SP-A, SP-D and dyspnea in daily living assessed
with H-J classification score at baseline (Table 2). It was
suggested that those patients with impairment of these
baseline characteristics may lead to be corresponded to
relatively “rapid progressors” in IPF, and treatment of any
additional therapy would be recommended as soon as
allowed. The effect of additional therapy strategies, such
as combination with NAC [22] or BIBF-1120 [27], should
be addressed in further clinical trials.
In order to translate the 5% decline in VC into a clini-
cal relevant outcome, we compared the clinical out-
comes (dyspnea in daily living assessed with H-J
classification, mortality rate, and incidence of acute
exacerbation) between 2 classes of patients, i.e., those
with “worsened (VC ≥ 5% decrease)” and others with
“non-worsened (VC < 5% decrease)” at month 3 (Table
3, 4). In short, dyspnea in daily living and mortality rate
of patients with worsened at month 3 were significantly
worsened after 1 year. Similar trend was also seen in the
prevalence of acute exacerbation between the 2 classes
of patients, which marginally supported the significance
of the 5% change in VC. We speculated that the patients
with 5% decline in VC at month 3 have further progres-
sion more easily; however, PFS times with origin at
month 3 were not different between patients with or
without5%declineinVCatmonth3(Figure3).
Namely, it is noted that declines in VC at month 3 do
not mean the possibility of further progression in next 9
months, i.e., month 3 to 12. In summary, except for the
results of PFS times, it was suggested that a 5% d ecline
in VC at month 3 is a clinically meaningful indicator in
IPF and may be a useful prognostic factor. As the
potential limitation, it should be addressed that these
analytical results were obtained by the small number of
subjects with death or prevalence of acute exacerbation
within a one year study period.
Conclusion
Results shown in this paper suggested that when 5%
change in VC was used as an index instead of the 10%
change, the efficacy of pirfenidone could be evaluated with
higher sensitivity and robustness over the 12 month study.
It was also shown by the results that the 5% change in VC
at month 3 is suggested to be a clinically useful and signifi-
cant promising prognostic factor of IPF.
Abbreviations used in this paper
IPF: idiopathic pulmonary fibrosis; VC: vital capacity;
FVC: forced vital capacity; TLC: total lung capacity;
PaO
2
: alveolar-arterial oxygen tension; PFS: progression-
free survival; SpO
2
: oxygen saturation by pulse oximetry;
DLCO: diffusing capacity for carbon monoxide; FAS:
full analysis set; PFT: pulmonary function test; 6MET:
6-minute steady-st ate exercise test; SP-A (or D): Surfac-
tant protein-A (or D); K-M: Kaplan-Meier; BMI: Body
Mass Index; H-J: Hugh-Jones; ATS: American Thoracic
Society; ERS: European Respiratory Society.
Acknowledgements
The authors would like to thank M. Ando (Omotesando Yoshida Hospital,
Kumamoto, Japan), S. Kitamura (Minami-Tochigi Hospital, Oyama, Tochigi,
Japan), Y. Nakai (Tanpopo Clinic, Sendai, Miyagi, Japan), and A. Kondo (Niigata
Tetsudo Kenshin Center, Niigata, Japan) of the independent Data and Safety
Monitoring Board; K. Murata (Shiga University of Medical Science Hospital,
Ohtsu, Shiga, Japan), M. Takahashi (Shiga University of Medical Science Hospital,
Ohtsu, Shiga, Japan), H. Hayashi (Japanese Red Cross Okayama Hospital,
Okayama, Japan), S. Noma (Tenri Hospital, Tenri, Japan), T. Johkoh (Osaka
University Hospital, Osaka, Japan), H. Arakawa (Dokkyo Medical University
Hospital, Shimotsuga, Tochigi, Japan) and K Ichikado (Kumamoto University
Hospital, Kumamoto, Japan) of the Imaging Central Judging Panel. The authors
are also grateful to E. Tsuboi (Toranomon Hospital, Minato, Tokyo, Japan) for his
expert advice on 6-minute steady-state exercise test. Also, the authors thank M.
Igarashi, Y. Tsuchiya, S. Kakutani, Y. Yoshida, H. Oku, and S. Yomori (all Shionogi
& Co. Ltd, Osaka, Japan) for their advice and for reviewing the manuscript.
This work was supported by a grant-in-aid for and by members of interstitial
lung diseases from the Japanese Ministry of Health, Labor and Welfare, also
by members of the Japanese Respiratory Society’s committee for diffuse
lung diseases, and sponsored by Shionogi & Co., Ltd, Osaka, Japan.
The members of Pirfenidone Clinical Study Group in Japan are as follows.T.
Betsuyaku (Hokkaido University Hospital, Sapporo, Hokkaido), Y. Sugawara
(Kyowakai Obihiro Respiratory Hospital, Obihiro, Hokkaido), S. Fujiuchi
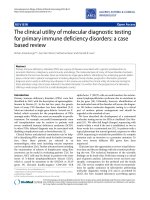
Figure 3 K-M plot of PFS times with origin at month 3 in
groups of patients with and without 5% decline in VC at
month 3. Solid line with closed circle: No decline in VC at month 3;
broken line with plus: a ≥ decline in VC at month 3. P-value was
0.8835 with log-rank test.
Taniguchi et al. Respiratory Research 2011, 12:93
/>Page 7 of 9
(Dohoku National Hospital, Asahikawa, Hokkaido), K. Yamauchi (Iwate
Medical University Hospital, Morioka, Iwate), K. Konishi (Morioka Tsunagi
Onsen Hospital, Morioka), M. Munakata (Fukushima Medical University
Hospital, Fukushima), Y. Kimura (Tohoku University Hospital, Miyagi), Y. Ishii
(Dokkyo Medical University Hospital, Shimotsuga, Tochigi), K. Kudoh
(International Medical Center of Japan, Shinjuku, Tokyo), T. Saito
(Ibarakihigashi National Hospital, Naka, Ibaragi), T. Yamaguchi (JR Tokyo
General Hospital, Shibuya, Tokyo), A. Mizoo (Tokyo Kosei Nenkin Hospital,
Shinjuku), A. Nagai (Tokyo Women’s Medical University Hospital, Shinjuku), A.
Ishizaka, K. Yamaguchi (Keio University Hospital, Shinjuku), K. Yoshimura
(Toranomon Hospital, Minato, Tokyo), M. Oritsu (Japanese Red Cross Medical
Center, Shibuya), Y. Fukuchi, K. Takahashi (Juntendo University Hospital,
Bunkyo, Tokyo), K. Kimura (Toho University Omori Medical Center, Ota,
Tokyo), Y. Yoshizawa (Tokyo Medical and Dental University Hospital, Bunkyo),
T. Nagase (Tokyo University Hospital, Bunkyo), T. Hisada (Tokyo Teishin
Hospital, Chiyoda, Tokyo), K. Ohta (Teikyo University Hospital, Itabashi, Tokyo),
K. Yoshimori (Fukujuji Hospital, Kiyose, Tokyo), Y. Miyazawa, K. Tatsumi (Chiba
University Hospital, Chiba), Y. Sasaki (Chiba-East Hospital, Chiba), M.
Taniguchi (Sagamihara National Hospital, Sagamihara, Kanagawa), Y. Sugita
(Saitama Cardiovascular and Respiratory Center, Kumagaya, Saitama), E.
Suzuki (Niigata University Medical & Dental Hospital, Niigata), Y. Saito (Nishi-
Niigata Chuo National Hospital, Niigata), H. Nakamura (Seirei Hamamatsu
General Hospital, Hamamatsu, Shizuoka), K. Chida (Hamamatsu University
School of Medicine, University Hospital, Hamamatsu), N. Kasamatsu
(Hamamatsu Medical Center, Hamamatsu), H. Hayakawa (Tenryu Hospital,
Hamamatsu), K. Yasuda (Iwata City Hospital, Iwata, Shizuoka), H. Suganuma
(Shimada Municipal Hospital, Shimada, Shizuoka) , H. Genma (Fukuroi
Municipal Hospital, Fukuroi, Shizuoka), R. Tamura (Fujieda Municipal General
Hospital, Fujieda, Shizuoka), T. Shirai (Fujinomiya City General Hospital,
Fujinomiya, Shizuoka), J. Shindoh (Ogaki Municipal Hospital, Ogaki, Gifu), S.
Sato (Nagoya City University Hospital, Nagoya, Aichi), O. Taguchi (Mie
University Hospital, Tsu, Mie), Y. Sasaki (Kyoto Medical Center, Fushimi,
Kyoto), H. Ibata (Mie Chuo Medical Center, Tsu), M. Yasui (Kanazawa
University Hospital, Kanazawa, Ishikawa), Y. Nakano (Shiga Medical University
Hospital, Otsu, Shiga), M. Ito, S. Kitada (Toneyama National Hospital,
Toyonaka, Osaka), H. Kimura (Nara Medical University Hospital, Kashihara,
Nara), Y. Inoue (Kinki-Chuo Chest Medical Center, Sakai, Osaka), H. Yasuba
(Takatsuki Red Cross Hospital, Takatsuki, Osaka), Y. Mochi zuki (Himeji Medical
Center, Himeji, Hyogo), S. Horikawa, Y. Suzuki (Japanese Red Cross
Wakayama Medical Center, Wakayama), N. Katakami (Institute of Biomedical
Research and Innovation, Kobe, Hyogo), Y. Tanimoto (Okayama University
Hospital, Okayama), Y. Hitsuda, N. Burioka (Tottori University Hospital,
Yonago, Tottori), T. Sato (Okayama Medical Center, Okayama), N. Kohno, A.
Yokoyama (Hiroshima University Hospital, Hiroshima), Y. Nishioka (Tokushima
University Hospital, Tokushima), N. Ueda (Ehime Prefectural Central Hospital,
Matsuyama, Ehime), K. Kuwano (Kyushu University Hospital, Fukuoka), K.
Watanabe (Fukuoka University Hospital, Fukuoka) , H. Aizawa (Kurume
University Hospital, Kurume, Fukuoka), S. Kohno, H. Mukae (Nagasaki
University Hospital of Medicine and Dentistry, Nagasaki), H. Kohrogi
(Kumamoto University Hospital, Kumamoto), J. Kadota, I. Tokimatsu, E.
Miyazaki (Oita University Hospital, Yufu, Oita), T. Sasaki (Miyazaki University
Hospital, Miyazaki), M. Kawabata (Minami Kyushu National Hospital, Aira,
Kagoshima).
Author details
1
Dept of Respiratory Medicine and Allergy, Tosei General Hospital, Seto,
Aichi, Japan.
2
Dept of Respiratory Medicine, Tohoku University Graduate
School of Medicine, sendai, Japan.
3
Dept of Internal Medicine, Nippon
Medical School, Tokyo, Japan.
4
Dept of Respiratory Medicine, Kanagawa
Cardiovascular and Respiratory Center, Yokohama, Japan.
5
Dept of
Respiratory Medicine, Tenri Hospital, Tenri, Japan.
6
Dept of respiratory
medicine, Saiseikai Kumamoto Hospital, Kumamoto, Japan.
7
Third Dept of
Internal Medicine, Sapporo Medical University Hospital, Sapporo, Japan.
8
Dept of respiratory Medicine, Nakata Clinic, Tokyo, Japan.
9
Dept of
respiratory Medicine, Kyoto Preventive Medical Center, Kyoto, Japan.
10
Dept
of Medicine, Division of Pulmonary Medicine, Jichi Medical University,
Tochigi, Japan.
Authors’ contributions
HT and YK contributed equally to this extended analysis and should be
considered co-first authors. All authors listed made significant conceptual
and intellectual contributions to the design and conception of this phase III
trial, substantially contributed to the article, and have provided final approval
of the version submitted.
Competing interests
HT, ME, AA, YT, MS, HT, KN, AS, SK, and TN have received consultancy fees
for advisary board, and HT, YK, ME, TO, AA, YS, and TN have received fees for
speaking from Shionogi & Co., Ltd.
Received: 3 February 2011 Accepted: 15 July 2011
Published: 15 July 2011
References
1. King TE Jr, Albera C, Bradford WZ, Costabel U, Hormel P, Lancaster L,
Noble PW, Sahn SA, Szwarcberg J, Thomeer M, Valeyre D, du Bois RM,
INSPIRE Study Group: Effect of interferon gamma-1b on survival in
patients with idiopathic pulmonary fibrosis (INSPIRE.: A multicentre,
randomized, placebo-controlled trial. Lancet 2009, 374:222-228.
2. du Bois RM: Strategies for treating idiopathic pulmonary fibrosis. Nat Rev
Drug Discov 2010, 9:129-140.
3. Raghu G, Johnson WC, Lockhart D, Mageto Y: Treatment of idiopathic
pulmonary fibrosis with a new antifibrotic agent, pirfenidone: results of
a prospective, open-label Phase II study. Am J Respir Crit Care Med 1999,
159:1061-1069.
4. Gahl WA, Brantly M, Troendle J, Avila NA, Padua A, Montalvo C, Cardona H,
Calis KA, Gochuico B: Effect of pirfenidone on the pulmonary fibrosis of
Hermansky-Pudlak syndrome. Mol Genet Metab 2002, 76:234-242.
5. Nagai S, Hamada K, Shigematsu M, Taniyama M, Yamauchi S, Izumi T:
Open-label compassionate use one year-treatment with pirfenidone to
patients with chronic pulmonary fibrosis. Intern Med 2002, 41:1118-1123.
6. Azuma A, Nukiwa T, Tsuboi E, Suga M, Abe S, Nakata K, Taguchi Y, Nagai S,
Itoh H, Ohi M, Sato A, Kudoh S, for the members of the Research Group for
Diffuse Lung Diseases in Japan, Raghu G: Double-blind, placebo-controlled
trial of pirfenidone in patients with idiopathic pulmonary fibrosis. Am J
Respir Crit Care Med 2005, 171:1040-1047.
7. Iyer SN, Gurujeyalakshmi G, Giri SN: Effects of pirfenidone on transforming
growth factor-beta gene expression at the transcriptional level in
bleomycin hamster model of lung fibrosis. J Pharmacol Exp Ther 1999,
291:367-373.
8. Gurujeyalakshmi G, Hollinger MA, Giri SN: Pirfenidone inhibits PDGF
isoforms in bleomycin hamster model of lung fibrosis at the
translational level. Am J Physiol 1999, 276:L311-L318.
9. Iyer SN, Gurujeyalakshmi G, Giri SN: Effects of pirfenidone on procollagen
gene expression at the transcriptional level in bleomycin hamster model
of lung fibrosis. J Pharmacol Exp Ther 1999, 289:211-218.
10. Misra HP, Rabideau C: Pirfenidone inhibits NADPH-dependent microsomal
lipid peroxidation and scavenges hydroxyl radicals. Mol Cell Biochem
2000, 204:119-126.
11. Oku H, Shimizu T, Kawabata T, Nagira M, Hikita I, Ueyama A, Matsushima S,
Torii M, Arimura A: Antifibrotic action of pirfenidone and prednisolone:
Different effects on pulmonary cytokines and growth factors in
bleomycin-induced murine pulmonary fibrosis. Eur J Pharmacol 2008,
590:400-408.
12. Taniguchi H, Ebina M, Kondoh Y, Ogura T, Azuma A, Suga M, Taguchi Y,
Takahashi H, Nakata K, Sato A, Takeuchi M, Raghu G, Kudoh S, Nukiwa T,
Pirfenidone Clinical Study Group in Japan: Pirfenidone in Idiopathic
Pulmonary Fibrosis. Eur Respir J 2010, 35:821-829.
13. Latsi PI, du Bois RM, Nicholson AG, Colby TV, Bisirtzoglou D,
Nikolakopoulou A, Veeraraghavan S, Hansel DM, Wells AU: Fibrotic
idiopathic interstitial pneumonia: The prognostic value of longitudinal
functional trends. Am J Respir Crit Care Med 2003,
168:531-537.
14.
Collard HR, King TE Jr, Bartelson BB, Vourlekis JS, Schwarz MI, Brown KK:
Changes in clinical and physiologic variables predict survival in
idiopathic pulmonary fibrosis. Am J Respir Crit Care Med 2003,
168:538-542.
15. Flaherty KR, Mumford JA, Murray S, Kazerooni EA, Gross BH, Colby TV,
Travis WD, Flint A, Toews GB, Lynch III JP, Martinez FJ: Prognostic
implications of physiologic and radiographic changes in idiopathic
interstitial pneumonia. Am J Respir Crit Care Med 2003, 168:543-548.
16. American Thoracic Society: Idiopathic pulmonary fibrosis: diagnosis and
treatment: international consensus statement: American Thoracic Society
Taniguchi et al. Respiratory Research 2011, 12:93
/>Page 8 of 9
(ATS), and the European Respiratory Society (ERS). Am J Respir Crit Care
Med 2000, 161:646-664.
17. Zappala CJ, Latsi PI, Nicholson AG, Colby TV, Cramer D, Renzoni EA,
Hansell DM, du Bois RM, Wells AU: Marginal decline in forced vital
capacity is associated with a poor outcome in idiopathic pulmonary
fibrosis. Eur Respir J 2010, 35:830-835.
18. Clinical diagnostic and treatment guidance for idiopathic interstitial
pneumonias. Japanese Respiratory Society’s Committee formulating diagnosis
and treatment guideline for diffuse lung diseases Tokyo: Nankodo; 2004,
63-65, [in Japanese].
19. Nukiwa T, Ebina M, Takeuchi M: Pirfenidone in idiopathic pulmonary
fibrosis: From the authors. Eur Respir J 2010, 36:696-698.
20. Fletcher CM: The clinical diagnosis of pulmonary emphysema; an
experimental study. Proc Royal Soc Med 1952, 45:577-584.
21. King TE Jr, Safrin S, Starko KM, Brown KK, Noble PW, Raghu G, Schwartz DA:
Analyses of efficacy end points in a controlled trial of interferon-
gamma1b for idiopathic pulmonary fibrosis. Chest 2005, 127:171-177.
22. Demedts M, Behr J, Buhl R, Costabel U, Dekhuijzen R, Jansen HM,
MacNee W, Thomeer M, Wallaert B, Laurent F, Nicholson AG, Verbeken EK,
Verschakelen J, Flower CD, Capron F, Petruzzelli S, De Vuyst P, van den
Bosch JM, Rodriguez-Becerra E, Corvasce G, Lankhorst I, Sardina M,
Montanari M: High-Dose Acetylcysteine in Idiopathic Pulmonary Fibrosis.
N Engl J Med 2005, 353:2229-42.
23. Raghu G, Brown KK, Bradford WZ, Starko K, Noble PW, Schwartz DA, King TE
Jr: A Placebo-Controlled Trial of Interferon Gamma-1b in Patients with
Idiopathic Pulmonary Fibrosis. N Engl J Med 2004, 350:125-33.
24. Raghu G, Brown KK, Costabel U, Cottin V, du Bois RM, Lasky JA, Thomeer M,
Utz JP, Khandker RK, McDermott L, Fatenejad S: Treatment of idiopathic
pulmonary fibrosis with etanercept: An exploratory, placebocontrolled
trial. Am J Respir Crit Care Med 2008, 178:948-955.
25. King TE Jr, Behr J, Brown KK, du Bois RM, Lancaster L, de Andrade JA,
Stähler G, Leconte I, Roux S, Raghu G: BUILD-1: a randomized placebo-
controlled trial of bosentan in idiopathic pulmonary fibrosis. Am J Respir
Crit Care Med 2008, 177:75-81.
26. Behr J, Demedts M, Buhl R, Costabel U, Dekhuijzen RP, Jansen HM,
MacNee W, Thomeer M, Wallaert B, Laurent F, Nicholson AG, Verbeken EK,
Verschakelen J, Flower CD, Petruzzelli S, De Vuyst P, van den Bosch JM,
Rodriguez-Becerra E, Lankhorst I, Sardina M, Boissard G, IFIGENIA study
group: Lung function in idiopathic pulmonary fibrosis - extended
analyses of the IFIGENIA trial. Respir Res 2009, 10:101.
27. Selman M, Pardo A, Richeldi L, Cerri S: Emerging drugs for idiopathic
pulmonary fibrosis. Expert Opin Emerg Drug 2011, 16:341-362.
doi:10.1186/1465-9921-12-93
Cite this article as: Taniguchi et al.: The clinical significance of 5%
change in vital capacity in patients with idiopathic pulmonary fibrosis:
extended analysis of the pirfenidone trial. Respiratory Research 2011
12:93.
Submit your next manuscript to BioMed Central
and take full advantage of:
• Convenient online submission
• Thorough peer review
• No space constraints or color figure charges
• Immediate publication on acceptance
• Inclusion in PubMed, CAS, Scopus and Google Scholar
• Research which is freely available for redistribution
Submit your manuscript at
www.biomedcentral.com/submit
Taniguchi et al. Respiratory Research 2011, 12:93
/>Page 9 of 9