Báo cáo y học: " Change in CD3 positive T-cell expression in psoriatic arthritis synovium correlates with change in DAS28 and magnetic resonance imaging synovitis scores following initiation of biologic therapy-a single centre, open-label study" doc
Bạn đang xem bản rút gọn của tài liệu. Xem và tải ngay bản đầy đủ của tài liệu tại đây (1.12 MB, 10 trang )
RESEARCH ARTICLE Open Access
Change in CD3 positive T-cell expression in
psoriatic arthritis synovium correlates with change
in DAS28 and magnetic resonance imaging
synovitis scores following initiation of biologic
therapy-a single centre, open-label study
Eliza K Pontifex
1*
, Danielle M Gerlag
2
, Martina Gogarty
1
, Marjolein Vinkenoog
2
, Adrian Gibbs
1
, Ilse Burgman
2
,
Ursula Fearon
1
, Barry Bresnihan
1
, Paul Peter Tak
2
, Robin G Gibney
3
, Douglas J Veale
1
, Oliver FitzGerald
1
Abstract
Introduction: With the development of increasing numbers of potential therapeutic agents in inflammatory
disease comes the need for effective biomarkers to help screen for drug efficacy and optimal dosing regimens
early in the clinical trial process. This need has been recognized by the Outcome Measures in Rheumatology
Clinical Trials (OMERACT) group, which has established guidelines for biomarker validation. To seek a candidate
synovial biomarker of treatment response in psoriatic arthritis (PsA), we determined whether changes in
immunohistochemical markers of synovial inflammation correlate with changes in disease activity scores assessi ng
28 joints (ΔDAS28) or magnetic resonance imaging synovitis scores (ΔMRI) in patients with PsA treated with a
biologic agent.
Methods: Twenty-five consecutive patients with PsA underwent arthroscopic synovial biopsies and MRI scans of an
inflamed knee joint at baseline and 12 weeks after starting treatment with either anakinra (first 10 patients) or
etanercept (subsequent 15 patients) in two sequential studies of identical design. DAS28 scores were measured at
both time points. Immunoh istochemical staining for CD3, CD68 and Factor VIII (FVIII) was performed on synovial
samples and scored by digital image analysis (DIA). MRI scans performed at baseline and at 12 weeks were scored
for synovitis semi-quantitatively. The ΔDAS28 of the European League Against Rheumatism good response
definition (>1.2) was chosen to divide patients into responder and non-responder groups. Differences between
groups (Mann Whi tney U test) and correlations between ΔDAS28 with change in immunohistochemical and MRI
synovitis scores (Spearman’s rho test) were calculated.
Results: Paired synovial samples and MRI scans were available for 21 patients (8 anakinra, 13 etanercept) and 23
patients (8 anakinra, 15 etanercept) respectively. Change in CD3 (ΔCD3) and CD68 expression in the synovial
sublining layer (ΔCD68sl) was significantly greater in the disea se responders compared to non-responders following
treatment (P = 0.005 and 0.013 respectively). ΔCD3, but not ΔCD68 or ΔFVIII, correlated with both ΔDAS28 (r = 0.49,
P = 0.025) and ΔMRI (r = 0.58, P = 0.009).
Conclusions: The correlation of ΔCD3 with ΔDAS28 and ΔMRI following biologic treatment in this cohort
contributes to the validation of ΔCD3 as a synovial biomarker of disease response in PsA, and supports the further
evaluation of ΔCD3 for predictive properties of future clinical outcomes.
* Correspondence:
1
Department of Rheumatology, St. Vincents University Hospital, Elm Park,
Dublin 4, Ireland
Full list of author information is available at the end of the article
Pontifex et al. Arthritis Research & Therapy 2011, 13:R7
/>© 2011 Pont ifex et al.; licensee B ioMed Central Ltd. This is an open access article distributed under the terms of the Creative Comm ons
Attribu tion License ( which permits unrestricted use, distribution, and repro duction in
any medium, provided the original work is properly cited.
Introduction
Psoriatic arthritis is a chronic and debilitating inflamma-
tory arthropathy. It accounts for 15% of referrals to early
arthritis clinics, and has considerable morbidity [1]. The
Outcome Measures in Rheumatology Clinical Trials
(OMERACT) PsA working group has identified a hierar-
chy of domains to be included in PsA clinical trials [2],
which includes tissue analysis and magnetic resonance
imaging (MRI) in the outer domain, on the research
agenda. Utilizing these two domains, we have sought a
potential synovial biomarker of treatment response in
PsA. A biomarker is defined as a characteristic that is
objectively measured and evaluated as an indicator of a
normal biologic process, a pathophysiologic process, or a
pharmacological response to therapeutic intervention [3].
It has already been established in rheumat oid arthritis
(RA) that the mean change in DAS28 correlates with
the mean change in synovial sub lining CD68 expression
across several RA patient cohorts receiving different
therapeutic agents [4-7]. Few studies have correlated
clinical composite scores with chang es in Ps A synovial
cell populations however. One of the reasons for this is
that no composite score has yet been validated in PsA,
although such work is currently in progress [8]. DAS28,
a score validated in RA [9], has proven to be a highly
effective tool in previous studies of PsA and biologic
agents [10-12] and is suitable for studies in volving syno-
vial tissue analysis as it focuses on articular involvement.
In the synovial tissue of our patient cohort , we mea-
sured the expression of CD68, a macrophage marker,
given the clinical correlations found in RA; FVIII, an
end othelial cell marker, due to the hypervascularity and
vessel tortuosity evident in inflammed PsA synovium
compared to that of RA [13-16]; and CD3, a T-cell mar-
ker. Importantly, a previously published study which uti-
lizedDAS28foundasignificantcorrelationbetween
ΔDAS28 and ΔCD3 in the synovium of patients with
PsA a fter adalimumab treatment [12]. Should this find-
ing prove reproducible, particularly if different therapeu-
tic agents are used, ΔCD3 may me et the disc rim ination
criterion of the OMERACT biomarker validation filter
[17] and the exploration of ΔCD3 as a predictive bio-
marker of future treatment response in PsA would be
supported. ΔCD3 could be used to determine the poten-
tial efficacy of new therapeutic agents in PsA at an early
stage, as is already happening in RA clinical trials of
novel therapeutic compou nds, where synovia l sublining
ΔCD68 measurements are being observed to reflect clin-
ical response [18,19].
While MRI ha s been used to highlight the importance
of bone marrow oedema and entheseal sites of inflam-
mation in PsA [20,21], to date there have been no stu-
dies comparing histological change with quantified
synovitis by dynamic or static MRI. In this study we
examine the relationship between clinical scores and
both immunohistochemical (IHC) and MRI measures of
synovitis following biologic treatment in PsA to help
identify a potential biomarker of treatment response.
Materials and methods
Study protocol
Twenty-five patients who met the CASPAR classification
criteria for PsA [22] were enrolled in two sequential stu-
dies of identical design. The first 10 consecutive patients
received anakinra, an IL-1 receptor antagonist, 100 mg
by subcutaneous injection (SC) daily, followed by 1 5
consecutive patients who received etanercept, a TNF
receptor a ntagonist, 25 mg twice weekly SC. B oth were
12-week, single centre, open-label studies undertaken at
St. Vincents University Hospital, Dublin. Ethical
approval was obtained by the hospital’s ethics committee
andwritteninformedconsentwasprovidedbyall
patients. At the time of enrolment, each patient had to
have a diagnosis of PsA for at least three months, and at
least three tender and three swollen joints (one of which
was a knee), of a 68-joint assessment,.
Clinical parameters were measured at weeks 0 and 12,
including 28 and 68 tender (TJC) and 28 and 66 swollen
joint counts (SJC), patient pain and disease 0 to 100
mm visual analogue scale (VAS) and the Health Assess-
ment Questionnaire (HAQ). Serum erythrocyte sedi-
mentation rate (ESR) (Test-1, Ali Sax) and C-reactive
protein (CRP) levels (nephelometry) were also measured.
A DAS28 score was calculated at each time point . To
look for changes in cell marker expression and MRI
synovitis scores reflecting change in c linical activity, the
changeinDAS28oftheEULARdefinitionofgood
response (>1.2) [23] was chosen to divide the cohort
into two groups, labelled here as responders (ΔDAS28
>1.2) and non-responders (ΔDAS28 ≤1.2).
To compare the single joint MRI synovitis scores with a
single joint clinical measure, a more detailed clinical
assessment was performed of each patient’ sinvolved
knee. It wa s scored in the manner of the first published
study of PsA and a biologic agent in which pain and swel-
ling were evaluated separately on a scale of 0 to 3, where
0 represents the absence of pain or swelling [24]. The
sum of these is the final score for a given joint, which will
range from 0 to 6. A patient was defined as a knee
responder in this study if there was a reduction in their
involved knee score following treatment at Week 12.
Patients were excluded if they had received a biologic
agent within 12 weeks, cyclosporin or leflunomide within
8 weeks, or methotrexate or sulfasalazine within 4 weeks
of enrolment into the study. Patients taking ≥10 mg of
prednisolone or those who had a prednisolone dose
change within four weeks of study Day 1 were also
excluded, as were those who were pregnant, breastfeeding,
Pontifex et al. Arthritis Research & Therapy 2011, 13:R7
/>Page 2 of 10
had significant liver, renal or haematological abnormalities,
or a history of cancer within five years of the study’s com-
mencement. Prior to receiving etanercept, patients were
screened for latent tuberculosis with a chest X-ray and
Mantoux test.
Arthroscopy
Arthroscopy and synovial biopsy of the involved knee
joint was performed at two time points (weeks 0 a nd
12), with a Storz arthroscope and 1.5 mm grasping for-
ceps. Biopsy samples were obtained from all knee joint
compartments, embedded in TissueTek OCT compound
(Sakura, Alphen aan den Rijn, Netherlands) and stored
in liquid nitrogen. In the majority of cases, six individual
biopsies were included together in one OCT mould for
cutting and analysis. Seven μm t hick sections were cut
using a cryostat, placed on glass slides coated with 2%
3-amino-propyl-triethoxy-silane (Sigma-Aldrich Ireland
Ltd, Dublin, Ireland) and dried o vernight at room tem-
perature. Sections were stored at -80°C until required
for staining.
Immunohistochemistry
A routine thre e-stag e immunoperoxidase labeling tech-
nique was used. Tissue sections were allowed to reach
room temperature, were fi xed in acetone for 10 minutes
and then ai r-dried. The remaining steps were performed
in an autostai ner using reagents from an Envision+ sys-
tem-HRP (AEC) kit (Dako, Glostrup, Denmark). Follow-
ing quenching of endogenous peroxidase activity, the
synovial sections were incubated with mouse monoclo-
nal antibodies against cell specific markers CD3, CD68,
and FVIII (Dako, Glostrup, Denmark) for 30 minutes.
Incubation with a labelled polymer-HRP anti-mouse
antibody followed, and colour was then developed with
amino-ethylcarbazole (AEC). Slides were counterstained
with Mayer’s haematoxylin (BDH Laboratories, Poole,
UK) and mounted.
Digital image analysis
All slides were randomly assigned code numbers for
analysis and only tissue samples with a clearly identifi-
able intimal lining layer were included. All analysis was
undertaken by EKP. Eighteen high power images were
taken per slide for each of the three cell specific markers
stained. In the case of CD68, the intimal lining layer was
highlighted manually per image, such that staining could
be quantified in two areas - the intimal lining (ll) and
synovial sublining (sl) layers. Analysis was performed
using the Qwin analysis system (Leica, Cambridge, UK)
as has been previously described [25,26]. Results are
expressed as the number of positively stained cells/mm
2
of tissue for CD3 and CD68, and by integrated optical
density (IOD)/mm
2
for FVIII. The average value over all
six biopsies per patient per time point was used for
analysis.
MRI
An MRI scan of the same involved knee was p erformed
for each patient the day prior to arthroscopy at weeks 0
and 12, using a 1.5 T Signa Excite HD MRI scanner
(General Electric Healthcare, Chalfont St Giles, Buckin-
ghamshire, UK) and a dedicated eight channel array HD
knee surface coil with p atients lying supine. The exami-
nations performed included intravenous contrast
enhanced (Gadoteric acid, Dotarem, 0.5 mmol/mL,
Guerbet Laboratories, Birmingham,UK);10mlsinall
examinations by slow hand injection) T1-weighted fat
suppress ed pulse sequences in coronal, sagittal and axial
planes. Scanning parameters were as follows: coronal,
TR 640 ms; TE 16; slice thickness 4/1 mm; FOV 18;
NEX 2; matrix 512 × 256; sagittal, TR 500; TE 16; slice
thickness 4/1 mm; FOV 22; NEX 2; matrix 256 × 192
axial, TR 440; TE 11; slice thickness 3/1.5 mm; FOV 16;
NEX 3; matrix 224 × 192.
Once complete , the scans were arranged into pairs of
pre- and post-treatment images for each patient. These
were scored semi-quantitativ ely by one consultant radi-
ologist with a special interest in musculoskeletal radiol-
ogy who was blind to patient identity and scan
chronology. Each knee was divided into four anatomical
regions (medial and lateral parapateller recesses, inter-
condylar notch and suprapa tellar pouch) and a synovitis
score ranging from 0 to 3 was assigned to each region
(0 = normal synovium, 1 = diffuse, even thickening , 2 =
nodular thickening, 3 = gross, nodular thickening) based
on the overall impression of the severity of synovial
abnormality in the three orthogonal scanning planes.
This method has been described and validated for syno-
vitis in knee osteoarthritis by Rhodes et al. [27]. The
regional scores were added for a final synovitis score per
knee ranging from 0 to 12.
Statistical analysis
Data was analysed with SPSS 12.0.1 for Windows (SPSS
Inc, IBM, Chicago, Illinois, USA). Change in clinical
parameters, IHC markers a nd MRI synovitis scores fol-
lowing treatment were evaluated using the Wilcoxon
signed rank test and differences between responder and
non-responder groups were determined with the Mann
Whitney U test. Correlations between ΔDAS28 with
change in IHC and MRI synovitis scores were calculated
using Spearman’s rho test.
Results
Twenty-five p atients completed at least one of the IHC
or MRI components of these studies (19 completed all
components), and were, therefore, included for clinical
Pontifex et al. Arthritis Research & Therapy 2011, 13:R7
/>Page 3 of 10
analysis (10 anakinra, 15 etanercept). Patients were 50%
and 66.6% female, had a mean age (range) of 43.2
(27 to 60) and 48.7 (26 to 64) years and a m ean disease
duration of 9.1 (1 to 42) and 7.5 (1 to 29) years in the
anakinra and etanercept treated c ohorts, respectively.
Four patients had oligoarthritis (≤4 involved joints) at
enrolment (all etanercept treated); the remaining 21
patients had polyarticular disease (mean SJC66 17, SD
9.2, range 6 to 43).
Five of the anakinra patients (50%) and 11 of the eta-
nercept patients (73.3%) were taking a non-steroidal
anti-inflammatory drug (NSAID), 2 and 4 of whom were
also on a stable dose of prednisolone ≤10 mg.
Clinical responses
Changes in clinical parameters following treatment are
showninTable1.Inbothstudies, the DAS28 was
reduced significantly after treatment; the changes were
more pronounced in the etanercept group compared to
the anakinra group. Nineteen of the 25 patients achieved
an improvement in DAS28 of >1.2 and are labelled
responders (5 anakinra and 14 etanercept), and 6
patients did not and are labelled non-responders (5 ana-
kinra, 1 etanercept).
Twenty-three patients had involved knee scores avail-
able. There was a significant difference between the
knee scores of the knee responders (n = 16, 8 anakinra,
8 etanercept) at Week 0 and Week 12 (3 (1 to 6) and 1
(0 to 4) respecti vely, median (range), P = 0.00), and not
between the non-responders (n = 7, 2 anakinra, 5 et a-
nercept), (2 (2 to 3) and 3 (2 to 4) respectively, P = 0.1).
Immunohistochemistry
Synovial biopsies at baseline and 12 weeks were avail-
able for 21 patients (8 anakinra, 13 etanercept).
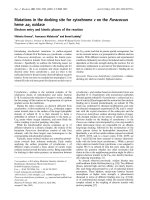
Combining the total patient cohort, there was a signif-
icant reduction in CD3 expression following trea tment
in the responder group (28 (1 to 1,344) at Week 0 to
17.5 (0.5 to 734) at Week 12, P = 0.026, median
(range)), but not in the non-responder group (68 (13 to
265) at Week 0 and 217 (14 to 389) at Week 12, P =
0.080) (Figure 1A). A reduction in expression was not
observed for any of the other cell markers following
treatment in either the responder or non-responder
groups. Of interest, however, there was a significant
increase in CD68sl expres sion in the non-responder
group at W eek 12 (1,835 (1 667 to 2,218)) compared to
Week 0 (1,409 (494 to 1,795)), (P = 0.043).
Thedegreeofchangeincellmarkerexpressionfol-
lowing treatment was significantly greater for ΔCD3 in
the group of responders (19 (-100 to 1,031)) than the
non-responders (-109.3 (-376 to 3)), P = 0.005, (Figure
1C). This was also the case for ΔCD68sl (-53 (-1,336 to
2,178)) among the responders compared to the non-
responders (-382 (-1,247 to -127)), P = 0.013.
Looking at the individual treatment groups separately,
there was a significant reduction in CD3 expression in
the etanercept treated responders at Week 12 (n = 16),
but not CD68sl, CD68ll or FVIII (Figure 1B and Table 2).
In the anakinra treated patients, there was no change
within the re sponder group in CD3 expression, but there
was a non-si gnificant increase in the non-responder
group following treatment.
MRI
Pai red baseline and 12-week scans were available for 23
patients (8 anakinra, 15 etanercept).
There was no change in MRI detected s ynovitis fol-
lowing treatment in the combined cohort of responders
(5 (4 to 12) at Week 0 to 5 (2 to 11) at Week 12, P =
0.1) or non-responders (3.5 (0 to 11) to 4 (1 to 7), P =
0.79). Likewise, there was no difference in the change in
MRI synovitis scores following treatment between the
responder and non-responder group s (0 (-3 to 6) and 1
(-7 to 7) respectively, P = 0.83). Individually, neither eta-
nercept nor anakinra treatment led to a significant
Table 1 Clinical parameters of patients with PsA at baseline and 12 weeks following treatment
Anakinra n = 10 Etanercept n = 15
Week 0 Week 12 P-value Week 0 Week 12 P-value
TJC28 9.5 (3 to 19) 7 (1 to 13) 0.033 11 (1 to 25) 2 (0 to 28) 0.004
TJC68 24.5 (9 to 52) 13.5 (3 to 35) 0.015 15 (3 to 57) 3 (0 to 38) 0.002
SJC28 8 (1 to 18) 5 (0 to 8) 0.032 4 (1 to 21) 1 (0 to 8) 0.005
SJC68 20.5 (6 to 27) 8 (0 to 23) 0.028 9 (3 to 43) 2 (0 to 16) 0.007
ESR 18.5 (3 to 79) 7.5 (2 to 46) 0.059 14 (4 to 91) 5 (1 to 26) 0.001
CRP 17 (4 to 70) 7.5 (0 to 29) 0.044 7 (0 to 42) 0 (0 to 18) 0.092
d VAS 66 (27 to 85) 47 (12 to 70) 0.051 44.5 (5 to 93) 15 (2 to 56) 0.002
p VAS 65.5 (21 to 91) 46.5 (20 to 75) 0.169 50 (22 to 93) 12 (2 to 66) 0.001
HAQ 1.25 (0.75 to 2.38) 1.13 (0.25 to 1.88) 0.057 1.13 (0 to 2.5) 0.25 (0 to 2.25) 0.01
DAS28 5.03 (3.77 to 7.16) 4.17 (2.35 to 5.98) 0.022 5.26 (3.08 to 6.95) 2.01 (0.14 to 5.35) 0.001
Median (range). d VAS, disease visual analogue scale; p VAS, pain visual analogue scale.
Pontifex et al. Arthritis Research & Therapy 2011, 13:R7
/>Page 4 of 10
Figure 1 ΔCD3 of combined responders and non-responders (A), etanercept responders (B). and ΔCD3 of combined responders versus
non-responders (C).
Table 2 Change in cell marker expression following treatment in the responder and non-responder groups
Week 0 Week 12 P-value
CD3 etanercept R n = 12 27.5 (6.5 to 1121) 16 (0.5 to 113) 0.05*
NR n = 1 17 14 n/a
anakinra R n = 4 33.5 (1 to 1344) 32.9 (3 to 734) 0.47
NR n = 4 87.9 (13 to 265) 300 (166 to 389) 0.068
CD68sl etanercept R n = 12 127 (138 to 3,543) 712 (112 to 2,318) 0.31
NR n = 1 1,408 1,667 n/a
anakinra R n = 4 1,370 (362 to 2,685) 1,444 (453 to 2,414) 0.72
NR n = 4 1,431 (494 to 1,795) 1,879 (1,741 to 2,218) 0.068
CD68ll etanercept R n = 12 226 (38 to 513) 213 (17 to 466) 0.48
NR n = 1 191 150 n/a
anakinra R n = 4 174 (129 to 469) 214 (154 to 473) 0.47
NR n = 4 159 (108 to 197) 147 (104 to 319) 0.72
FVlll etanercept R n = 11 132,242 (43,272 to 754,550) 139,294 (51,817 to 439,712) 0.53
NR n = 1 58,525 142,834 n/a
anakinra R n = 4 218,619 (88,372 to 353,725) 280,785 (226,415 to 353,725) 0.27
NR n = 4 286,939 (84,419 to 521,103) 437,447 (184,155 to 545,675) 0.72
MRI etanercept R n = 13 8 (4 to 12) 5 (2 to 11) 0.12
NR n = 1 3 1 n/a
anakinra R n = 5 4 (4 to 12) 4 (4 to 9) 0.66
NR n = 3 4 (0 to 11) 4 (4 to 7) 1
Median (range). n/a, not applicable; NR, non-responder; R, responder.
Pontifex et al. Arthritis Research & Therapy 2011, 13:R7
/>Page 5 of 10
difference in MRI synovitis scores in either the respon-
der or non-responder groups (Table 2).
Looking specifically at the knee responders, there was
a significant differe nce in the MRI synovitis scores of
the knee responders (n = 15) at Week 0 compared to
Week 12 (6 (4 to 12) and 4 (2 to 11), P = 0.049), but
not o f the knee non-responders (n = 5), (4 (0 to 8) and
4 (1 to 7), P = 1.0).
Associations between ΔCD3, ΔDAS28 and ΔMRI
The primary aim of this study was not to compare the
clinical efficacy or specific effects on the synovium of
two different biologic agents, but to seek a candidate
biomarker of disease response. Change in this biomarker
should correlate with change in disease activity and be
irrespective of the type of therapeu tic intervention used.
All patient data were combined , ther efore, to determine
correlations between change in DAS28 with change i n
IHC and MRI synovitis scores, as has been done in pre-
vious similar studies [12,28].
ΔCD3 expression correlated significantly with
ΔDAS28 following treatment (r = 0.49, P =0.025),
(Table 3). No correl ations we re obser ved bet ween
ΔDAS28 or any of its individual components, and
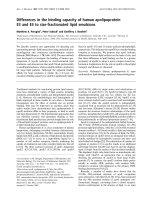
change in expression of the other IHC markers. Figure 2
shows repres entative images of synovial CD3 expression
at baseline and 12 weeks for two patients with differing
clinical responses. Patient 1 (etanercept) achieved a
ΔDAS28 of 1.22 and ΔCD3 of 19, and Patient 2 (ana-
kinra) achieved a ΔDAS28 of 0.16 and ΔCD3 of -118.
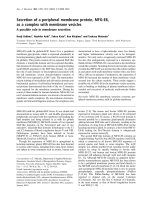
There was a signifi cant correlation between ΔCD3 and
ΔMRI synovitis following treatment (r = 0.58, P = 0.009),
(Table 3). Furthermore, MRI synovitis and CD3 expression
measured at all time points correlated significantly (r =
0.504, P = 0.001), (n = 38). ΔMRI did not correlate with
change in expression of the other IHC markers or with
ΔDAS28 scores (r = -0.027, P =0.91).Figure3shows
representative images of CD3 stained synovium and corre-
sponding MRI scans of a patient who had a ΔDAS28 of
2.54, a ΔCD3 score of 287 and a ΔMRI synovitis score of 4.
Discussion
This study has demonstrated that change in synovial
CD3+ T-cell expression correlates with both ΔDAS28
and ΔMRI synovitis scores in a cohort of patients w ith
PsA treated with either anakinra or etanercept.
Over the last 15 years, some fundamental features of
the spondyloarthropathy (SpA) syn ovium have been elu-
cidated. First, the inflamed synovium of SpA appears to
differ histologically from that of RA [13-16,29]. Second,
the synovial histology of subtypes of SpA, including oli-
goarticular versus polyarticular PsA, have been shown to
be similar [16,29,30]. Third, there are histological
changes in the synovium when patients with SpA
Table 3 Correlation of ΔDAS28 and ΔMRI synovitis scores
with cell marker expression following biologic treatment
ΔCD3 ΔCD68 sl ΔCD68 ll ΔFVIII
ΔDAS28 0.49 (0.025*) 0.27 (0.24) -0.07 (0.77) 0.244 (0.30)
ΔMRI 0.58 (0.009*) 0.22 (0.378) 0.07 (0.78) 0.33 (0.18)
Correlation coefficient (P =). N = 21 for all IHC groups except FVIII (n = 20)
and n = 19 for all MRI groups; ll, lining layer; sl, sublining layer.
Figure 2 Synovial images showing CD3 expression in a DAS28
moderate responder (Patient 1) and non-responder (Patient 2).
A and B are baseline and Week 12 images of Patient 1, and C and
D are baseline and Week 12 images of Patient 2 respectively.
Figure 3 Baseline(A)andWeek12(B)MRIscanswith
corresponding baseline (C) and Week 12 (D) CD3 stained
synovium (red-brown). Thickened enhanced synovium (* in A) has
improved following treatment.
Pontifex et al. Arthritis Research & Therapy 2011, 13:R7
/>Page 6 of 10
respond to effective treatment. Two studies of ant i-TNF
therapy in SpA have shown a significant reduction in
polymorphonuclear (PMN) cells, CD4+ and CD8+ T
cells and macrophage subsets after 12 we eks, plus a
trend toward reduced CD3+ T cell numbers [31,32].
Exclusively in PsA, reduction in T cell and sublining
macrophage infiltration has been observed as early as 48
hours after an infliximab infusion [33] and also follow-
ing treatment with alefacept and methotrexa te [34,35].
Correlations with clinical outcomes were not performed
in these studies. Consi stent with our etanercept respon-
ders, in a cohort of PsA patients treated with adalimu-
mab, a significant reduction in the number of CD3
positive cells was observed after four weeks [12]. The
number of CD68+ cells in the synovial sublining did
decrease in the responders of both latter studies, but
not significantly, while CD68sl expression in this current
study’s non-responders significantly increased. Thus, in
PsA, change in synovial CD3 cell infiltration, and not
CD68, appears to be a superior biomarker of treatment
response. Reduction in angiogenesis has been demon-
strated in P sA patients after infliximab treatment
[36,37], but was not found after etanercept treatment in
the present study, and may be related to the difference
in mechanism of action between the anti-TNF antibo-
dies compared to etanercept [38].
Only two previously published trials of S pA synovium
have measured DAS28 scores. Of 52 SpA patients who
may have received infliximab, etanercept or no biologic
treatment, DAS28 scores were calculated for 28 patients
who h ad polyarticular disease [28]. These scores corre-
lated only with change in CD163 expression, a macro-
phage subset mark er, in the lining layer, and not with
change in CD3 or CD68 expression in the sublining
layer. The patients with PsA were not evaluated as a dis-
tinct group. Only one other trial, which used adalimu-
mab or placebo, has exclusively enrolled PsA patients
and used DAS28 as a primary clinica l outcome measure
[12]. Consistent with our results, that study also demon-
strated a significant correlation between ΔCD3 and
ΔDAS28. Taking these two papers together, four differ-
ent agents have now been used in two PsA cohorts
(anakinra/etanerce pt and adalimumab/placebo) and both
studies have found this proportional relationship
between ΔCD3 and ΔDAS28.
While not conclusive, the findings in this study are also
consist ent with the hypothesis that T-cells play an active
role in PsA pathogenesis. Large numbers of T cells are
present in the PsA synovium, synovial fluid and subchon-
dral bone beneath the entheses [13,29,39], where bone
oedema and erosions can occur. Th1 derived cytokines
dominate in the PsA synovium [35,40] and the CD8+ cell
population contains T cell repertoires which are oligo-
clonally expanded [41]. The association of PsA w ith
human leukocyte antigen (HLA) Class 1 [42], the devel-
opment of Ps and PsA as a manifestation of the Acquired
Immunodeficiency Syndrome (AIDS) and the transmis-
sion of PsA following bone marrow transplantation
[43,44] all suggest T-cells take part in disease expression.
Lastly, the fact that cyclosporin and ustekinumab, which
impair T-cell activation, and alefacept, which specifically
targets activated T cells, are effective in PsA, support
T-cell involvement further [45-47].
The use of MRI in PsA resear ch has been reviewed in
detail [48], and an MRI scoring system for hands in PsA
has recently been developed by the OMERACT imaging
group [49,50]. We opted for our scoring method as it
focuses on knee synovitis and is semi-quantitative. MRI
synovitis has been shown to reduce significantly follow-
ing anti-TNF therapy in PsA [51,52], and we f ound this
to be the case in our combined group of clinical knee
responders. These former studies assessed mostly hand
joints as opposed to exclusively knees and used quanti-
tative analysis. Correlations of MRI findings and histo-
pathology in inflammatory arthritis are emerging in the
literature. Bollow et al. compared dy namic MRI and
sacroiliac joint immunohistochemistry [53] and found
T cells and macrophages to be the most common
inflammatory cells in active SpA sacroiliitis, although
>95% of the tissue obtained was ca rtilage and bone. In
severe AS, MRI-detected bone oedema has correlated
well with histological bone marrow oedema of zygoapo-
physeal joints, but less so with actual inflammatory cell
infiltrates [54]. Other studies correlating MRI findings
with synovial and bone oedema histology have been
undertaken in RA [55,56], but not yet in PsA. This is
the first study, therefore, to demonstrate a relationship
betweenMRIsynovitisandCD3expressioninPsA,
both at all time points in the study and when comparing
the changes with treatment.
No relationship was found in this cohort between
ΔMRI synovitis and ΔDAS28. The fact that this MRI
data reflects change in a single joint only, in contrast to
DAS28, and that improvement in DAS28 may or may
not involve the knee, will contribute to this. The stron-
gest correlation being between ΔCD3 expression and
ΔMRI synovitis scores is not surprising, as these origi-
nate from the same single joint and are objectively mea-
sured, excluding any subjectivity of clinical scoring and
additional pathologies that could influence single joint
clinical scores.
As two patients did not unde rgo follow-up MRI and
three different patients did not have adequate synovial
tissue for analysis, our study is limited by some uncou-
pling of the patient groups included in IHC and MRI
analyses. Also, in three pre-treatment scans (two etaner-
cept, one anakinra), insufficient fat suppression may have
led to an underestimation of the degree of synovitis.
Pontifex et al. Arthritis Research & Therapy 2011, 13:R7
/>Page 7 of 10
Conclusions
This study demonstrates a significant correlation between
synovial ΔCD3 expression and ΔDAS28, and synovial
ΔCD3 expression and ΔMRI synovitis scores in a cohort
of 25 patients with PsA treated with either anakinra or
etanercept. The establishment of ΔCD3 as a candidate
biomarker of treatment response in PsA should prompt
other studies using different therapeutic agents to rein-
force this concept, and also to determine its ability to
predict future clinical outcomes. Further work focusing
on changes in peripheral blood T-cell subsets for a more
easily accessible biomarker could prove useful.
Abbreviations
Δ: change in; AEC: amino-ethylcarbazole; CASPAR: Classification of psoriatic
arthritis; CRP: C-reactive protein; d VAS: disease visual analogue scale; DAS28:
disease activity score assessing 28 joints; DIA: digital image analysis; EULAR:
European League Against Rheumatism; FVIII: Factor VIII; HAQ: health
assessment questionnaire; IHC: immunohistochemistry; IL-1: interleukin 1;
IOD: integrated optical density; ll: synovial lining layer; MRI: magnetic
resonance imaging; n/a: not applicable; NR: non-responder; OMERACT:
outcome measures in rheumatology clinical trials; pVAS: pain visual analogue
scale; PsA: psoriatic arthritis; R: responder; RA: rheumatoid arthritis; SJC:
swollen joint count; sl: synovial sublining layer; SpA: spondyloarthropathy;
TJC: tender joint count; TNF: tumour necrosis factor; VAS: visual analogue
scale.
Acknowledgements
The authors wish to acknowledge the assistance of Drs. Ceara Walsh, Ronan
Mullan and Tom Smeets.
The digital image analysis aspect of this work was supported by the Dutch
Arthritis Association and the European Community’s F6 (Autocure) fu nding.
The investigator originated protocols were supported by Amgen and Wyeth.
Funders had no involvement in the design, production, results or
presentation of this research.
Author details
1
Department of Rheumatology, St. Vincents University Hospital, Elm Park,
Dublin 4, Ireland.
2
Division of Clinical Immunology and Rheumatology F4-
218, Academic Medical Center/University of Amsterdam, PO Box 22700, 1100
DE Amsterdam, The Netherlands.
3
Department of Radiology, St. Vincents
University Hospital, Elm Park, Dublin 4, Ireland.
Authors’ contributions
EKP cut and stored the etanercept slides and performed the initial IHC
staining, performed the digital image analysis, collated all data, performed all
statistical analysis and wrote the manuscript. DMG participated in the
autostainer immunohistochemistry. MG cut and stored all anakinra slides
and performed initial IHC staining. MV made a substantial contribution to
the DIA part of this work and arranged DIA data ready for analysis. AG was
involved in patient recruitment and clinical assessment. IB participated in the
autostainer immunohistochemistry. UF made a substantial contribution to
the statistical analysis. BB made a substantial contribution to the conception
and design of the study. PPT has been involved in the DIA aspect of this
work and revising the manuscript critically for content. RG arranged the MRI
scanning and performed the MRI synovitis scoring. DV made a substantial
contribution to the conception and design of the study and coordinated
the arthroscopies. OF conceived of the study, participated in its design and
coordination and has been involved in the revision of the manuscript
critically for content. All authors have read and approved the final version of
this manuscript.
Competing interests
UF had grant research support from GlaxoSmithKline and is a consultant for
and received grant research support from Wyeth. PPT is a consultant for
Abbott, Amgen, Schering-Plough, and Wyeth. DJV received grant research
support from GlaxoSmithKline, is a consultant for and received grant
research support from Schering-Plough, is a site primary investigator for
Roche, and is a consultant for and received grant research support from
Wyeth. OF received grant research support from Abbott, is a primary
investigator for Bristol Myers Squibb, and received grant research support
from Wyeth.
The other authors declare that they have no competing interests.
Received: 21 September 2010 Revised: 16 December 2010
Accepted: 27 January 2011 Published: 27 January 2011
References
1. Kane D, Stafford L, Bresnihan B, FitzGerald O: A prospective, clinical and
radiological study of early psoriatic arthritis: an early synovitis clinic
experience. Rheumatology (Oxford) 2003, 42:1460-1468.
2. Gladman DD, Mease PJ, Strand V, Healy P, Helliwell PS, Fitzgerald O,
Gottlieb AB, Krueger GG, Nash P, Ritchlin CT, Taylor W, Adebajo A, Braun J,
Cauli A, Carneiro S, Choy E, Dijkmans B, Espinoza L, van der Heijde D,
Husni E, Lubrano E, McGonagle D, Qureshi A, Soriano ER, Zochling J:
Consensus on a core set of domains for psoriatic arthritis. J Rheumatol
2007, 34:1167-1170.
3. De Gruttola VG, Clax P, DeMets DL, Downing GJ, Ellenberg SS, Friedman L,
Gail MH, Prentice R, Wittes J, Zeger SL: Considerations in the evaluation of
surrogate endpoints in clinical trials. summary of a National Institutes of
Health workshop. Control Clin Trials 2001, 22:485-502.
4. Haringman JJ, Gerlag DM, Zwinderman AH, Smeets TJ, Kraan MC, Baeten D,
McInnes IB, Bresnihan B, Tak PP: Synovial tissue macrophages: a sensitive
biomarker for response to treatment in patients with rheumatoid
arthritis. Ann Rheum Dis 2005, 64:834-838.
5. Bresnihan B, Gerlag DM, Rooney T, Smeets TJ, Wijbrandts CA, Boyle D,
Fitzgerald O, Kirkham BW, McInnes IB, Smith M, Ulfgren AK, Veale DJ,
Tak PP: Synovial macrophages as a biomarker of response to therapeutic
intervention in rheumatoid arthritis: standardization and consistency
across centers. J Rheumatol 2007, 34:620-622.
6. Gerlag DM, Haringman JJ, Smeets TJ, Zwinderman AH, Kraan MC, Laud PJ,
Morgan S, Nash AF, Tak PP: Effects of oral prednisolone on biomarkers in
synovial tissue and clinical improvement in rheumatoid arthritis. Arthritis
Rheum 2004, 50:3783-3791.
7. Bresnihan B, Pontifex E, Thurlings RM, Vinkenoog M, El-Gabalawy H,
Fearon U, Fitzgerald O, Gerlag DM, Rooney T, van de Sande MG, Veale D,
Vos K, Tak PP: Synovial tissue sublining CD68 expression is a biomarker
of therapeutic response in rheumatoid arthritis clinical trials: consistency
across centers. J Rheumatol 2009, 36:1800-1802.
8. Gladman DD, Landewe R, McHugh NJ, Fitzgerald O, Thaci D, Coates L,
Mease PJ, Qureshi AA, Krueger GG, Ritchlin CT, Kavanaugh AF, Garg A:
Composite measures in psoriatic arthritis: GRAPPA 2008. J Rheumatol
37:453-461.
9. Prevoo ML, van ‘t Hof MA, Kuper HH, van Leeuwen MA, van de Putte LB,
van Riel PL: Modified disease activity scores that include twenty-eight-
joint counts. Development and validation in a prospective longitudinal
study of patients with rheumatoid arthritis. Arthritis Rheum 1995, 38:44-48.
10. Fransen J, Antoni C, Mease PJ, Uter W, Kavanaugh A, Kalden JR, Van Riel PL:
Performance of response criteria for assessing peripheral arthritis in
patients with psoriatic arthritis: analysis of data from randomised
controlled trials of two tumour necrosis factor inhibitors. Ann Rheum Dis
2006, 65:1373-1378.
11. Vander Cruyssen B, De Keyser F, Kruithof E, Mielants H, Van den Bosch F:
Comparison of different outcome measures for psoriatic arthritis in
patients treated with infliximab or placebo. Ann Rheum Dis 2007,
66:138-140.
12. van Kuijk AW, Gerlag DM, Vos K, Wolbink G, de Groot M, de Rie MA,
Zwinderman AH, Dijkmans BA, Tak PP: A prospective, randomised,
placebo-controlled study to identify biomarkers associated with active
treatment in psoriatic arthritis: Effects of adalimumab treatment on
synovial tissue. Ann Rheum Dis 2009, 68:1303-1309.
13. Veale D, Yanni G, Rogers S, Barnes L, Bresnihan B, Fitzgerald O: Reduced
synovial membrane macrophage numbers, ELAM-1 expression, and
lining layer hyperplasia in psoriatic arthritis as compared with
rheumatoid arthritis. Arthritis Rheum 1993, 36:893-900.
14. Baeten D, Demetter P, Cuvelier C, Van Den Bosch F, Kruithof E, Van
Damme N, Verbruggen G, Mielants H, Veys EM, De Keyser F: Comparative
Pontifex et al. Arthritis Research & Therapy 2011, 13:R7
/>Page 8 of 10
study of the synovial histology in rheumatoid arthritis,
spondyloarthropathy, and osteoarthritis: influence of disease duration
and activity. Ann Rheum Dis 2000, 59:945-953.
15. Danning CL, Illei GG, Hitchon C, Greer MR, Boumpas DT, McInnes IB:
Macrophage-derived cytokine and nuclear factor kappaB p65 expression
in synovial membrane and skin of patients with psoriatic arthritis.
Arthritis Rheum 2000, 43:1244-1256.
16. Kruithof E, Baeten D, De Rycke L, Vandooren B, Foell D, Roth J, C anete JD,
Boots AM, Veys EM, De Keyser F: Synovial histopat hology of ps oriatic
arthritis, both oligo- and polya rticular, resembles spondyloarthropathy
more than it does rheumatoid arthritis. Arthritis Res Ther 2005, 7:
R569-580.
17. Boers M, Brooks P, Strand CV, Tugwell P: The OMERACT filter for Outcome
Measures in Rheumatology. J Rheumatol 1998, 25:198-199.
18. Vergunst CE, Gerlag DM, Dinant H, Schulz L, Vinkenoog M, Smeets TJ,
Sanders ME, Reedquist KA, Tak PP: Blocking the receptor for C5a in
patients with rheumatoid arthritis does not reduce synovial
inflammation. Rheumatology (Oxford) 2007, 46:1773-1778.
19. Vergunst CE, Gerlag DM, Lopatinskaya L, Klareskog L, Smith MD, van den
Bosch F, Dinant HJ, Lee Y, Wyant T, Jacobson EW, Baeten D, Tak PP:
Modulation of CCR2 in rheumatoid arthritis: a double-blind, randomized,
placebo-controlled clinical trial. Arthritis Rheum 2008, 58:1931-1939.
20. McGonagle D, Gibbon W, O’Connor P, Green M, Pease C, Emery P:
Characteristic magnetic resonance imaging entheseal changes of knee
synovitis in spondylarthropathy. Arthritis Rheum 1998, 41:694-700.
21. Tan AL, Benjamin M, Toumi H, Grainger AJ, Tanner SF, Emery P,
McGonagle D: The relationship between the extensor tendon enthesis
and the nail in distal interphalangeal joint disease in psoriatic arthritis–a
high-resolution MRI and histological study. Rheumatology (Oxford) 2007,
46:253-256.
22. Taylor W, Gladman D, Helliwell P, Marchesoni A, Mease P, Mielants H:
Classification criteria for psoriatic arthritis: development of new criteria
from a large international study. Arthritis Rheum 2006, 54:2665-2673.
23. van Gestel AM, Prevoo ML, van ‘t Hof MA, van Rijswijk MH, van de Putte LB,
van Riel PL: Development and validation of the European League
Against Rheumatism response criteria for rheumatoid arthritis.
Comparison with the preliminary American College of Rheumatology
and the World Health Organization/International League Against
Rheumatism Criteria. Arthritis Rheum 1996, 39:34-40.
24. Mease PJ, Goffe BS, Metz J, VanderStoep A, Finck B, Burge DJ: Etanercept in
the treatment of psoriatic arthritis and psoriasis: a randomised trial.
Lancet 2000, 356:385-390.
25. Kraan MC, Smith MD, Weedon H, Ahern MJ, Breedveld FC, Tak PP:
Measurement of cytokine and adhesion molecule expression in synovial
tissue by digital image analysis. Ann Rheum Dis 2001, 60:296-298.
26. Haringman JJ, Vinkenoog M, Gerlag DM, Smeets TJ, Zwinderman AH,
Tak PP: Reliability of computerized image analysis for the evaluation of
serial synovial biopsies in randomized controlled trials in rheumatoid
arthritis. Arthritis Res Ther 2005,
7:R862-867.
27.
Rhodes LA, Grainger AJ, Keenan AM, Thomas C, Emery P, Conaghan PG:
The validation of simple scoring methods for evaluating compartment-
specific synovitis detected by MRI in knee osteoarthritis. Rheumatology
(Oxford) 2005, 44:1569-1573.
28. Kruithof E, De Rycke L, Vandooren B, De Keyser F, FitzGerald O, McInnes I,
Tak PP, Bresnihan B, Veys EM, Baeten D: Identification of synovial
biomarkers of response to experimental treatment in early-phase clinical
trials in spondylarthritis. Arthritis Rheum 2006, 54:1795-1804.
29. van Kuijk AW, Reinders-Blankert P, Smeets TJ, Dijkmans BA, Tak PP: Detailed
analysis of the cell infiltrate and the expression of mediators of synovial
inflammation and joint destruction in the synovium of patients with
psoriatic arthritis: implications for treatment. Ann Rheum Dis 2006,
65:1551-1557.
30. Baeten D, Kruithof E, De Rycke L, Boots AM, Mielants H, Veys EM, De
Keyser F: Infiltration of the synovial membrane with macrophage subsets
and polymorphonuclear cells reflects global disease activity in
spondyloarthropathy. Arthritis Res Ther 2005, 7:R359-369.
31. Kruithof E, Baeten D, Van den Bosch F, Mielants H, Veys EM, De Keyser F:
Histological evidence that infliximab treatment leads to downregulation
of inflammation and tissue remodelling of the synovial membrane in
spondyloarthropathy. Ann Rheum Dis 2005, 64:529-536.
32. Kruithof E, De Rycke L, Roth J, Mielants H, Van den Bosch F, De Keyser F,
Veys EM, Baeten D: Immunomodulatory effects of etanercept on
peripheral joint synovitis in the spondylarthropathies. Arthritis Rheum
2005, 52:3898-3909.
33. Goedkoop AY, Kraan MC, Teunissen MB, Picavet DI, de Rie MA, Bos JD,
Tak PP: Early effects of tumour necrosis factor alpha blockade on skin
and synovial tissue in patients with active psoriasis and psoriatic
arthritis. Ann Rheum Dis 2004, 63:769-773.
34. Kraan MC, van Kuijk AW, Dinant HJ, Goedkoop AY, Smeets TJ, de Rie MA,
Dijkmans BA, Vaishnaw AK, Bos JD, Tak PP: Alefacept treatment in
psoriatic arthritis: reduction of the effector T cell population in
peripheral blood and synovial tissue is associated with improvement of
clinical signs of arthritis. Arthritis Rheum 2002, 46:2776-2784.
35. Kane D, Gogarty M, O’Leary J, Silva I, Bermingham N, Bresnihan B,
Fitzgerald O: Reduction of synovial sublining layer inflammation and
proinflammatory cytokine expression in psoriatic arthritis treated with
methotrexate. Arthritis Rheum 2004, 50:3286-3295.
36. Goedkoop AY, Kraan MC, Picavet DI, de Rie MA, Teunissen MB, Bos JD,
Tak PP: Deactivation of endothelium and reduction in angiogenesis in
psoriatic skin and synovium by low dose infliximab therapy in
combination with stable methotrexate therapy: a prospective single-
centre study. Arthritis Res Ther 2004, 6:R326-334.
37. Canete JD, Pablos JL, Sanmarti R, Mallofre C, Marsal S, Maymo J, Gratacos J,
Mezquita J, Mezquita C, Cid MC: Antiangiogenic effects of anti-tumor
necrosis factor alpha therapy with infliximab in psoriatic arthritis. Arthritis
Rheum 2004, 50:1636-1641.
38. Tracey D, Klareskog L, Sasso EH, Salfeld JG, Tak PP: Tumor necrosis factor
antagonist mechanisms of action: a comprehensive review. Pharmacol
Ther 2008, 117
:244-279.
39.
Costello P, Bresnihan B, O’Farrelly C, FitzGerald O: Predominance of CD8+ T
lymphocytes in psoriatic arthritis. J Rheumatol 1999, 26:1117-1124.
40. Ritchlin C, Haas-Smith SA, Hicks D, Cappuccio J, Osterland CK, Looney RJ:
Patterns of cytokine production in psoriatic synovium. J Rheumatol 1998,
25:1544-1552.
41. Tassiulas I, Duncan SR, Centola M, Theofilopoulos AN, Boumpas DT: Clonal
characteristics of T cell infiltrates in skin and synovium of patients with
psoriatic arthritis. Hum Immunol 1999, 60:479-491.
42. Gladman DD, Anhorn KA, Schachter RK, Mervart H: HLA antigens in
psoriatic arthritis. J Rheumatol 1986, 13:586-592.
43. Daikeler T, Gunaydin I, Einsele H, Kanz L, Kotter I: Transmission of psoriatic
arthritis by allogeneic bone marrow transplantation for chronic
myelogenous leukaemia from an HLA-identical donor. Rheumatology
(Oxford) 1999, 38:89-90.
44. Snowden JA, Heaton DC: Development of psoriasis after syngeneic bone
marrow transplant from psoriatic donor: further evidence for adoptive
autoimmunity. Br J Dermatol 1997, 137:130-132.
45. Spadaro A, Riccieri V, Sili-Scavalli A, Sensi F, Taccari E, Zoppini A:
Comparison of cyclosporin A and methotrexate in the treatment of
psoriatic arthritis: a one-year prospective study. Clin Exp Rheumatol 1995,
13:589-593.
46. Gottlieb A, Menter A, Mendelsohn A, Shen YK, Li S, Guzzo C, Fretzin S,
Kunynetz R, Kavanaugh A: Ustekinumab, a human interleukin 12/23
monoclonal antibody, for psoriatic arthritis: randomised, double-blind,
placebo-controlled, crossover trial. Lancet 2009, 373:633-640.
47. Mease PJ, Gladman DD, Keystone EC: Alefacept in combination with
methotrexate for the treatment of psoriatic arthritis: results of a
randomized, double-blind, placebo-controlled study. Arthritis Rheum 2006,
54:1638-1645.
48. McQueen F, Lassere M, O stergaard M: Magnetic resonance imaging in
psoriatic arthritis: a review of the literature. Arthritis Res Ther 2 006,
8:207.
49. Ostergaard M, McQueen F, Bird P, Peterfy C, Haavardsholm E, Ejbjerg B,
Lassere M, O’Connor P, Emery P, Edmonds J, Genant H, Conaghan PG: The
OMERACT Magnetic Resonance Imaging Inflammatory Arthritis Group -
advances and priorities. J Rheumatol 2007, 34:852-853.
50. Ostergaard M, McQueen F, Wiell C, Bird P, Boyesen P, Ejbjerg B, Peterfy C,
Gandjbakhch F, Duer-Jensen A, Coates L, Haavardsholm EA, Hermann KG,
Lassere M, O’Connor P, Emery P, Genant H, Conaghan PG: The OMERACT
psoriatic arthritis magnetic resonance imaging scoring system
(PsAMRIS): definitions of key pathologies, suggested MRI sequences, and
Pontifex et al. Arthritis Research & Therapy 2011, 13:R7
/>Page 9 of 10
preliminary scoring system for PsA Hands. J Rheumatol 2009,
36:1816-1824.
51. Antoni C, Dechant C, Hanns-Martin Lorenz PD, Wendler J, Ogilvie A,
Lueftl M, Kalden-Nemeth D, Kalden JR, Manger B: Open-label study of
infliximab treatment for psoriatic arthritis: clinical and magnetic
resonance imaging measurements of reduction of inflammation. Arthritis
Rheum 2002, 47:506-512.
52. Marzo-Ortega H, McGonagle D, Rhodes LA, Tan AL, Conaghan PG,
O’Connor P, Tanner SF, Fraser A, Veale D, Emery P: Efficacy of infliximab on
MRI-determined bone oedema in psoriatic arthritis. Ann Rheum Dis 2007,
66:778-781.
53. Bollow M, Fischer T, Reisshauer H, Backhaus M, Sieper J, Hamm B, Braun J:
Quantitative analyses of sacroiliac biopsies in spondyloarthropathies: T
cells and macrophages predominate in early and active sacroiliitis-
cellularity correlates with the degree of enhancement detected by
magnetic resonance imaging. Ann Rheum Dis 2000, 59:135-140.
54. Appel H, Loddenkemper C, Grozdanovic Z, Ebhardt H, Dreimann M,
Hempfing A, Stein H, Metz-Stavenhagen P, Rudwaleit M, Sieper J:
Correlation of histopathological findings and magnetic resonance
imaging in the spine of patients with ankylosing spondylitis. Arthritis Res
Ther 2006, 8:R143.
55. Buch MH, Boyle DL, Rosengren S, Saleem B, Reece RJ, Rhodes LA,
Radjenovic A, English A, Tang H, Vratsanos G, O’Connor P, Firestein GS,
Emery P: Mode of action of abatacept in rheumatoid arthritis patients
having failed TNF blockade: a histological, gene expression and dynamic
MRI pilot study. Ann Rheum Dis 2009, 68:1220-1227.
56. Dalbeth N, Smith T, Gray S, Doyle A, Antill P, Lobo M, Robinson E, King A,
Cornish J, Shalley G, Gao A, McQueen FM: Cellular characterization of
magnetic resonance imaging (MRI) bone edema in rheumatoid arthritis;
implications for pathogenesis of erosive disease. Ann Rheum Dis 2009,
62:279-282.
doi:10.1186/ar3228
Cite this article as: Pontifex et al.: Change in CD3 positive T-cell
expression in psoriatic arthritis synovium correlates with change in
DAS28 and magnetic resonance imaging synovitis scores following
initiation of biologic therapy-a single centre, open-label study. Arthritis
Research & Therapy 2011 13:R7.
Submit your next manuscript to BioMed Central
and take full advantage of:
• Convenient online submission
• Thorough peer review
• No space constraints or color figure charges
• Immediate publication on acceptance
• Inclusion in PubMed, CAS, Scopus and Google Scholar
• Research which is freely available for redistribution
Submit your manuscript at
www.biomedcentral.com/submit
Pontifex et al. Arthritis Research & Therapy 2011, 13:R7
/>Page 10 of 10