Báo cáo y học: "The role of synovial fluid markers of catabolism and anabolism in osteoarthritis, rheumatoid arthritis and asymptomatic organ donors" doc
Bạn đang xem bản rút gọn của tài liệu. Xem và tải ngay bản đầy đủ của tài liệu tại đây (529.85 KB, 10 trang )
RESEARCH ARTICLE Open Access
The role of synovial fluid markers of catabolism
and anabolism in osteoarthritis, rheumatoid
arthritis and asymptomatic organ donors
Rediet Kokebie
1
, Rohit Aggarwal
2
, Sukhwinderjit Lidder
3
, Arnavaz A Hakimiyan
3
, David C Rueger
4
, Joel A Block
1,3
and Susan Chubinskaya
1,3,5*
Abstract
Introduction: The purpose of this study was to correlate the level of anabolic and catabolic biomarkers in synovial
fluid (SF) from patients with rheumatoid arthritis (RA), patients with osteoarthritis (OA) and asymptomatic organ
donors.
Methods: SF was collected from the knees of 45 OA, 22 RA patients and 20 asymptomatic organ donors. Eight
biomarkers were selected and analyzed by using an enzyme-linked immunosorbent assay: interleukin (IL)-1, IL-6, IL-
8 and IL-11; leukemia-inhibitory factor (LIF); cartilage oligomeric protein (COMP); osteoc alcin; and osteogenic
protein 1 (OP-1). Data are expressed as medians (interquartile ranges). The effects of sex and disease activity were
assessed on the basis of the Western Ontario and McM aster Universities index score for patients with OA and on
the basis of white blood cell count, erythrocyte sedimentation rate and C-reactive protein level for patients with
RA.
Results: The mean ages (± SD) of the patients were as follows: 53 ± 9 years for patients with OA, 54 ± 11 years
for patients with RA and 52 ± 7 years for asymptomatic organ donors. No effect of participants’ sex was identified.
In the SF of patients with RA, four of five cytokines were higher than those in the SF of patients with OA and
those of asymptomatic organ donors. The most significant differe nces were found for IL-6 and IL-8, where IL-6
concentration in SF of patients with RA was almost threefold higher than that in patients with OA and fourfold
higher than that in asymptomatic donor controls: 354.7 pg/ml (1,851.6) vs. 119.4 pg/ml (193.2) vs. 86.97 pg/ml
(82.0) (P < 0.05 and P < 0.05, respectively). IL-8 concentrations were higher in SF of patients with RA than that in
patients with OA as well as that in asymptomatic donor controls: 583.6 pg/ml (1,086 .4) vs. 429 pg/ml (87.3) vs. 451
pg/ml (170.1) (P < 0.05 and P < 0.05, respectively). No differences were found for IL-11 in the SF of patients with
RA and that of patients with OA, while a 1.4-fold difference was detected in the SF of patients with OA and that of
asymptomatic donor controls: 296.2 pg/ml (257.2) vs. 211.6 pg/ml (40.8) (P < 0.05). IL-1 concentrations were the
highest in the SF of RA patients (9.26 pg/ml (11.1)); in the SF of asymptomatic donors, it was significantly higher
than that in patients with OA (9.083 pg/ml (1.6) vs. 7.76 pg/ml (2.6); P < 0.05). Conversely, asymptomatic donor
control samples had the highest LIF concentrations: 228.5 pg/ml (131.6) vs. 128.4 pg/ml (222.7) in the SF of
patients with RA vs. 107.5 pg/ml (136.9) in the SF of patients with OA (P < 0.05). OP-1 concentrations were twofold
higher in the SF of patients with RA than those in patients with OA and threefold higher than those in
asymptomatic donor control samples (167.1 ng/ml (194.8) vs. 81.79 ng/ml (116.0) vs. 54.49 ng/ml (29.3),
respectively; P < 0.05). The differences in COMP and osteocalcin were indistinguishable between the groups, as
were the differences between active and inactive OA and RA.
* Correspondence:
1
Section of Rheumatology, Department of Internal Medicine, Rush University
Medical Center, 1653 West Congress Parkway, Chicago, IL 60612, USA
Full list of author information is available at the end of the article
Kokebie et al. Arthritis Research & Therapy 2011, 13:R50
/>© 2011 Kokebie et al.; licensee BioMed Central Ltd. This is an open access article distributed under the terms of t he Creative Commons
Attribution License ( which permits unrestricted use, distribution, and reproduction in
any medium, provided the original work is properly cited.
Conclusions: Activation of selected biomarkers corresponds to the mechanisms that drive each disease. IL-11, LIF
and OP-1 may be viewed as a cluster of biomarkers significant for OA; while profiling of IL-1, IL-6, IL-8, LIF and OP-
1 may be more significant in RA. Larger, better-defined patient cohorts are necessary to develop a biomarker
algorithm for prognostic use.
Introduction
Synovial fluid (SF) biomarker measurement has begun
to provide useful clinical information. It is well under-
stood that SF plays an important role in the lubrication
and nutrition of the articular joint a nd in the metabo-
lism of cartilage and other connective tissues within the
joint. Biomarkers in SF can be categorized as anabolic
or catabolic. Understanding the relationship between
catabolic and anabolic markers and their changes during
the onset of joint d iseases will help to identify the key
biomarkers of diagnostic and/or prognostic value. The
focus of the current study was on proinflammatory
mediators, catabolic cytokines (interleukin (IL)-1, IL-6,
IL-8 and IL-11) and local anabolic markers of cartilage
and bone metabolism (leukemia-inhibitory factor (LIF),
cartilage oligomeric protein (COMP), osteocalcin and
osteogenic protein 1 (OP-1), also called bone morphoge-
netic protein 7 (BMP-7)) that are involved in critical
biological processes, including cell growth and activa-
tion, inflammation, immunity and differentiation. Several
cytokines, such as IL-1, IL-6 and IL-8, have been found
in SF of patients with rheumatoid arthritis (RA). The
best understood is IL-1, which appears to be critical in
the susceptibility to and progression of osteoarthritis
(OA) and which has b een shown to contribute to the
induction of proinflammatory mediators (IL-6 and IL-8),
proteolytic enzymes, nitric oxide, prostaglandins and
other mediators and effectors o f tissue inflammation
and destruction [1-3]. IL-1 concentrations have been
shown to be elevated in animal models of OA [4], while
the efficacy of IL-1 inhibitors has been tested in OA
patients [5]. In addition, a variety of other cytokines
may be important in OA patho physiology. For examp le,
IL-6 has been associated wit h OA independ ent of
patient age or weight [6]. In contrast, the potential of
IL-8 and IL-11 as biomarkers for OA or RA has been
studied less. IL-8 is produced excessively by fibroblasts,
macropha ges and neutrophils in pathol ogical conditions
[6], while I L-11 is one of the anti-inflammatory cyto-
kines. An imbalance between proinflammatory and anti-
inflammatory cytokines may result in the development
of OA [7]. LIF is a glycoprotein that was originally
defined by its ability to induce the terminal differentia-
tion of murine M1 myeloid leukemia cells, resulting in
the inhibition of their growth. LIF plays an important
role in the induction of acute phase protein synthesis, in
the regulation of both bone formation and bone
resorption and in the degradation of proteoglycans. It
has bee n detected at high concentratio ns in SF o f
patients with RA [8]. Another biomarker of interest is
COMP, a member of the thrombo spondin family of
extracellular proteins, which is abundantly expressed in
human cartilage. COMP has been extensively evaluated
as a biomarker of joint tissue turnover in animals and
humans, where its concentration in the SF or serum
appears to reflect OA severity [9,10].
Prior studies have shown that OP-1 has unique ana-
bolic and anticatabolic activity [11]. OP-1 has been
detected in normal human SF as well as in SF of OA
and RA patients [9]. Furthermore, in cartilage, there is a
strong negative correlation between the concentrations
of OP-1 and those of the IL-6 family of chemokines (IL-
8, IL-11 and LIF) [12], findings which influenced the
choice of biomarkers for evaluation in the current study.
We hypothesize that the activation of SF biomarkers
in OA and RA mig ht be de pende nt on t he mechanism
that drives each disease and that OA and RA might be
characterized by a distinct panel of catabolic and ana-
bolic markers of inflammation and cartilage matrix
metabolism. Thus, the objective of our present study
was to identify the concentrations of selected biomar-
kers in SF in samples taken from patients with RA or
OA as well as from asymptomatic organ donors and to
correlate these values with pathogenesis and disease
activity. The novelty of this study is in the use of SF
from asymptomatic human organ donors. The rationale
for using selected markers was based on previous stu-
dies in human cartilage and the correlation analysis
between m arkers of catabolism and anabolism f or each
disease.
Materials and methods
Study design
This study was approved by the institutional review
board for human investigations at Rush University Med-
ical Center. After securing informed consent from the
participants, SF was obtained from 45 OA patients and
22 age-matched RA patients seen in the outpatient
offices of the Rush University Section of Rhe umatology
who were undergoing diagnostic or therapeutic arthro-
centesis as part of their evaluation and therapy. The
patient cohort covered a broad spect rum of age and dis-
ease severity (both RA a nd OA), and a ll participants
from many racial and ethnic backgrounds were
Kokebie et al. Arthritis Research & Therapy 2011, 13:R50
/>Page 2 of 10
recruite d. Specific eligibility criteria are describe d below.
SF samples were also obtained through the Gift of Hope
Organ & Tissue Donor Network (Elmhurst, IL, USA)
within 24 hours of death from 20 asymptomatic organ
donors with no documented history of joint disease.
The c auses of death were cardiopulmonary a rrest (n =
9), myocardial infarction (n = 5), liver f ailure (n =1),
gunshot wound (n = 1), suicide ( n =1),seizure(n =1),
intracranial b leeding (n = 1) and gastrointestinal bleed-
ing (n = 1).
Inclusion criteria for OA and RA participants
Inclusion criteria for recruitment into the study were age
≥21 years for all participants. Patients with RA had to ful-
fill the American College of Rheumatology (ACR) criteria
for the diagnosis of RA [13]. Patients with OA had to ful-
fill the ACR criteria for the diagnosis of OA [14].
Exclusion criteria
Patients with concurrent diagnoses of OA and RA and
those with rheumatological disorders other th an OA or
RA that could influence their joint symptoms or inflam-
mation were excluded to ensure better-defined experi-
mental groups. Patients for whom arthrocentesis was
not possible, or, when i t was performed, did not yield a
sufficient volume of SF were excluded. Patients who
were unable or unwilling to provide informed consent
for the study or for arthrocentesis and patients who
were unable to read or understa nd the questionnaires
were also excluded.
Study protocol
Patients were screened for eligibility and provided their
informed consent as described above. OA participants
were evaluated on the basi s of Western Ontario and
McMaster Universi ties (WOMAC) index score to assess
their symptoms and disease activity. Standard weight-
bearing radiographs of the knees (standing anteroposter-
ior and lateral views) were obtained from OA and RA
patients. Radiographic OA was defined as the presence
of Kellgren-Lawrence (K-L) grade ≥2 [15]. SF obtained
from the arthrocentesis of the symptomatic knee was
immediately transferred to our research laboratory a nd
stored at -80°C. Participants’ medical records, physical
histories and laboratory data were reviewed by the study
physician. Complete blood count, complete meta bolic
profile, C-reactive protein ( CRP) level and erythrocyte
sedimentation rate (ESR) were obtained for each partici-
pant. For RA subjects, rheumatoid factor (RF) was also
obtained.
Biomarker analysis
SF from patients and organ donors was evaluated for IL-
1, IL-6, IL-8, IL-11, LIF, COMP and osteocalcin by
using commercially available enzyme-linked immunosor-
bent assay (ELISA) kits for each biomarker (R&D Sys-
tems, Inc., Minneapolis, MN, USA). The OP-1 assay was
performed by using the ELISA method developed in our
laboratory as previously described [16]. The data are
presented in Figure 1 as median scatterplots, where each
point represents an average of three measurements.
Statistical analysis
All measurements were carried out in triplicate. All data
were entered into a password- protected computer data-
base. A c
2
test or Student’s t-test were performed for
the OA, RA and asymptomatic organ donor groups to
compare baseline demographics as well as clinical and
laboratory data. Kruskal-Wallis and unpaired two tailed
Mann Whitney tests were used to compare the concen-
trations of biomarkers in SF samples between the three
experimentalgroups:OAvs.RAvs.donor.Dataare
presented as median (interquartile range) values. Spear-
man’s correlation coefficient was used to correlate the
concentrations of biomarkers against the appropriate
laboratory parameters (for example, K-L grade,
WOMAC index score, WBC count), and statistical sig-
nificance was determined using the Bonferroni correc-
tion for multiple comparisons. Graphs were generated
in Prism 3.0 software (GraphPad Software, La Jolla, CA,
USA). P ≤ 0.05 was considered statistically significant in
two-tailed tests. More than 80% power was estimated to
detect a 1.5-fold difference in various biomarker concen-
trations for the given sample size.
Results
Demographics of the sample population
SF from 45 patients diagnosed with OA (six males and
thirty- nine females; mean age (± SD), 53 ± 9 years) and
22 RA patients (five males and seventeen females; mean
age (± SD), 54 ± 11 years) were entered into the study.
Twenty asymptomatic organ donors (five males and fif-
teen females; mean age (± SD), 52 ± 7 years) were also
included. This study comprised age-mat ched population
groups, and no sex differences were detected regarding
the level of selected biomarkers within each cohort. The
detailed demographics and baseline characteristics of the
study participants are outlined in Table 1.
SF IL-1 concentrations
The concentrations of IL-1 differed signifi cantly between
the RA and OA groups (9.26 (11.1) pg/ml vs. 7.76 (2.6)
pg/ml; P < 0.05), and between the OA and asymptomatic
organ donor groups (7.76 (2.6) pg/ml vs. 9.08 (1.6) pg/ml;
P < 0.05) (values reported are medians (interquartile
ranges)). The RA and a symptomatic organ donor
groups were not significantly different (P = 0.93). In con-
trast to the IL- 6, IL-8 and IL-11 concentration s, IL-1
Kokebie et al. Arthritis Research & Therapy 2011, 13:R50
/>Page 3 of 10
concentrations were lower in the OA SF samples than in
the asymptomatic donor samples (Figure 1A and Table 2).
SF IL-6 concentrations
SF IL-6 concentrations were significantly higher in RA
patients than in OA patients or asymptomatic organ
donors. In RA SF, IL-6 concentrations (354.7 (1,851.6)
pg/ml) were threefold higher than in the OA samples
(119.4 (193.2) pg/ml; P < 0.05), and they were fourfold
higher than in the asymptomatic organ donor samples
(86.97 (82.0) pg/ml; P < 0.05). Surprisingly, there was no
statistically significant difference in the IL-6 concentra-
tions between the OA and asymptomatic organ donor
groups (Figure 1B and Table 2).
SF IL-8 concentrations
SF concentrations of IL-8 were significantly higher in
RA patients (583.6 (1,086.4) pg/ml) than in OA patients
(429 (87.3) pg/ml; P < 0.05) and in the asymptomatic
organ donor population (451 (170.7) pg/ml; P < 0.05).
As with IL-6, there was no statistically significant differ-
ence in the IL-8 concentrations between the OA and
asymptomatic organ donor samples (Table 2).
SF IL-11 concentrations
No significant differences were found in the concentra-
tions of IL-11 between RA and OA SF samples (217.5
(178) pg/ml vs. 296.2 (257.2) pg/ml; P = 0.239). How-
ever, OA IL-11 concentrations were higher than those
in the asymptomatic organ donor samples (296.2 (257.2)
pg/ml vs. 211.6 (40.8) pg/ml; P < 0.05); (Table 2).
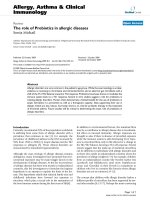
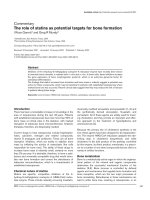
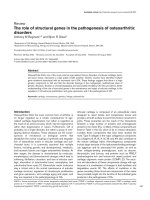
Figure 1 ELISA data for IL-1, IL-6, OP-1, and LIF measured in SF collected from patients with OA or RA and from asymptomatic organ
donors. Quantitative ELISA data for (A) IL-1, (B) IL-6, (C) OP-1 and (D) LIF measured in synovial fluid collected from the patients with RA or OA
or from asymptomatic organ donors. The data are presented as median scatterplots, where each point represents an average of three
measurements.
Table 1 Demographics and baseline characteristics of
patients with OA or RA and of asymptomatic organ
donors
a
Patient
demographics
OA (n =
45)
RA (n = 22) Donors (n =
20)
Mean age, yr (±SD) 53 ± 9 54 ± 11 52 ± 7
Sex, M/F 6/39 5/17 5/15
WOMAC score 95 to
1,828
NA NA
ESR, mm/hour NA 10 elevated, 12
normal
NA
X-ray (K-L grade) 2-4 NA NA
RF, IU NA All positive NA
SF, WBC/μL <2,000 7,000 to 25,000 <2,000
a
OA, osteoarthritis; RA, rheumatoid arthritis; Donors, asymptomatic organ
donor; ESR, erythrocyte sedimentation rate; WOMAC, Western Ontario and
McMaster Universities (WOMAC) index; K-L grade, Kellgren-Lawrence grade;
RF, rheumatoid factor; IU, international units; SF WBC, synovial fluid white
blood cell count; NA, not applicable. The ages of patients and donors are
mean age at study entry ± SD.
Kokebie et al. Arthritis Research & Therapy 2011, 13:R50
/>Page 4 of 10
SF OP-1 concentrations
Concentrations of OP-1 measured in SF in this study were
comparable to those previously described [9]. In the asymp-
tomatic organ donor s amples (54.49 (29.3) ng/ml), the con-
centrations of OP-1 were about threefold lower than those
in the RA samples (167.1 (194.8) ng/ml; P < 0.05) and
almost twofold lower than those in the OA samples (81.79
(116.0) ng/ml; P < 0.05) (Figure 1C). Moreover, as expected,
the RA group had higher SF OP-1 concentrations than the
OA gro up (twofold d ifference; P < 0.05) (Table 2).
SF LIF concentrations
Contrary to other biomarkers measured in this study, the
concentrations of LIF w ere significantly higher in the a symp-
tomatic organ donor g roup ( 228.5 (1 31.6) p g/ml) t han those
detected in the OA group (107.5 (136.9) pg/ml; P < 0.05),
though compared to the RA group, these concentrations
were not significantly different (128.4 (222.7) pg/ml; P =
0.14). There was no significant difference between the RA
andOAgroupsaswell(P =0.199)(Figure1DandTable2).
SF osteocalcin concentrations
Osteocalcin concentrations were comparable in all three
experimental groups: 2.58 (6.6) ng/ml for asymptomatic
organ donor samples, 2.52 (4.9) ng/ml for the OA group
and 1.99 (3.9) ng/ml for the RA group (Table 2).
SF COMP concentrations
As with osteocalcin, concentrations of CO MP were also
indistinguishable between the thr ee experimental
groups: 413.2 (339.9) U/L in the asymptomatic organ
donor group, 490.2 (207.5) U/L in the OA group and
507.3 (352.9) U/L in the RA group (Table 2).
Correlation analysis of the biomarker concentrations
identified in RA samples
Strong positive correlations were seen between IL-6 and
IL-8 (Spearman’s r =0.86,P < 0.001), IL-1 and OP-1
(Spearman’s r = 0.58, P = 0.003) and LIF and osteocal-
cin (Spearman’s r =0.59,P = 0.002) (Table 3). The SF
WBC count positively correlated with IL-6, IL-8 and LIF
(Spearman’s r =0.70,P < 0.001; Spearman’s r =0.57,P
= 0.042; and Spearman’ s r =0.52,P = 0.032, respec-
tively) (Table 3). Only the IL-6 and IL-8 correlations
remained statistically signific ant after applying the Bon-
ferroni correction for multiple comparisons. No signifi-
cant differences were observed in the concentrations of
studied biomarkers between the patients with positive or
negative RF.
Correlation analysis of the biomarker concentrations
identified in OA samples
In contrast to a positive correlation between the IL-6 and
IL-8 concentrations in RA patients (Table 3), in OA sam-
ples (Table 4) IL-6 and IL-8 correlated negatively (Spear-
man’s r = -0.37, P = 0.001). IL-6 also strongly correlated
with IL-11 and LIF (Spearman’s r = 0.54, P < 0.001; and
Spearman’s r =0.72,P < 0.001, respectively) and moder-
ately correlated with osteocalcin (Spearman’s r =0.45,P
= 0.001) (Table 4). There was also a strong negative cor-
relation between the SF LIF concentrations and the IL-1
as well as IL-8 concentrations (IL-1: Spearman’ s r =
-0.52, P = 0.0001; IL-8: Spearman’s r = -0.04, P = 0.004)
(Table 4). In contrast, LIF concentrations positively cor-
related with the concentrations of IL-6, IL-11 and osteo-
calcin (Spearman’s r = 0.72, P < 0.001; Spearman’s r =
0.43, P =0.002;andSpearman’s r =0.50,P = 0.0003,
respectively) (Table 4). IL-1 strongly correlated with IL-8
(Spearman’s r = 0.62, P < 0.001) and showed moderate
negative correlations with IL-6 and osteocalcin (Spear-
man’ s r =-0.33,P = 0.186; and Spearman’ s r = -0.034,
P = 0.02) (Table 4). IL-8 and ost eocalcin showed a mod-
erate negative correlation (Spearman’s r = -0.44, P =
0.001). COMP and OP-1 did not show any correlation
with other biomarkers (Table 4). After the Bonferroni
correction for multiple comparisons was applied, the
Table 2 Synovial fluid concentrations of the biological markers in patients with OA or RA and in asymptomatic organ
donors
a
P values
Marker Donor (n = 20) OA (n = 45) RA (n = 22) OA vs. donor RA vs. donor OA vs. RA
IL-6, pg/mL 86.97 (82.0) 119.4 (193.2) 354.7 (1851.6) 0.4 0.0011 0.0026
IL-8, pg/mL 451 (170.7) 429 (87.3) 583.6 (1086.4) 0.0809 0.016 <0.0001
IL-11, pg/mL 211.6 (40.8) 296.2 (257.2) 217.5 (178) 0.0067 0.4557 0.2393
IL-1, pg/mL 9.08 (1.6) 7.76 (2.6) 9.26 (11.1) 0.02 0.9318 0.0497
OP-1, ng/mL 54.49 (29.3) 81.79 (116.0) 167.1 (194.8) <0.0001 <0.0001 0.0013
LIF, pg/mL 228.5 (131.6) 107.5 (136.9) 128.4 (222.7) 0.0063 0.139 0.1991
Osteo, ng/mL 2.58 (6.6) 2.515 (4.9) 1.99 (3.9) 0.7437 0.893 0.5384
COMP, U/L 413.2 (339.9) 490.2 (207.5) 507.3 (352.9) 0.4652 0.3102 0.3865
a
OA, osteoarthritis; RA, rheumatoid arthritis; IL, interleukin; OP-1, osteogenic protein 1; LI F, leukemia-inhibitory factor; Osteo, osteocalcin; COMP, cartilage oligomeric
protein. Absolute values of biomarkers detected in synovial fluid of patients with osteoarthritis, rheumatoid arthritis and asymptomatic organ donors. P values were
calculated by using an unpaired, two-tailed Mann-Whitney t-test with 95% confidence interval. Values are expressed as medians (interquartile ranges).
Kokebie et al. Arthritis Research & Therapy 2011, 13:R50
/>Page 5 of 10
correlations between IL-6 and IL-1, IL-6 and IL-8, osteo-
calcin and IL-1, osteocalcin and IL-11, and IL-8 and LIF
lost the level of significance. A moderate positive correla-
tion was detected between the SF WBC count and the
IL-1 and IL-6 concentrations (Spearman’s r =0.4,P =
0.03; and S pearman’s r = 0.37, P = 0.005, respectively),
but no correlation was seen after the Bonferroni correc-
tion for multiple comparisons was applied. No correla-
tions were identified betwe en WBC count and IL-8, IL-
11, LIF, OP-1, COMP or osteocalcin. No significant dif-
ferences were detected in tested biomarkers in OA
patients with active or inactive disease as defined by
WOMAC index score, and no correlation was found
between the biomarkers and the grade of radiological
damage defined by the K-L score.
Discussion
The usefulness o f SF and/or serum-soluble biomarkers
in the assessment of treatment efficacy or for monitor-
ing d isease progression in RA and OA remains contro-
versial. The goal of the present study was to
characterize and compare the concentrati ons of selected
biological mediators (both catabolic and anabolic) in the
SF obtained from RA or OA patients in comparison to
SF aspirated from the knee joints of asymptomatic
organ donors and to investigate whether any of these
molecules might have utility as prognostic markers.
Markers of catabolism included IL-1b and the IL-6
fam ily of chemokines (IL-6 , IL-8, IL-11 and LIF), which
have been shown in cartilage to negatively correlate
with OP-1 [12], the anabolic marker evaluated here. In
Table 3 Spearman’s rank correlation coefficients for RA study population
a
IL-1 IL-6 IL-8 IL-11 LIF Osteocalcin COMP OP-1
IL-1 1.0000
IL-6 r = 0.3643
P = 0.0801
1.0000
IL-8 r = 0.5174
P = 0.0096
r = 0.8643
P = 0.001
1.0000
IL-11 r = -0.2278
P = 0.2843
r = -0.1530
P = 0.4753
r = -0.0626
P = 0.7713
1.0000
LIF r = -0.1802
P = 0.3996
r = 0.2733
P = 0.1963
r = 0.3803
P = 0.0667
r = 0.2124
P = 0.3191
1.0000
Osteocalcin r = -0.0670
P = 0.7559
r = 0.1878
P = 0.3795
r = 0.1670
P = 0.4355
r = 0.3783
P = 0.0684
r = 0.5927
P = 0.0023
1.0000
COMP r = 0.3009
P = 0.1531
r = 0.0991
P = 0.6449
r = 0.0548
P = 0.7993
r = -0.2009
P = 0.3466
r = -0.3307
P = 0.1145
r = -0.0548
P = 0.7993
1.0000
OP-1 r = 0.5791
P =
0.0030
r = 0.2896
P = 0.1699
r = 0.4130
P = 0.0448
r = -0.1896
P = 0.3750
r = 0.1897
P = 0.3746
r = 0.1817
P = 0.3954
r = 0.1922
P = 0.3683
1.000
a
RA, rheumatoid arthritis; IL, interleukin; LIF, leukemia-inhibitory factor; COMP, cartilage oligomeric protein; OP-1, osteogenic protein 1. Spearman’srank
correlation coefficients (IL-1, IL-6, IL-8, IL-11, LIF, osteocalcin, COMP and OP-1) for the RA cohort are expressed as Spearman’s r and P values. A total of 22 RA
patients were sampled, five male and seventeen female.
Table 4 Spearman rank correlation coefficients for OA study population
a
IL-1 IL-6 IL-8 IL-11 LIF Osteocalcin COMP OP-1
IL-1 1.0000
IL-6 r = -0.3386
P = 0.186
1.0000
IL-8 r = 0.6233
P = 0.001
r = -0.3709
P = 0.0095
1.0000
IL-11 r = -0.2312
P = 0.1136
r = 0.5384
P = 0.0001
r = -0.2365
P = 0.1056
1.0000
LIF r = -0.5241
P = 0.0001
r = 0.7165
P = 0.001
r = -0.4012
P = 0.0047
r = 0.4352
P = 0.0020
1.0000
Osteocalcin r = -0.3432
P = 0.0169
r = 0.4538
P = 0.0012
r = -0.4456
P = 0.0015
r = 0.3094
P = 0.0324
r = 0.5043
P = 0.0003
1.0000
COMP r = 0.0807
P = 0.5856
r = 0.0294
P = 0.8427
r = -0.1522
P = 0.3018
r = 0.1623
P = 0.2704
r = -0.0854
P = 0.5639
r = 0.1526
P = 0.3004
1.0000
OP-1 r = 0.1038
P =
0.4828
r = 0.0730
P = 0.6222
r = -0.0529
P = 0.7211
r = 0.2028
P = 0.1669
r = 0.1003
P = 0.4975
r = 0.2084
P = 0.1552
r = 0.1193
P = 0.4193
1.000
a
OA, osteoarthritis; IL, interleukin; LIF, leukemia-inhibitory factor; COMP, cartilage oligomeric protein; OP-1, osteogenic protein 1. Spearman’ s rank correlation
coefficients (IL-1, IL-6, IL-8, IL-11, LIF, osteocalcin, COMP and OP-1) for the OA cohort are expressed as Spearman’s r and P values. A total of 45 OA patients were
sampled, six male and thirty-nine female.
Kokebie et al. Arthritis Research & Therapy 2011, 13:R50
/>Page 6 of 10
addition, COMP and osteocalcin were included as mar-
kers of matrix metabolism. Our results suggest that the
concentrations of the pathophysiolo gically important
biomarkers in SF are differen t between OA and RA and
depend on the mechanisms that drive cellular responses
in each disease. IL-11, LIF and OP-1 appear to be signif-
icant for OA processes, while IL-1, IL-6, IL-8 and OP-1
may play an important role in RA.
In line with other studies [17,18], our data also indicate
thatRA,butnotOA,ischaracterizedbyelevatedIL-6
and IL-8 concentr ations. The role of IL-6 in OA is
unclear, and there are conflicting findings in the litera-
ture that indicate both procatabolic [19,20] and antica ta-
bolic effects of IL-6 in chondrocytes and synoviocytes
[21-23]. In contrast, the role of IL-6 in inflammatory pro-
cesses, including RA, appears t o be m ore consistent and
involves promotion of the disease by stimulating B and T
cells [24,25]. Furthermore, the concentrations of IL-6 in
SF were shown to positively correlate with tho se in the
sera of patients with RA, OA, crystal deposition and
other forms of inflammatory arthritis [ 26]. As expected,
IL-6 concentrations in biological fluids of asymptomatic
organ donors were at the baseline concentrations and
were significantly lo wer than those in patients with RA
or OA. S imilar to IL-6, IL-11 concentrati ons have been
found to be significantly higher in SF than in serum,
though the concentrations are highly correlated. In the
present study, IL-11 concentrations were 1.4-fold higher
in OA samples than those in asymp tomatic organ donor
samples, but not higher than those in the RA group.
Trontzas et al. [27] reported that SF IL-11 concentrations
are higher in OA than in treated RA, but not in untreated
RA. As we did not distinguish treated from untreated RA,
we were not able to confirm this relationship. Although
elevated concentrations of IL-11 have been found in RA,
limited data are available on this cytokine [27]. Still, our
results suggest that further studies of the potential utility
of IL-11 as a biomarker are warranted.
LIF, a cytokine in the IL-6 family, is downregulated by
OP-1 and plays a role in bone formation and resorption.
It has not been well-studied as a potential bio marker,
and its associatio n with OA has been based mainly on
gene expression studies in synoviocytes [28]. In the pre-
sent study, LIF concentrations we re significantly lower
in b oth the OA and RA groups compared to the organ
donors. This finding differs from that in a previous
report that detected elevated SF LIF c oncentrations in
some patients with severe RA [29]. This discrepancy
may b e attributed t o an inhibitory effect of other c yto-
kinesonLIF,forexample,IL-4[30].Nonetheless,the
difference in LIF response in OA relative to the other
members of the IL-6 family (IL-8 and IL-11) suggests
that LIF is either involved at different stages of the dis-
eases or has a distinct function.
The cytokine that has received the most attention
among the arthritic diseases is IL-1b, yet as a biomarker,
it has been studied more in either experimental OA [31]
or SF of patients with RA [32]. In OA, it is primarily
viewed as a mediator of degenerative processes in
human joint tissues [33-36], and sub stantial knowledge
has been acc umulated regarding its expression in carti-
lage and synovium, the mechanisms of its activation and
interactions, its signaling, its regulation of and relation-
ship with other active molecules, and so on. IL-1b,
together with IL-6, has been shown in OA synovium to
contribute to the progression of the disease by enhan-
cing the susceptibility of chondrocytes to stimulation
with proanabolic mediators [37]. In posttraumatic OA,
especially in acute phase responses, IL-1b together with
tumor necrosis factor a and IL-6 are well-established
regulators of cartilage degradation and resorption [1].
As anticipated, in the current study, IL-1b and IL-6 con-
centrations were greater in RA patients than in OA
patients or asymptomatic organ donors. However, to
our surprise, the concentrations of IL-1b in SF of
asymptomatic organ donors were statistically higher
than those in OA, suggesting that IL-1b is involved only
during the acute phase of the disease or is needed to
initiate or trigger catabolic events. It is also a possibility
that OA patients enrolled in our study underwent phar-
macological treatment that had an inhibitory effect on
IL-1b production or that only a subpopulation of
patients with OA may have elevated IL-1b.Thelatter
hypothesis is supported by a recent publication by Neu
et al. [38], who reported elevated concentrat ions of IL-
1b in only a few OA samples, while in other samples
IL-1b either was barely detectable or was below the
detection limit. Though in previous p ublications IL-1b
and IL-6 have been shown to be predicti ve of either OA
or RA, our data indicate a closer association of both
cytokines with RA than with OA.
As markers of matrix metabolism, we used COMP
and osteocalcin. COMP is an extracellula r glycoprotein
and is a member of the thrombospondin family of cal-
cium-binding proteins. COMP is associated with carti-
lage breakdown and has been studied as a potential
diagnostic a nd prognostic indicator as well as a marker
of disease severity or the efficacy of treatment (reviewed
in [39]). It has been reported that COMP concentrations
in SF are 10 times higher than in serum and that higher
COMP concentrations have been observed in patients
with higher radiographic Kellgren-Lawrence grades.
However, despite these expectations, here we were not
able to identify an association of COMP concentrations
with the type of disease or its severity, perhaps because
of the limita tions of our study. Samples were collected
at only one time point rather than longitudinally, there
was a lack of untreated controls and/or the sample size
Kokebie et al. Arthritis Research & Therapy 2011, 13:R50
/>Page 7 of 10
of each group was not large enough. As with COMP, we
did not find differences in osteocalcin concentrations
between the experimental groups, though elevation of
osteocalcin has been detected previously in the destruc-
tive form of OA in comparison with nondestr uctive OA
[40]. In agreement with our data, the observations of
Salisbury et al. [41] suggested that in a predominantly
olderfemalepopulation,therateofnormalboneturn-
over measured by osteocalcin in donors was not signifi-
cantly different from that of OA or RA patients.
Furthermore, it has been reported that OA and RA
patients treated with nonsteroidal anti-inflammatory
drugs showed significantly lower concentrations of SF
osteocalcin than patients treated with glucocorticoids
[42]. Conflicting data on both COMP and osteocalcin
indicate that only carefully designed longitudinal studies
with well-controlled, large patient cohorts may shed the
light on their potential as biomarkers.
Previously, we described in detail OP-1/BMP-7 in SF
from organ donors or OA and RA patients [9]. In this
study, it was used primarily for correlation with other
catabolic markers or because there are fewer anabolic
than catabolic biomarkers, where OP-1/BMP-7 definitely
belongs to the former category. As earlier, we confirmed
the elevated concentrations of OP-1/BMP-7 released
into the SF of RA patients in comparison to OA patients
and organ donors. A higher quantity of OP-1/BMP-7 in
samples characterized by higher concentrations of proin-
flammatory mediators may not necessarily indicate a
higher synthesis of this growth factor. Our unpublished
data suggest that treatment with IL-1b, for example,
induce activation of pro-OP-1 and thus release of active
OP-1 from the matrix. In addition, catabolic mediator s
lead to mat rix loosening/degradation, which also may
favor activation and/or release of the growt h factor that
has been trapped within the matrix or bound to the
extracellular binding proteins or matrix co mponen ts as
it occurs with the transforming growth factor b latency
protein [43].
Biomarkers were also assessed on the basis of the
activity of the disease within each patient cohort. OA
was a ssessed on the basis of the WOMAC index score,
and RA was evaluated on the basis of the synovial WBC
count, ESR and CRP level. Though no significant differ-
ences between biomarkers and disease activity were
found, there was a trend toward an elevation of proin-
flammatory mediators in the active state of OA or RA.
Conclusions
In conclusion, the results of this study point to the
mechanism-specific activation of biomarkers, where RA
associated with higher inflammatory components is
characterized by a profile of elevated IL-1, IL-6, IL-8
and OP-1 as well as low concentrations of LIF. On the
basis of our studies, the OA profile of biomarkers could
be described as elevated concentrations of IL-11 and
OP-1 and low concentrations of LIF. To move forward
in the field of biomarkers, the criteria for study design
should be more stringent and should include larger,
well-defined patient cohorts, preferably without any
accompanying therapeutic interventions that obscure
the accuracy of analysis.
Abbreviations
ACR: American College of Rheumatology; BMP-7: bone morphogenetic
protein 7; CBC: complete blood count; CMP: complete metabolic profile;
COMP: cartilage oligomeric protein; CRP: C-reactive protein; ELISA: enzyme-
linked immunosorbent assay. ESR: erythrocyte sedimentation rate; IL:
interleukin; K-L: Kellgren-Lawrence; LIF: leukemia-inhibitory factor; OA:
osteoarthritis; OP-1: osteogenic protein 1; RA: rheumatoid arthritis; RF:
rheumatoid factor; SF: synovial fluid; WBC: white blood cell count; WOMAC:
Western Ontario and McMaster Universities.
Acknowledgements
This work was supported by a Stryker Biotech Research Grant, institutional
funds through Ciba-Geigy Endowed Chair (SC) and Department of Medicine
funds (RK). The authors acknowledge Dr Arkady Margulis for procuring
samples from the organ donors. We also acknowledge the Gift of Hope
Organ & Tissue Donor Network and the donors’ families.
Author details
1
Section of Rheumatology, Department of Internal Medicine, Rush University
Medical Center, 1653 West Congress Parkway, Chicago, IL 60612, USA.
2
Division of Rheumatology, Department of Medicine, University of
Pittsburgh, S700 Biomedical Science Tower, 3500 Terrace Street, Pittsburgh,
PA 15261, USA.
3
Department of Biochemistry, Rush University Medical
Center, 1653 West Congress Parkway, Chicago, IL, 60612 USA.
4
Stryker
Biotech, 35 South Street, Hopkinton, MA 01748, USA.
5
Department of
Orthopedic Surgery, Rush University Medical Center, 1653 West Congress
Parkway, Chicago, IL 60612, USA.
Authors’ contributions
RK, a fellow in the Section of Rheumatology, Department of Internal
Medicine, was responsible for the recruitment of patients, evaluation of their
medical histories, performing arthrocentesis and drafting the manuscript. RA,
a fellow in the Section of Rheumatology, Department of Internal Medicine,
performed the correlation and statistical analyses of the data and was
involved in drafting the manuscript. SL, a postdoctoral fellow in the
Department of Biochemistry, was involved in data acquisition and
organization as well as manuscript preparation. AH, the research assistant/
laboratory manager at the Department of Biochemistry, was responsible for
the handling and preparation of samples and ELISA analysis. DR, a senior
director of research and development at Stryker Biotech, was involved in the
conceptual development of the project as well as its objectives, specific
aims and experimental design. JB, director of the Section of Rheumatology
and the fellowship program, provided mentorship support to the fellows,
was involved in the development of the project and its acquisition as well
as in the preparation of the manuscript. SC, the principal investigator of the
project, developed the study’s conceptual idea, wrote the research proposal,
obtained research funding and institutional review board approval, oversaw
the progress of the study and acquisition of the project-related data,
coordinated the efforts of the study participants, wrote progress reports sent
to the funding agency (Stryker Biotech and Ciba-Geigy Endowed Chair), and
was involved in the final editing of the manuscript.
Competing interests
Stryker Biotech provided research support for studying the biomarkers in the
synovial fluid of patients with RA and OA as well as that of asymptomatic
organ donors.
Received: 16 December 2010 Revised: 9 February 2011
Accepted: 24 March 2011 Published: 24 March 2011
Kokebie et al. Arthritis Research & Therapy 2011, 13:R50
/>Page 8 of 10
References
1. Pelletier JP, Martel-Pelletier J, Abramson SB: Osteoarthritis, an
inflammatory disease: potential implication for the selection of new
therapeutic targets. Arthritis Rheum 2001, 44:1237-1247.
2. Arend WP, Dayer JM: Cytokines and cytokine inhibitors or antagonists in
rheumatoid arthritis. Arthritis Rheum 1990, 33:305-315.
3. Shingu M, Nagai Y, Isayama T, Naono T, Nobunaga M, Nagai Y: The effects
of cytokines on metalloproteinase inhibitors (TIMP) and collagenase
production by human chondrocytes and TIMP production by synovial
cells and endothelial cells. Clin Exp Immunol 1993, 94:145-149.
4. Iqbal I, Fleischmann R: Treatment of osteoarthritis with anakinra. Curr
Rheumatol Rep 2007, 9:31-35.
5. Chevalier X, Goupille P, Beaulieu AD, Burch FX, Bensen WG, Conrozier T,
Loeuille D, Kivitz AJ, Silver D, Appleton BE: Intraarticular injection of
anakinra in osteoarthritis of the knee: a multicenter, randomized,
double-blind, placebo-controlled study. Arthritis Rheum 2009, 61:344-352.
6. Huebner JL, Seifer DR, Kraus VB: A longitudinal analysis of serum
cytokines in the Hartley guinea pig model of osteoarthritis. Osteoarthritis
Cartilage 2007, 15:354-356.
7. Enomoto H, Tomatu T: The levels of leukemia inhibitory factor in synovial
tissue of patients with rheumatoid arthritis: inflammation and other
proinflammatory cytokines. Mod Rheumatol 2003, 13:121-128.
8. Huebner JL, Kraus VB: Assessment of the utility of biomarkers of
osteoarthritis in the guinea pig. Osteoarthritis Cartilage 2006, 14:923-930.
9. Chubinskaya S, Frank BS, Michalska M, Kumar B, Merrihew CA, Thonar EJ,
Lenz ME, Otten L, Rueger DC, Block JA: Osteogenic protein 1 in synovial
fluid from patients with rheumatoid arthritis or osteoarthritis:
relationship with disease and levels of hyaluronan and antigenic keratan
sulfate. Arthritis Res Ther 2006, 8:R73.
10. Kraus VB, Kepler TB, Stabler TV, Renner J, Jordan JM: First qualification
study of serum biomarkers as indicators of total body burden of
osteoarthritis. PLoS ONE 2010, 5:e9739.
11. Chubinskaya S, Hurtig M, Rueger DC: OP-1/BMP-7 in cartilage repair. Int
Orthop 2007, 31:773-781.
12. Chubinskaya S, Otten L, Söeder S, Borgia JA, Aigner T, Rueger DC,
Loeser RF: Regulation of chondrocyte gene expression by osteogenic
protein-1. Arthritis Res Ther 2011, 13:R55.
13. Arnett FC, Edworthy SM, Bloch DA, McShane DJ, Fries JF, Cooper NS,
Healey LA, Kaplan SR, Liang MH, Luthra HS, Medsger TA Jr, Mitchell DM,
Neustadt DH, Pinals RS, Schaller JG, Sharp JT, Wilder RL, Hunder GG: The
American Rheumatism Association 1987 revised criteria for the
classification of rheumatoid arthritis. Arthritis Rheum 1988, 31:315-324.
14. Altman R, Asch E, Bloch D, Bole G, Borenstein D, Brandt K, Christy W,
Cooke TD, Greenwald R, Hochberg M, Howell D, Kaplan D, Koopman W,
Longley S III, Mankin H, McShane DJ, Medsger T Jr, Meenan R, Mikkelsen W,
Moskowitz R, Murphy W, Rothschild B, Segal M, Sokoloff L, Wolfe F:
Development of criteria for the classification and reporting of
osteoarthritis: classification of osteoarthritis of the knee. Arthritis Rheum
1986, 29:1039-1049.
15.
Kellgren JH, Lawrence JS: Radiological assessment of osteo-arthrosis. Ann
Rheum Dis 1957, 16:494-502.
16. Chubinskaya S, Kumar B, Merrihew C, Heretis K, Rueger DC, Kuettner KE:
Age-related changes in cartilage endogenous osteogenic protein-1 (OP-
1). Biochim Biophys Acta 2002, 1588:126-134.
17. Cuellar JM, Scuderi GJ, Cuellar VG, Golish SR, Yeomans DC: Diagnostic
utility of cytokine biomarkers in the evaluation of acute knee pain. J
Bone Joint Surg Am 2009, 91:2313-2320.
18. Manicourt DH, Poilvache P, Van Egeren A, Devogelaer JP, Lenz ME,
Thonar EJ: Synovial fluid levels of tumor necrosis factor α and oncostatin
M correlate with levels of markers of the degradation of crosslinked
collagen and cartilage aggrecan in rheumatoid arthritis but not in
osteoarthritis. Arthritis Rheum 2000, 43:281-288.
19. Legendre F, Dudhia J, Pujol JP, Bogdanowicz P: JAK/STAT but not ERK1/
ERK2 pathway mediates interleukin (IL)-6/soluble IL-6R down-regulation
of type II collagen, aggrecan core, and link protein transcription in
articular chondrocytes: association with a down-regulation of SOX9
expression. J Biol Chem 2003, 278:2903-2912.
20. Rowan AD, Koshy PJ, Shingleton WD, Degnan BA, Heath JK, Vernallis AB,
Spaull JR, Life PF, Hudson K, Cawston TE: Synergistic effects of
glycoprotein 130 binding cytokines in combination with interleukin-1 on
cartilage breakdown. Arthritis Rheum 2001, 44:1620-1632.
21. de Hooge AS, van de Loo FA, Bennink MB, Arntz OJ, de Hooge P, van den
Berg W: Male IL-6 gene knock out mice developed more advanced
osteoarthritis upon aging. Osteoarthritis Cartilage 2005, 13:66-73.
22. Namba A, Aida Y, Suzuki N, Watanabe Y, Kawato T, Motohashi M, Maeno M,
Matsumura H, Matsumoto M: Effects of IL-6 and soluble IL-6 receptor on
the expression of cartilage matrix proteins in human chondrocytes.
Connect Tissue Res 2007, 48:263-270.
23. Lotz M, Guerne PA: Interleukin-6 induces the synthesis of tissue inhibitor
of metalloproteinases-1/erythroid potentiating activity (TIMP-1/EPA).
J Biol Chem 1991, 266:2017-2020.
24. Tosato G, Seamon KB, Goldman ND, Sehgal PB, May LT, Washington GC,
Jones KD, Pike SE: Monocyte-derived human B-cell growth factor
identified as interferon-β2 (BSF-2, IL-6). Science 1988, 239:502-504.
25. Rincón M, Anguita J, Nakamura T, Fikrig E, Flavell RA: Interleukin (IL)-6
directs the differentiation of IL-4-producing CD4
+
T cells. J Exp Med 1997,
185:461-469.
26. Usón J, Balsa A, Pascual-Salcedo D, Cabezas JA, Gonzalez-Tarrio JM, Martín-
Mola E, Fontan GJ: Soluble interleukin 6 (IL-6) receptor and IL-6 levels in
serum and synovial fluid of patients with different arthropathies.
J Rheumatol 1997, 24:2069-2075.
27. Trontzas P, Kamper EF, Potamianou A, Kyriazis NC, Kritikos H, Stavridis J:
Comparative study of serum and synovial fluid interleukin-11 levels in
patients with various arthritides. Clin Biochem 1998, 31:673-679.
28. Wang CT, Lin YT, Chiang BL, Lin YH, Hou SM: High molecular weight
hyaluronic acid down-regulates the gene expression of osteoarthritis-
associated cytokines and enzymes in fibroblast-like synoviocytes from
patients with early osteoarthritis. Osteoarthritis Cartilage 2006,
14:1237-1247.
29. Waring PM, Carroll GJ, Kandiah DA, Buirski G, Metcalf D: Increased levels of
leukemia inhibitory factor in synovial fluid from patients with
rheumatoid arthritis and other inflammatory arthritides. Arthritis Rheum
1993, 36:911-915.
30. Dechanet J, Taupin JL, Chomarat P, Rissoan MC, Moreau JF, Banchereau J,
Miossec P: Interleukin-4 but not interleukin-10 inhibits the production of
leukemia inhibitory factor by rheumatoid synovium and synoviocytes.
Eur J Immunol 1994, 24:3222-3228.
31. Pelletier JP, Caron JP, Evans C, Robbins PD, Georgescu HI, Jovanovic D,
Fernandes JC, Martel-Pelletier J: In vivo suppression of early experimental
osteoarthritis by interleukin-1 receptor antagonist using gene therapy.
Arthritis Rheum 1997, 40:1012-1019.
32. Bendtzen K, Petersen J, Halkjaer-Kristensen J, Ingemann-Hansen T:
Interleukin-1-like activities in synovial fluids of patients with rheumatoid
arthritis and traumatic synovitis. Rheumatol Int 1985, 5:79-82.
33. Attur MG, Dave M, Cipolletta C, Kang P, Goldring MB, Patel IR,
Abramson SB, Amin AR: Reversal of autocrine and paracrine effects of
interleukin 1 (IL-1) in human arthritis by type II IL-1 decoy receptor:
potential for pharmacological intervention. J Biol Chem 2000,
275:40307-40315.
34. Pujol JP, Chadjichristos C, Legendre F, Bauge C, Beauchef G,
Andriamanalijaona R, Galera P, Boumediene K: Interleukin-1 and
transforming growth factor-β1 as crucial factors in osteoarthritic
cartilage metabolism. Connect Tissue Res 2008, 49:293-297.
35. Blom AB, van der Kraan PM, van den Berg WB: Cytokine targeting in
osteoarthritis. Curr Drug Targets 2007, 8:283-292.
36. Jacques C, Gosset M, Berenbaum F, Gabay C: The role of IL-1 and IL-1Ra in
joint inflammation and cartilage degradation. Vitam Horm 2006,
74:371-403.
37. Webb GR, Westacott CI, Elson CJ: Osteoarthritic synovial fluid and
synovium supernatants up-regulate tumor necrosis factor receptors on
human articular chondrocytes. Osteoarthritis Cartilage 1998, 6:167-176.
38. Neu CP, Reddi AH, Komvopoulos K, Schmid TM, Di Cesare PE: Increased
friction coefficient and superficial zone protein expression in patients
with advanced osteoarthritis. Arthritis Rheum 2010, 62:2680-2687.
39. Tseng S, Reddi AH, Di Cesare PE: Cartilage
oligomeric matrix protein
(COMP): a biomarker of arthritis. Biomark Insights 2009, 4:33-44.
40. Campion GV, Delmas PD, Dieppe PA: Serum and synovial fluid osteocalcin
(bone gla protein) levels in joint disease. Br J Rheumatol 1989, 28:393-398.
41. Salisbury C, Sharif M: Relations between synovial fluid and serum
concentrations of osteocalcin and other markers of joint tissue turnover
in the knee joint compared with peripheral blood. Ann Rheum Dis 1997,
56:558-561.
Kokebie et al. Arthritis Research & Therapy 2011, 13:R50
/>Page 9 of 10
42. Franck H, van Valen F, Keck E, Krüskemper HL: Osteocalcin and bone
metabolism in rheumatoid arthritis and osteoarthritis [in German].
Z Rheumatol 1986, 45:241-246.
43. Piek E, Heldin CH, Ten Dijke P: Specificity, diversity, and regulation in TGF-
β superfamily signaling. FASEB J 1999, 13:2105-2124.
doi:10.1186/ar3293
Cite this article as: Kokebie et al.: The role of synovial fluid markers of
catabolism and anabolism in osteoarthritis, rheumatoid arthritis and
asymptomatic organ donors. Arthritis Research & Therapy 2011 13:R50.
Submit your next manuscript to BioMed Central
and take full advantage of:
• Convenient online submission
• Thorough peer review
• No space constraints or color figure charges
• Immediate publication on acceptance
• Inclusion in PubMed, CAS, Scopus and Google Scholar
• Research which is freely available for redistribution
Submit your manuscript at
www.biomedcentral.com/submit
Kokebie et al. Arthritis Research & Therapy 2011, 13:R50
/>Page 10 of 10