Microsoft Excel VBA Programming for the Absolute Beginner Second Edition phần 9 ppsx
Bạn đang xem bản rút gọn của tài liệu. Xem và tải ngay bản đầy đủ của tài liệu tại đây (1.41 MB, 50 trang )
.Axes(xlCategory).MinorTickMark = xlOutside
.Axes(xlValue).MinorTickMark = xlOutside
‘————————————————————————————
‘Use Excel worksheet function to set the maximum scale on
‘the value axis.
‘————————————————————————————
.Axes(xlValue).MaximumScale = Application.WorksheetFunction. _
RoundUp(Application.WorksheetFunction. _
Max(dataRange), -1)
.Axes(xlCategory).HasTitle = True
.Axes(xlCategory).AxisTitle.Characters.Text = “X-axis Labels”
.Axes(xlValue).HasTitle = True
.Axes(xlValue).AxisTitle.Characters.Text = “Y-axis”
.SeriesCollection(1).Name = “Sample Data”
.SeriesCollection(1).Values = dataRange
End With
End Sub
In the AddChartSheet() sub procedure, a specific Axis object is returned from the Axes col-
lection object by passing a defined constant with the
Axes() method. The Axes() method
returns an
Axis object and takes up to two parameters: one for the axis type (xlCategory,
xlSeries, or xlValue), and another for the axis group (xlPrimary or xlSecondary). The axis
type
xlCategory represents the x-axis on the chart, and xlValue represents the y-axis. The axis type
xlSeries applies only to 3D charts and represents the z-axis. The axis group is either xlPrimary
(default) or xlSecondary (applies to charts containing multiple Series objects).
The rest of the objects and properties set via the
Axis object are fairly straightforward and
include setting tick marks and chart labels. The upper limit of the y-axis scale is set using
Excel worksheet functions that return the maximum value from the variable
dataRange
(defined at the beginning of the procedure) rounded up to single-digit precision.
The data is finally added to the chart by setting the
Values property of the Series object
(returned from the
SeriesCollection collection object) with the range variable dataRange.
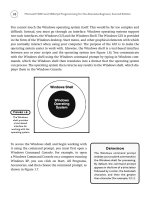
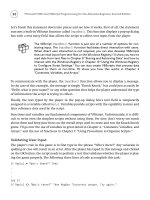
Figure 9.8 shows the components specifically added to the chart by the preceding code. The
chart also contains components created from default properties of the various chart related
objects. For example, the gridlines in the figure are the major gridlines on the y-axis and are
displayed by default. To prevent them from being displayed, I could have added a statement
such as
ActiveChart.Axes(xlValue).MajorGridlines = False.
389
Chapter 9 • Excel Charts
390
Creating an Embedded Chart
To add an embedded chart to a worksheet, use the Add() method of the ChartObects collec-
tion object. The
AddEmbeddedChart() sub procedure creates the same column chart as the
AddChartSheet() sub procedure listed in the previous section; however, it embeds the chart
on an existing worksheet named
Embedded Charts.
Public Sub AddEmbeddedChart()
Dim dataRange As Range
Set dataRange = Range(frmDataRange.txtDataRange.Text)
frmDataRange.Hide
Sheets(“Create Chart”).ChartObjects.Add Left:=200, _
Top:=50, Width:=500, Height:=350
Sheets(“Create Chart”).ChartObjects(1).Activate
With ActiveChart
.ChartType = xlColumnClustered
.SeriesCollection.NewSeries
.HasLegend = True
.Legend.Position = xlRight
.Axes(xlCategory).MinorTickMark = xlOutside
.Axes(xlValue).MinorTickMark = xlOutside
Microsoft Excel VBA Programming for the Absolute Beginner, Second Edition
Figure 9. 8
The column chart
created by the
AddChartSheet()
sub procedure.
MaximumScale
ChartType =
xlColumnClustered
MinorTickMark =
xlOutside
SeriesCollection(1).
Valu es
HasLegend = True
Legend.Position =
xlRight
SeriesCollection(1).
Name=”Sample
Data”
HasTitle = True
AxisTitle.Characters.
Text = “X-axis
Labels”
.Axes(xlValue).MaximumScale = Application.WorksheetFunction.RoundUp( _
Application.WorksheetFunction.Max(dataRange), -1)
.Axes(xlCategory, xlPrimary).HasTitle = True
.Axes(xlCategory, xlPrimary).AxisTitle.Characters.Text = _
“X-axis Labels”
.Axes(xlValue, xlPrimary).HasTitle = True
.Axes(xlValue, xlPrimary).AxisTitle.Characters.Text = “Y-axis”
.SeriesCollection(1).Name = “Sample Data”
.SeriesCollection(1).Values = dataRange
End With
End Sub
When adding an embedded chart, the Add() method of the ChartObjects collection object
accepts four parameters that define the position of the upper-left corner of the chart on the
worksheet, as well as the chart width and height. The position properties of the
Add()
method (Left and Top) are relative to the upper-left corner of cell A1 and are in units of
points. The
Activate method of the ChartObject object is equivalent to selecting the chart
because only one
Chart object is contained in a ChartObject object.
Before setting the properties of the
Chart object, the chart must contain at least one Series
object. Thus, the NewSeries method is used to add an empty Series object to the chart. This
is another difference from adding chart sheets, where a
Series object is automatically added
on creation of the chart sheet. The properties of the
Chart object are then set in the same
manner as was done with the chart sheet.
The preceding examples demonstrate only a small fraction of the objects, properties, and
methods available in a
Chart object. Don’t be intimidated by the breadth of the Chart object
and its components! Always remember that a large problem can be broken into many smaller,
more manageable problems. Once you learn how to access a chart, setting the properties of
any of its component objects is basically the same. The hard part is learning what objects
are available to the specific chart being manipulated. The number of component objects in
a
Chart object varies with the chart type (column, bar, scatter, and so on) and with the sub-
category of chart type (clustered, stacked, 3D, and so on). For example, a 3D column chart
has
Wall, Floor, and Corners objects, but a clustered column chart does not have these objects.
To learn the differences between chart types or to just learn what is available for a specific
chart type, use recorded macros. First, create the chart from the Excel application then alter
its appearance with the macro recorder turned on. Be careful to record only a small number
of actions, say two to three at one time, because the macro recorder adds a lot of unnecessary
code (setting default values). Keep in mind that as you select a component of the chart with
391
Chapter 9 • Excel Charts
392
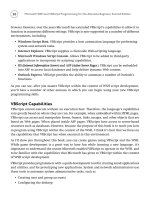
the mouse, you are really selecting a component object of the Chart object. The dialog box
that appears when the component object is double-clicked or selected from the chart menu
sets the properties of that object. For example, the Format Axis dialog box shown in Figure
9.9 appears when the user double-clicks on a chart axis.
Figure 9.9 shows some of the properties of the
Axis object. If the macro recorder is on while
these properties are altered, the VBA code used to set these properties will be recorded when
OK is clicked in the dialog box. After recording a small macro, proceed to the VBA IDE to
examine the recorded code. If any of the code needs clarification, select the unknown key-
word and press F1 to retrieve its documentation from the online help. This is an extremely
helpful tool for learning how to program specific Excel components and the advantage
should be exploited.
Chart Events
The Chart object has several events that are triggered by various user actions. Some of the
events are familiar—like
Activate(), MouseDown(), and MouseUp()— but a few are unique to the
Chart object. Table 9.3 summarizes the less familiar events associated with the Chart object.
Chart object events are not automatically enabled with embedded charts.
Although Chart object events can be enabled for embedded charts, the methods
involved are beyond the scope of this book.
HINT
Microsoft Excel VBA Programming for the Absolute Beginner, Second Edition
Figure 9.9
The Format Axis
dialog box.
Chart Sheets
Chart events are automatically enabled with chart sheets. To catch events triggered by the user
in a chart sheet, add code to an event procedure contained in the module associated with the
chart sheet. The code window can be opened in the same manner as with a worksheet. Figure
9.10 shows the code window of a chart sheet selected from the project explorer. The active
project displayed in Figure 9.10 is an Excel workbook containing several chart sheets.
393
Chapter 9 • Excel Charts
Event Trigger
Calculate When new or changed data is charted
DragOver When a range of cells is dragged over a chart
DragPlot When a range of cells is dragged and dropped on a chart
Resize When the chart is resized
Select When a chart element is selected
SeriesChange When the value of a charted data point changes
TABLE 9.3 CHART O BJECT E VENTS
Figure 9.10
Adding code to an
event procedure
of a chart sheet.
Chart sheet
component module
Chart sheets
394
Unfortunately, some of the events unique to the Chart object cannot be used with a chart
sheet because there is no manner in which the user can trigger them. For example, the user
cannot drag and drop a range of cells over the chart when the data is in another worksheet;
however, the other chart events work as expected, and an example using the
Select() event
procedure of the
Chart object is listed here.
Private Sub Chart_Select(ByVal ElementID As Long, ByVal Arg1 As Long, ByVal Arg2 As Long)
If ElementID = xlSeries And Arg2 > 0 Then
ActiveChart.SeriesCollection(Arg1).Points(Arg2).ApplyDataLabels
Type:=xlShowValue
End If
End Sub
The Select() event procedure of the Chart object accepts three parameters: ElementID is a
long integer that refers to the component object selected by the user (
ChartArea, PlotArea,
Series, and so on), and Arg1 and Arg2 are long integers that refer to specific components of
the selected object; thus, the meaning of
Arg1 and Arg2 depends on the object selected by the
user. The definitions of
Arg1 and Arg2 for some of the more common chart components are
listed in Table 9.4.
The preceding
Select() event procedure is triggered when the user selects a chart component.
If that component is a single data point on the chart then
Arg1 holds the index value of the
selected
Series object (representing a series of values) and Arg2 holds the index value of
the selected
Point object (representing the individual values in the series).
Microsoft Excel VBA Programming for the Absolute Beginner, Second Edition
ElementID Arg1 Arg2
xlAxis, xlAxisTitle, xlDisplayUnitLabel, xlMajorGridlines, xlMinorGridlines Axis Index Axis Type
xlChartArea, xlChartTitle, xlCorners, xlDataTable, xlLegend, xlPlotArea None None
xlDataLabel, xlSeries Series Index Point Index
xlErrorBars, xlLegendEntry, xlLegendKey Series Index None
xlTrendline Series Index TrendLine
Index
xlXErrorBars, xlYErrorBars Series Index None
TABLE 9.4 ARGUMENT D EFINITIONS FOR THE S ELECT()
E
VENT OF THE C HART OBJECT
The purpose of the code entered in the Select() event procedure is to add a label to any
point in a data series selected by the user. To accomplish this, the parameter
ElementID is
tested for equivalence to three (VBA-defined constant
xlSeries, see online help for addi-
tional constants) because that’s the value that represents a
Series object. If the user has
selected a single point in a data series, the selected point is labeled with its value by using
the
ApplyDataLabels() method of the Point object and setting the Type argument to the con-
stant
xlShowValue. In this example, Arg2 holds the value –1 if the entire series is selected and
will not hold a meaningful value until the user selects an individual point from the data
series. When the user does select an individual data point, the value of
Arg2 is passed to the
Points() method, which returns a Point object from the Points collection object. In this
case, the
Points() method returns the specific data point selected by the user.
Consider the chart shown in Figure 9.11 where two data series are plotted in a scatter chart.
The chart is contained in a chart sheet and the
Select() event procedure of the Chart object
contains the previously listed code. If the user selects Series 1 with a single click of the mouse,
the
Select() event procedure is triggered but the parameters passed to the procedure are
ElementID=3, Arg1=1, and Arg2=-1; so the conditional expression in the If/Then statement is
false; therefore, no label is added to the chart. With Series 1 selected, the user then clicks
on the 6th data point in Series 1. Again, the
Select() event procedure is triggered, but this
time the parameters passed to it are
ElementID=3, Arg1=1, and Arg2=6. This time, the condi-
tional in the
If/Then statement is true and the label 54 is added to the chart.
395
Chapter 9 • Excel Charts
Figure 9.11
Detecting a user
selection with the
Select() event
of the Chart
object.
Data label
396
Microsoft Excel VBA Programming for the Absolute Beginner, Second Edition
Before writing the code for the Select() event procedure, I recorded a macro
while adding a label to a charted point. This reminded me how to add the label
to individual data points using VBA.
To learn how to use the Select() event procedure of the Chart object, I added the
statement Debug.Print ElementID; Arg1; Arg2 to the procedure and watched
the Immediate window while I clicked on various components of the Chart object.
Chapter Project: The Alienated Game
The Alienated Game uses a chart sheet for the user interface (see Figure 9.12) and illustrates
the use of several VBA objects subordinate to the
Chart object. The program uses the less
common bubble chart type because the data markers (represented by
Point objects in VBA)
in a regular scatter chart cannot hold images. A total of ten data series with ten values each
are charted and their markers are randomly filled with one of seven images. The object of
the game is to swap two images such that it will create a sequence of three or more identical
images in a column or row (hereafter referred to as a score sequence). When a score sequence
is created, their images are removed from the chart and the images above the score sequence
are moved down. Finally, the empty markers at the top of the chart are randomly filled with
new images. The player scores ten points for each image removed and the game ends when
all possible moves are exhausted.
HINT
Figure 9.12
The Alienated
Game.
Requirements for the Alienated Game
From the user’s point of view, the Alienated Game is quite simple because all they have to do
is select data markers on a chart. From your point of view, I’m betting the game is more of a
challenge; especially if you’re not that comfortable with charts. If your comfort level is low,
that provides all the more reason to spend ample time planning the program.
The following list contains my requirements for the Alienated Game.
1. The game interface shall consist of a bubble chart created on a chart sheet.
2. The chart’s data point markers shall display 100 images in a 10 by 10 grid.
3. Each image displayed in a data marker shall be randomly chosen from one of seven
images.
4. The program shall be initiated from a form button placed on the chart.
5. The program shall track the user’s score and display it via a chart title.
6. The program shall display help messages to the user via a chart title.
7. When a new game begins, all data markers in the chart shall be updated with new
images.
8. Any time new images are added to the chart, the program shall scan the chart for
a score sequence.
9. When a score sequence is found, the program shall record the score (10 pts per
image), remove the images, move images above the score sequence down to fill the
vacancies, and add new images to the top of the chart.
10. When the user selects two images for swapping, the program shall validate the
selection before swapping the images. Selections are valid if they are adjacent and
non-diagonal and they must generate at least one score sequence. Valid selections
are swapped and the chart is scanned in order to process the score sequence.
11. The source data for the chart shall be added programmatically when a new game
begins and the chart is initialized. The source data shall remain static.
12. The images displayed in the chart’s data markers shall be mapped to the values in
a range of 100 cells in a hidden worksheet. Changes made to the chart during the
course of a game shall be a result of changes made to these mapped values.
Designing the Alienated Game
My goal for this project is to illustrate how to program with Excel’s Chart object model, so
its interface must take advantage of an Excel chart. This makes the project unusual with
397
Chapter 9 • Excel Charts
398
Microsoft Excel VBA Programming for the Absolute Beginner, Second Edition
respect to everything you’ve seen thus far because the game’s interface will not involve a
worksheet or VBA form. Nevertheless, charts are constructed in order to display data that is
typically stored in a worksheet; so the game will still require many of the common Excel
objects you have seen in other projects.
The Chart Sheet Interface
This chapter teaches you how to program Excel’s Chart object so the interface for the project
is built from a chart. Specifically, a chart sheet consisting of a bubble chart will serve to dis-
play the images.
The requirements state that the game must involve a 10 by 10 grid of 100 images. To satisfy
this requirement I will create the chart from ten data sets consisting of ten x,y-value pairs.
The data is charted as ten different series in the chart. Each data set must use the same set
of values for the x-axis variable to ensure vertical alignment of the images (for example, if
x=2 for one element in each series, then their corresponding data markers are vertically
aligned across the y-axis). In addition, the values for the x-axis variable must have a uniform
increment for homogeneous spacing of the images. To ensure the images are aligned hori-
zontally the y-values must be equivalent within a data series (for example, if y=2 for every
element in a series, then the corresponding data markers are aligned horizontally across
the x-axis), and the difference in the y-values between data series must also be uniform. The
magnitude of the numbers doesn’t really matter since the data is static, but I will keep it
simple and use 0-9 for the x-axis variable, and 0-9 for the y-axis series (that is, the first y-axis
data series is all 0’s, the second is all 1’s, and so on). The third variable in a bubble chart is
expressed by the size of the data marker. I don’t need this variable, but I need it to be iden-
tical for all data points such that the images are uniform in size. Figure 9.13 shows the chart
sheet interface for the Alienated Game and how the chart sheet appears before any images are
added to the data markers. Note that I formatted the chart to include a background image
simulating a starry night sky.
As can be seen in Figure 9.13 a new game is started from the click of a button. The button
must come from the Forms toolbar because you cannot place ActiveX controls on a chart
sheet. The button is assigned to a public VBA procedure that initializes the chart with new
images and clears the score so a new game can begin.
Displaying the score and help messages to the user is a bit more difficult than usual. In pre-
vious projects, I have used merged cells or Label controls to display text, but neither of these
options is available with a chart sheet. The best way to display text on a chart is to use the
axis and chart titles—that’s what you see in Figure 9.13.
For a more advanced version of the Alienated Game, check out the Alienated_
Embedded.xls project on the Book’s CD-ROM. This version of the game uses
an embedded chart for the user interface; so a class module is required to
enable the event procedures of the
Chart object.
Capturing User Selections
In order to know what image the user has selected, the program must identify the specific
data series and data point whose marker displays the selected image. As discussed previously,
selecting a chart component triggers the
Select() event of the Chart object. To identify specific
components requires testing the
ElementID, Arg1, and Arg2 arguments that Excel passes to
the
Select() event. The Alienated Game will take advantage of the Select() event procedure
for identifying user-selected images.
Mapping the Images
Keeping track of the images and their locations in the chart is critical if the game is going
to work properly. Keep in mind that the chart’s images are actually data markers; it is natural
to think of deleting or changing the data values to simulate image swaps or deletions. You
could probably even design the program to function by altering the charted values, but that
seems too complicated. Since the bubble chart will constantly have to display 100 images in
a 10 by 10 grid, it will be a lot easier if the data remains static and all the program changes
are the images contained in the data markers.
HINT
399
Chapter 9 • Excel Charts
Figure 9.13
The Alienated
Game chart sheet
interface prior
to filling the
markers with
images.
400
There are a number of methods you could use to track the chart’s images including the use
of a multi-dimensional array that is updated with each alteration of a data marker on the
chart. This also seems like a lot of extra work when I can use a worksheet range to map each
image type and its location in the chart. For example, consider the images shown in Figure
9.14 and their associated file names.
I purposely used integers in each file name to identify the specific alien. To add images to
the chart, the program must first create a 10 by 10 map of integers between 1 and 7 in a
worksheet range consisting of 10 rows and 10 columns as shown in Figure 9.15. The values
in this range (hereafter referred to as the image map) correspond directly to the integer val-
ues in the file names of the alien images.
The chart’s data markers are then loaded using the values from the image map contained
in the
ImageMap worksheet. Generating the integers randomly ensures that the image markers
are filled randomly with one of the seven images shown in Figure 9.14. The chart sheet created
from the image map shown in Figure 9.15 is shown in Figure 9.16.
Since the image map identifies each image in the chart, any change to the images required
during the course of a game must be mirrored in the image map. In fact, it will be easiest
to first update the image map and use it to update the images displayed in the chart.
Microsoft Excel VBA Programming for the Absolute Beginner, Second Edition
Figure 9.14
The images of the
aliens and their
associated file
names used in
the Alienated
Game.
401
Chapter 9 • Excel Charts
Figure 9.15
The sample map
of image
identifiers used
by the Alienated
Game to track
image markers in
the chart sheet
interface.
Figure 9.16
The chart sheet
with data markers
filled with images
using the integer
map shown in
Figure 9.15.
402
Program Outline
When playing a game, the Alienated Game should proceed as outlined in the following:
1. The user initiates a new game with a click of the form button drawn on the chart
sheet interface.
2. The chart sheet and
ImageMap worksheet containing the image map are initialized for
a new game.
3. The data is added to the chart as ten distinct series.
4. Data markers are filled with images using the image map contained in the
ImageMap
worksheet.
5. The image map is scanned for score sequences. If score sequences are found, the
score is updated and their corresponding values and images are deleted from the
image map and chart, respectively.
6. Vacancies in the image map are filled by moving values down columns and randomly
adding new values to the vacated cells at the top of the columns.
7. The images displayed in the data markers in the chart are updated by reading the
image map.
Steps 5–7 are repeated until there are no more score sequences found.
8. The user begins play by selecting two images in the chart for swapping.
9. The user’s selection is validated to ensure the swap produces a score sequence.
In addition, the swap must involve adjacent data markers (same row or column,
no diagonals).
10. If the player’s selection is invalid, a message is output to the chart sheet explaining
the problem.
Steps 5–7 are repeated until there are no more score sequences found.
11. The game continues until there are no more possible swaps that can create a score
sequence or the user decides to start a new game. Creating a sub procedure that
scans the chart for potential moves is left as an exercise for the reader.
Coding the Alienated Game
Since the program interface consists of a single chart sheet and the program requires the
Select() event of the Chart object, I have entered all of the program code in the module for
the chart sheet.
Module level declarations include a string for holding the path to the image files, integers
for holding the series and point numbers for the two images selected by the user, and a custom
Microsoft Excel VBA Programming for the Absolute Beginner, Second Edition
data type defining the type DataPoints. I will use variables declared as DataPoints to hold the
last cell in the range of cells mapped to score sequences in the chart. A
DataPoints variable
will also hold the number of cells in the score sequence.
Option Explicit
Private Type DataPoints
cellRange As Range
numCells As Integer
End Type
Private filePath As String
Private pt1Series As Integer
Private pt2Series As Integer
Private pt1Point As Integer
Private pt2Point As Integer
Initializing the Chart Sheet
The public sub procedure Main() is triggered from the form button on the chart sheet and
contains calls to the initialization procedures for the chart sheet, then scans the chart for
score sequences. Screen updating is initially turned off otherwise Excel will update the
screen as images are added or removed from the chart. Screen updating is turned back on
so that the user can see the chart before it is scanned for score sequences. Note that the
ChartTitle object is used to display help messages to the user telling them how to play the
game. The
ChartTitle object is accessed via the ChartTitle property of the Chart object,
which in turn is returned from the
Sheets property of the Application object. I added the
title to the bottom of the chart when initially formatting it.
Public Sub Main()
Dim msg As ChartTitle
Set msg = Sheets(“Alienated”).ChartTitle
‘————————————————
‘Call initialization procedures.
‘————————————————
Application.ScreenUpdating = False
InitData
AddSeries
InitSeriesImages
Application.ScreenUpdating = True
Delay 1
403
Chapter 9 • Excel Charts
404
‘——————————————————————————-
‘Scan the chart, remove and score consecutive images,
‘then update the chart with new images repeat.
‘——————————————————————————-
ProcessChart
‘————————————————————————-
‘Update messages and initialize chart for player
‘selection of two images.
‘————————————————————————-
msg.Text = “Select two adjacent aliens to swap. “ & _
“Two single clicks will select a single alien.”
End Sub
The InitData() sub procedure is called from Main() and serves to reset the score, outputs an
informational message, and fills the image maps range in the
ImageMap worksheet with ran-
dom integer values between 1 and 7. I named the range
B2:K11 ImageMap when formatting
the
ImageMap worksheet.
Private Sub InitData()
Dim msg As ChartTitle, score As AxisTitle
Dim wsAlien As Chart, wsMap As Worksheet
Dim c As Range
‘—————————————————
‘Initialize Alienated chart sheet.
‘—————————————————
Set wsAlien = Sheets(“Alienated”)
Set wsMap = Worksheets(“ImageMap”)
Set msg = wsAlien.ChartTitle
Set score = wsAlien.Axes(xlCategory).AxisTitle
score.Text = “0”
filePath = ActiveWorkbook.Path & “\AlienImages\alien”
msg.Text = “Please wait while board is initialized.”
‘————————————————————-
‘Initialize data on the Hidden worksheet.
‘————————————————————-
Randomize
With wsMap
Microsoft Excel VBA Programming for the Absolute Beginner, Second Edition
For Each c In .Range(“ImageMap”)
c.Value = Int(Rnd * 7) + 1
Next
End With
End Sub
The AddSeries() sub procedure is also called from Main() and its purpose is to add the data
to the chart. Since the data remains static, I can add it programmatically using variant
arrays. You can add a data series to a chart via the
SeriesCollection object that is returned
using the
SeriesCollection property of the Chart object. I first delete any existing series
before adding ten new series in a
For/Next loop. I set all three variables (x, y, and point size)
for each series within the loop. Since each data series requires the same set of x-values and
marker sizes, I can use variant arrays (
xArray and ptSize) with the XValues and BubbleSizes
properties of the SeriesCollection object to set the x-axis and marker size values. Values for
the y-axis variable are constant for a given set of x-values and are set using the
Values prop-
erty of the
SeriesCollection object.
Prior to setting the data values for each series, I set the
BubbleScale property of a ChartGroup
object. A ChartGroup object represents all the data series charted with the same format (line,
bar, bubble, and so on). In this example, all ten series are charted with the same format (bubble)
so the
ChartGroups property with an index value of 1 returns all ten series as a ChartGroup
object. The BubbleScale property only applies to bubble charts and sets a scale factor for the
bubbles on the chart. I have to set this property because the images I created are too large to
fit in a reasonably sized chart; thus, I scaled them down to 35 percent of their original size.
Private Sub AddSeries()
Dim I As Integer
Dim chAlien As Chart
Dim xArray As Variant, ptSize As Variant
On Error GoTo ErrorHandler
xArray = Array(0, 1, 2, 3, 4, 5, 6, 7, 8, 9)
ptSize = Array(1, 1, 1, 1, 1, 1, 1, 1, 1, 1)
‘————————————————————
‘Add 10 data series to the bubble chart.
‘————————————————————
Set chAlien = Sheets(“Alienated”)
chAlien.ChartGroups(1).BubbleScale = 35
With chAlien
405
Chapter 9 • Excel Charts
406
If .SeriesCollection.Count > 0 Then
For I = .SeriesCollection.Count To 1 Step -1
.SeriesCollection(I).Delete
Next I
End If
For I = 1 To 10
.SeriesCollection.NewSeries
.SeriesCollection(I).XValues = xArray
.SeriesCollection(I).Values = Array(10 - I, 10 - I, 10 - I, _
10 - I, 10 - I, 10 - I, 10 - I, 10 - I, 10 - I, 10 - I)
.SeriesCollection(I).BubbleSizes = ptSize
Next I
End With
Exit Sub
ErrorHandler:
MsgBox Err.Description, vbCritical, “Error”
End
End Sub
At this point in the program, the image map in the ImageMap worksheet has been randomly
filled with numbers and the chart has been initialized by resetting the score to zero and
adding ten new series of data. All that remains is to fill the chart markers with the images
of the aliens. This is accomplished in the
InitSeriesImages() sub procedure. In this procedure,
nested
For/Each loops iterate through each Points collection object associated with the
Series object for the chart. Recall that there are ten data series in the chart; therefore,
the
SeriesCollection object contains ten Series objects. Furthermore, each Series object
contains a
Points collection containing ten Point objects making for a grand total of 100
data points. The nested
For/Each loops effectively iterate through each Point object in the
chart and use the
UserPicture() method of the ChartFillFormat object to load an image of
an alien into the data marker. The
ChartFillFormat object is returned by the Fill property
of the
Point object. The specific image is selected using the value of the cell in the ImageMap
worksheet mapped to the specific Point object in the chart (recall how the file names for the
alien images were named, see Figure 9.14). If the image map does not contain a value, then
the
ColorIndex property of the Interior object associated with the Point object is set to
xlNone. This effectively removes an image from a data marker and leaves the marker without
a background color so it cannot be seen. This is included in the
InitSeriesImages() procedure
because this procedure will be called again when sequential images need to be removed
from the chart.
Microsoft Excel VBA Programming for the Absolute Beginner, Second Edition
Private Sub InitSeriesImages()
Dim chAlien As Chart
Dim chSeries As Series, chPoint As Point
Dim imageIndex As Integer
Dim wsMap As Worksheet
Dim I As Integer, J As Integer
On Error GoTo InitSeriesError
‘———————————————————————————————-
‘Use inital image map to fill data points in chart with images.
‘———————————————————————————————-
Set chAlien = Sheets(“Alienated”)
Set wsMap = Worksheets(“ImageMap”)
I = 1: J = 1
With chAlien
For Each chSeries In .SeriesCollection
For Each chPoint In chSeries.Points
imageIndex = wsMap.Range(“ImageMap”).Cells(I, J).Value
If imageIndex <> 0 Then
chPoint.Fill.UserPicture PictureFile:=filePath & _
imageIndex & “.png”
Else
chPoint.Interior.ColorIndex = xlNone ‘Erase image
End If
J = J + 1 ‘Increment column index
Next
I = I + 1 ‘Increment row index
J = 1 ‘Reset column index
Next
End With
Exit Sub
InitSeriesError:
MsgBox “An error was encountered while loading images into the chart. “ _
& vbCrLf & Err.Description, vbOKOnly, “Chart Initialization Error: “ _
& Err.Number
End
End Sub
407
Chapter 9 • Excel Charts
408
Microsoft Excel VBA Programming for the Absolute Beginner, Second Edition
Scanning the Chart
Scanning the chart sheet is required immediately after images are added to the bubble
chart. A chart scan must be triggered when a new game begins and when the player swaps
two images. Since a chart scan may ultimately result in the removal of images and subse-
quent addition of new images, this may trigger more scans.
The last procedure called from sub
Main() is ProcessChart(). The ProcessChart() sub proce-
dure essentially outlines the process of scanning a chart for score sequences, updating the
score, removing score sequences, moving images down columns in the chart, and adding
new images. Since new images are added randomly to replace scored sequences, it is always
possible that more score sequences will be created; thus, the whole process is repeated in a
Do Loop until there are no more score sequences found. Most of these tasks are accomplished
with calls to the
ScanImages() function procedure, and the CalcScore(), RemoveImages(), and
MoveImages() sub procedures.
The most interesting statement in this procedure is the conditional used with the
If/Then
code block If (Not MapRanges) <> -1. On occasion, you may need to test if a dynamic array
variable has been dimensioned with a
ReDim statement. (The variable MapRanges is declared
as a dynamic array and its value is returned from the
ScanImages() function procedure.)
Unfortunately, VBA does not provide a function that will test this condition (the
IsArray()
function only tests if the variable was originally declared as an array). To work around this
deficiency, you can test the numerical value returned by the statement
Not ArrayVariableName,
where
ArrayVariableName is the name of the array variable. If the expression Not ArrayVariable
Name
returns -1, then the variable has not been dimensioned with a ReDim statement. It’s a
bit cryptic, but in the
ProcessChart() sub procedure, it works well in the decision structure
to identify whether or not the
ScanImages() function procedure found any score sequences
and thus dimensioned the array.
Private Sub ProcessChart()
Dim MapRanges() As Range
Dim scanAgain As Boolean
‘——————————————————————————-
‘Scan the chart, remove and score consecutive images,
‘then update the chart with new images repeat.
‘——————————————————————————-
Do
MapRanges = ScanImages
If (Not MapRanges) <> -1 Then
scanAgain = True
CalcScore MapRanges
Application.ScreenUpdating = False
RemoveImages MapRanges
Application.ScreenUpdating = True
Delay 1
Application.ScreenUpdating = False
MoveImages MapRanges
Else
scanAgain = False
End If
Loop While scanAgain
End Sub
The function procedure ScanImages() is called from ProcessChart() and serves to search the
image types in the chart for score sequences by scanning the values in the image map in the
ImageMap worksheet. There is a lot happening in this procedure, so examine it closely. First,
note that the function procedure returns an array of
Range objects. This is the first example
of a function procedure I’ve shown you that returns an array of any type. All you have to do
to denote an array for the return type is add empty parentheses to the data type in the open-
ing statement for the function.
You cannot create function procedures that return arrays in versions of Excel
prior to Excel 2000.
Since the function returns an array of objects (specifically Range Objects), each element of
the array will have to be referenced with a
Set statement, but the return value will be
assigned without using the
Set keyword. As always, the data type of the return variable
must match the function’s data type.
Next, please note that the variables
endPointsRow and endPointsCol are declared as dynamic
arrays of the custom data type
DataPoints defined in the general declarations section of the
module. These two variables are assigned the return value from calls to the
ScanRowOrCol()
function procedure (listed later) and end up storing the score sequences. The range component
of the
endPointsRow and endPointsCol variables actually hold a reference to just the last cell
in a range that must be scored. This is why the second component
numCells is required in
the
DataPoints defined type. The first call to ScanRowOrCol() scans the rows in the mapped
range and the second call scans the columns. As an example, consider the map shown in Figure
9.17 where I have emphasized the ranges that the program must score.
TRAP
409
Chapter 9 • Excel Charts
410
When this image map is scanned, the array variable endPointsRow will be dimensioned with
three elements. The
cellRange components of each element will represent the ranges D4, H6,
and
E7 and their corresponding numCells components will hold 3, 3, and 4, respectively. The
array variable
endPointsCol will be dimensioned with only one element whose components
are
K8 and 4.
If a score sequence is found, then the ranges are converted to represent all cells whose values
and corresponding images must be removed. This is done with the
ConvertToRange() sub pro-
cedure that is passed the empty array variable
retRange (among others) that serves as the
return value of the
ScanImages() function procedure. The array variable retRange is dimen-
sioned according to how many different ranges containing score sequences have been found
in the image map on the
ImageMap worksheet. The elements of the retRange variable are care-
fully filled depending on whether all elements are in rows, columns, or both. Using the
example from Figure 9.17, the array variable
retRange will be dimensioned with four elements
containing references to the ranges
B4:D4, F6:H6, B7:E7, and K5:K8.
As you will see, scanning the rows and columns in the mapped range is not a trivial task so
you will have to follow this code carefully.
Private Function ScanImages() As Range()
Dim wsMap As Worksheet
Dim mapRange As Range
Microsoft Excel VBA Programming for the Absolute Beginner, Second Edition
Figure 9.17
A sample map
showing the
image types
contained in the
bubble chart for
the Alienated
Game.
Dim endPointsRow() As DataPoints, endPointsCol() As DataPoints
Dim retRange() As Range
Dim endIndex As Integer
Dim rowsExist As Boolean, colsExist As Boolean
Set wsMap = Worksheets(“ImageMap”)
Set mapRange = wsMap.Range(“ImageMap”)
‘———————————-
‘Scan rows and columns.
‘———————————-
endPointsRow = ScanRowOrCol(mapRange.Rows)
endPointsCol = ScanRowOrCol(mapRange.Columns)
If (Not endPointsRow) <> -1 Then rowsExist = True
If (Not endPointsCol) <> -1 Then colsExist = True
‘——————————————————————-
‘Convert mapped points to ranges for removal.
‘——————————————————————-
If rowsExist And colsExist Then
ReDim retRange(UBound(endPointsRow) + UBound(endPointsCol) + 1)
ConvertToRange endPointsRow, 0, True, retRange, endIndex
ConvertToRange endPointsCol, endIndex, False, retRange
End If
If rowsExist And Not colsExist Then
ReDim retRange(UBound(endPointsRow))
ConvertToRange endPointsRow, 0, True, retRange
End If
If Not rowsExist And colsExist Then
ReDim retRange(UBound(endPointsCol))
ConvertToRange endPointsCol, 0, False, retRange
End If
ScanImages = retRange
End Function
The function procedure ScanRowOrCol() is called from ScanImages() and returns a variable
array of type
DataPoints. The argument passed to this function is a range variable of the
columns or rows (see
ScanImages() function procedure) in the image map. Nested For/Each
loops iterate through the rows or columns in the image map searching for score sequences.
411
Chapter 9 • Excel Charts
412
When a sequence is found, the last cell in the range is assigned to the cellRange component of
the variable array
endPts and the number of cells in the sequence is assigned to the numCells
component. The variable array endPts is returned to the calling procedure after the image
map has been scanned.
You will notice that I have to
Set a reference to a row or column range immediately inside
the outer
For/Each loop. This seems unnecessary since the range variable r should return an
entire row or column from the image map, and the range variable
c should subsequently
return individual cells from
r without having to set a reference to the range variable
curRowOrCol; however, without setting the reference to the variable curRowOrCol, the range
variable
c will end up representing the exact same range as the variable r. This seems
counter-intuitive to me and may be a bug in the VBA language, but at least it has an easy fix.
Private Function ScanRowOrCol(rangeToScan As Range) As DataPoints()
Dim wsMap As Worksheet
Dim c As Range
Dim r As Range, curRowOrCol As Range
Dim prevVal As Integer, consecVals As Integer
Dim endPts() As DataPoints
Dim numPts As Integer
Set wsMap = Worksheets(“ImageMap”)
consecVals = 1
‘——————————————————————————————
‘Loop through individual cells in input range and determine
‘number of consecutive cells with the same value.
‘——————————————————————————————
For Each r In rangeToScan
Set curRowOrCol = wsMap.Range(r.Address)
For Each c In curRowOrCol
If prevVal = c.Value Then
consecVals = consecVals + 1
If (consecVals >= 3) Then
If consecVals >= 4 Then numPts = numPts - 1
ReDim Preserve endPts(numPts)
Set endPts(numPts).cellRange = c
endPts(numPts).numCells = consecVals
numPts = numPts + 1
End If
Microsoft Excel VBA Programming for the Absolute Beginner, Second Edition
Else
prevVal = c.Value
consecVals = 1
End If
Next
prevVal = 0
consecVals = 1
Next
ScanRowOrCol = endPts
End Function
The purpose of the sub procedure ConverToRange() is to convert the values of a DataPoints
variable representing score sequences to their full range; that is, it takes the cellRange and
numCells components of the variable and converts them to a range expressing all cells. For
example, the values
H6 and 3 stored in the cellRange and numCells components of a DataPoints
variable are converted to H4:H6 or F6:H6 depending on whether the variable represents a row or
column. The
DataPoints variable is passed in as the endPts array. The argument start represents
the starting index that must be used to specify the elements assigned to the array variable
retRange (passed by reference). The argument isRow specifies whether or not to convert the
values in the array variable
endPts to a row range or column range, and the argument endIndex
is used to specify the last index used in the variable array retRange (required if this procedure
is immediately called a second time when there are both row and column ranges to be scored).
Private Sub ConvertToRange(endPts() As DataPoints, start As Integer, _
isRow As Boolean, retRange() As Range, Optional endIndex As _
Integer)
Dim I As Integer
Dim rIndex As Integer, cIndex As Integer
‘—————————————————————————————-
‘Convert ranges passed in as single cells to continuous
‘ranges representing consecutive cells with same image map.
‘—————————————————————————————-
For I = start To UBound(endPts) + start
If isRow Then
rIndex = endPts(I - start).cellRange.Row
cIndex = endPts(I - start).cellRange.Column - _
endPts(I - start).numCells + 1
Else
413
Chapter 9 • Excel Charts