Expert PHP 5 Tools phần 6 pdf
Bạn đang xem bản rút gọn của tài liệu. Xem và tải ngay bản đầy đủ của tài liệu tại đây (1.36 MB, 46 trang )
Chapter 5
[ 215 ]
Fourth, in addition to using this utility for spot-checking our code, it should be able
to handle exceptions as well. Hopefully, the code you have been writing is taking
advantage of exceptions. After all, exceptions are the preferred way of handling
condition out of our control in PHP 5.x and higher. Besides, exceptions represent an
easy way to collect and display a lot of information about the state of the executing
program at the point in the logical ow where the exception occurred.
Fifth, since various core PHP functions and various modules generate errors instead
of exceptions, it would be a nice feature if we could include such errors in our debug
output. Just like exceptions being thrown by native PHP methods or our code, errors
can represent unforeseen circumstances in the execution of our program.
Sixth, in addition to displaying information about currently executing line of code,
we would want to look at the sequence of functions and methods executed to arrive
at the current line of code. This is called a backtrace and often consists of several
methods or functions calling each other.
Lastly, in addition to the debug information associated with exceptions and errors,
we want to be able to have our utility output any additional variables, objects,
or data structures we deem useful in diagnosing the problem.
DebugException
With that somewhat demanding list of requirements, please take a look at the code
in the following listing:
<?php
class DebugException extends Exception
{
const PLAIN = 0;
const HTML = 1;
public static $sourceCodeSpan = 10;
public static $outputFormat = self::HTML;
public static $errorScope = E_ERROR;
protected $addedDebug = array();
public function __construct($message, $code = 0)
{
// make sure everything is assigned properly
parent::__construct($message, $code);
// additional debug info?
if (func_num_args() > 2) {
Download from Wow! eBook
www.WoweBook.com
Debugging
[ 216 ]
$this->addedDebug = array_slice(func_get_args(), 2);
}
}
public function __destruct()
{
// intentionally left blank
}
// to be called statically once to handle all exceptions & errors
public static function init()
{
// handle all exceptions with this class
set_exception_handler(array('DebugException',
'exceptionHandler'));
// handle all errors with this class
set_error_handler(array('DebugException', 'errorHandler'),
self::$errorScope);
// auto-detect / guess the output format
if (php_sapi_name() == 'cli') {
// plain text for CLI use
self::$outputFormat = self::PLAIN;
} else {
// HTML output otherwise
self::$outputFormat = self::HTML;
}
}
// unregister error and exception handlers
public static function unInit()
{
// pop exception handler stack
restore_exception_handler();
// pop error handler stack
restore_error_handler();
}
// turn errors into DebugExceptions
Download from Wow! eBook
www.WoweBook.com
Chapter 5
[ 217 ]
public static function errorHandler($number,
$message,
$file,
$line,
$context)
{
// convert error to excepton and throw it
$debugException = new DebugException($number, 0, $context);
// transfer info to DebugException
$debugException->file = $file;
$debugException->line = $line;
// throw the new DebugException
throw $debugException;
}
// catching regular exceptions
public static function exceptionHandler($exception)
{
// explicitly call this class's __toString()
self::output($exception);
}
// collects & outputs the debug info
public static function output(Exception $exception)
{
$output = array();
// output file name and line number
$output[] = array('Summary:', 'An exception occurred in file
' . basename($exception->getFile())
. ' on line ' . $exception->getLine() . '.');
// output message
$output[] = array('Error message: ', $exception-
>getMessage());
// get source code of file that threw exception
$sourceExcerpt = self::getSourceExcerpt($exception-
>getFile(), $exception->getLine());
$output[] = 'Source code excerpt of lines ' .
$sourceExcerpt['start']
Download from Wow! eBook
www.WoweBook.com
Debugging
[ 218 ]
. ' through ' . $sourceExcerpt['end'] . ' of file
' . $exception->getFile() . ':';
// highlight syntax for HTML output
if (self::$outputFormat == self::HTML) {
$output[] = array('', highlight_string(implode('',
$sourceExcerpt['source']), TRUE));
} elseif (self::$outputFormat == self::PLAIN) {
$output[] = implode('', $sourceExcerpt['source']);
}
// get backtrace nicely formatted
$formattedTraces = self::getFormattedTrace($exception);
// get additionally debug info nicely formatted
$output = array_merge($output,
self::getFormattedDebugInfo($exception));
// format output depending on how $outputFormat is set
// output HTML first
if (self::$outputFormat == self::HTML) {
// have a show/hide link for each trace
for ($i = 0; $i < sizeof($formattedTraces); $i++) {
$output[] = '<a href="" onclick="var bt = document.
getElementById(\'backtrace' . ($i + 1) . '\');if (bt.style.display ==
\'\') bt.style.display = \'none\';else bt.style.display = \'\';return
false;">Backtrace step ' . ($i + 1) . ' (click to toggle):</a>';
$output[] = self::arrayToTable($formattedTraces[$i],
'backtrace' . ($i + 1));
}
echo self::arrayToTable($output, null, 'Debug Output',
FALSE);
// output plain text
} elseif (self::$outputFormat == self::PLAIN) {
// merge traces into output array
$output = array_merge($output, $formattedTraces);
// flatten the multi-dimensional array(s) for simple
outputting
$flattenedOutput = self::flattenArray($output);
Download from Wow! eBook
www.WoweBook.com
Chapter 5
[ 219 ]
echo implode(PHP_EOL, $flattenedOutput);
}
}
// extracts +/- $sourceCodeSpan lines from line $line of file
$file
public static function getSourceExcerpt($file, $line)
{
// get source code of file that threw exception
$source = file($file);
// limit source code listing to +/- $sourceCodeSpan lines
$startLine = max(0, $line - self::$sourceCodeSpan - 1);
$offset = min(2 * self::$sourceCodeSpan + 1, count($source) -
$line + self::$sourceCodeSpan + 1);
$sourceExcerpt = array_slice($source, $startLine, $offset);
if ($startLine > 0) {
array_unshift($sourceExcerpt, "<?php\n", "// \n");
}
// return source excerpt and start/end lines
return array('source' => $sourceExcerpt,
'start' => $startLine,
'end' => $startLine + $offset);
}
// creates array containing formatted backtrace
// uses syntax highlighting for source code if
// $outputFormat is HTML
public static function getFormattedTrace(Exception $exception)
{
// init output array of formatted traces
$formattedTraces = array();
// get traces from exception
$traces = $exception->getTrace();
// init counter
$count = 1;
// iterate over traces
foreach ($traces as $aTrace) {
Download from Wow! eBook
www.WoweBook.com
Debugging
[ 220 ]
// skip the method where we turned an error into an
Exception
if ($aTrace['function'] != 'errorHandler') {
// init output for this trace
$output = array();
$output[] = "Backtrace step $count:";
// output class if given
if (array_key_exists('class', $aTrace)) {
$output[] = array('Class: ', $aTrace['class']);
}
// output type if given
if (array_key_exists('type', $aTrace)) {
$output[] = array('Type: ', $aTrace['type']);
}
// output function if given
if (array_key_exists('function', $aTrace)) {
$output[] = array('Function: ',
$aTrace['function']);
// output argument to function
if (array_key_exists('args', $aTrace)) {
$output[] = array('', 'with argument(s): ' .
implode(', ', $aTrace['args']));
}
}
// get source code of file that threw exception
$sourceExcerpt =
self::getSourceExcerpt($aTrace['file'], $aTrace['line']);
$output[] = 'Source code excerpt of lines ' .
$sourceExcerpt['start']
. ' through ' . $sourceExcerpt['end'] . '
of file ' . $aTrace['file'] . ':';
// highlight syntax for HTML output
if (self::$outputFormat == self::HTML) {
$output[] = array('', highlight_string(implode('',
Download from Wow! eBook
www.WoweBook.com
Chapter 5
[ 221 ]
$sourceExcerpt['source']), TRUE));
} elseif (self::$outputFormat == self::PLAIN) {
$output[] = implode('', $sourceExcerpt['source']);
}
$formattedTraces[] = $output;
// increase step counter
$count++;
}
}
return $formattedTraces;
}
// formats the variables & objects passed to the constructor
// and stored in $addedDebug. Uses syntax highlighting for
// source code if $outputFormat is HTML
public static function getFormattedDebugInfo(Exception
$exception)
{
// init output array
$output = array();
// only the DebugException class has the addedDebug property
if (get_class($exception) == __CLASS__) {
if (count($exception->addedDebug) > 0) {
$output[] = 'Additional debug info:';
}
// iterate over each variable
foreach ($exception->addedDebug as $addBug) {
foreach ($addBug as $debugLabel => $debugVar) {
// format with print_r
if (self::$outputFormat == self::HTML) {
$output[] = array($debugLabel, '<pre>' .
print_r($debugVar, TRUE) . '</pre>');
} elseif (self::$outputFormat == self::PLAIN) {
$output[] = array($debugLabel,
print_r($debugVar, TRUE));
}
}
}
Download from Wow! eBook
www.WoweBook.com
Debugging
[ 222 ]
}
return $output;
}
// converts an array of items to output to an HTML table
// expects format:
// array('some text here', <- single cell on row 1
// array('label', $value), <- two cells on row 2
// (label and value)
// .);
public static function arrayToTable(array $contents = array(),
$id = null,
$caption = null,
$hideByDefault = TRUE)
{
$html = '';
// open table tag
if (count($contents) > 0) {
$html .= '<table style="width: 100%;border: 2px solid
$html
.= ($hideByDefault) ? 'none' : '';
$html .= ';"';
$html .= ($id != null) ? " id=\"$id\"" : '';
$html .= ">\n";
}
// add caption
if (!empty($caption) > 0) {
$html .= '<caption><h2>' . htmlentities($caption) .
"</h2></caption>\n";
}
$rowCount = 1;
$rowColors = array('#fff', '#ccc');
// iterate over input array
foreach ($contents as $row) {
$html .= "<tr style=\"background: " .
$rowColors[($rowCount % 2)] . ";\">\n";
// split arrays into label and field
if (is_array($row) && count($row) >= 2) {
$html .= '<td><strong>' . htmlentities($row[0]) .
"</strong></td>\n"
Download from Wow! eBook
www.WoweBook.com
Chapter 5
[ 223 ]
. '<td>' . $row[1] . "</td>\n";
// output single strings on a row by themselves
} else {
$html .= '<th colspan="2" style="text-align: left;">'
. $row . "</th>\n";
}
$html .= "</tr>\n";
$rowCount++;
}
// close table tag
if (count($contents) > 0) {
$html .= "</table>\n";
}
return $html;
}
// takes a multi-dimensional array and flattens it for plain text
output
public static function flattenArray(array $inputArray = array())
{
$outputArray = array();
// iterate over input array items
foreach ($inputArray as $item) {
if (is_array($item)) {
// use recursion to traverse the hierarchy
$outputArray = array_merge($outputArray,
self::flattenArray($item));
} else {
array_push($outputArray, $item);
}
}
return $outputArray;
}
}
DebugException::init();
?>.
Download from Wow! eBook
www.WoweBook.com
Debugging
[ 224 ]
There is a lot to absorb so let's take it one step at a time. The rst thing you will notice
is that the DebugException class we are dening extends PHP's built-in Exception
class. That way, we can more or less treat it like any other exception in our code.
We start the class by dening two class constants that serve as labels to the two
types of output formatting we will be supporting, namely HTML and plain text.
The property $outputFormat should be set to the value of either of those two
constants and we initialize it to be HTML. The assumption is that most of the time
we will be using this utility class in a web-based debug session.
There are two additional static properties. First, $sourceCodeSpan is an integer that
indicates the number of lines preceding and following an error line number that will
be extracted from the source le and displayed to the user. Second, $errorScope
determines which errors will be intercepted by our class and converted to an
exception. Possible values for $errorScope correspond to the valid setting for
error_reporting in the php.ini conguration le.
Since we are extending the Exception class, our constructor requires the exact
same arguments as the parent class and calling the parent constructor is the rst
thing we are doing. However, using the func_num_args() and func_get_args()
functions we are able to support additional parameters to the constructor. To be
precise, we allow any number of additional arguments that will simply be stored in
the $addedDebug property. The idea is that we can pass any variables or objects that
we wish to display in our debug output to the constructor when we instantiate and
throw our DebugException class.
The init() method is crucial to the way the DebugException class operates. It sets
two static methods to be the exception and error handler. What this means is that the
method DebugException::errorHandler will be called for any error that occurs in
our application. Analogously, execution will be handed off to the DebugException
::exceptionHandler() method whenever the interpreter encounters an uncaught
exception, including a DebugException. What this means in practice is that we only
have to throw an exception at the line in our code where we want to generate debug
output for the DebugException class to take over. In other words, all errors and
exceptions will be handled by our class and to intentionally generate debug output
all we have to do is generate one such error or exception. We will see how that is
actually done in an example following the walk-through of the code.
The other thing that the init() method does is that it tries to make an educated
guess as to whether the output is best rendered in HTML or PLAIN format. The
php_sapi_name() function provides information about the SAPI (Server Application
Programming Interface) with which the currently running PHP executable was built.
Chances are that php_sapi_name() will return cli if we're running a script from the
command line. For simplicity, we assume that all other SAPIs signal that HTML output
should be generated.
Download from Wow! eBook
www.WoweBook.com
Chapter 5
[ 225 ]
As the DebugException class registers itself as the handler of all exceptions and
errors, we provide a convenient method for undoing that in case you want to continue
execution of your code unchanged after generating debug info. The uninit() method
complements the init() method and uses the restore_exception_handler() and
restore_error_handler() methods to unregister itself and reinstate the previous
exception and error handlers.
Now we come to the static methods that are actually invoked in case an uncaught
error or exception is encountered. The DebugException::errorHandler() method
is straightforward. It takes the parameters generated by an error and uses them to
throw a new DebugException. We can do this because exceptions and errors are
quite similar in terms of the information they generate. Both have a message,
a lename, a line number, and a backtrace of other functions called for execution
to arrive at the line where the error or exception occurred.
The DebugException::exceptionHandler() method is even simpler. It takes any
exception passed in, which should be any uncaught exception in our code, and
passes it to the static method DebugException::output().
The output() method is where most of the heavy lifting is done. It basically
takes an exception and starts assembling an array of information to be displayed
at the end of the method. It does all this by functioning as a dispatcher for
ve additional methods: getSourceExcerpt(), getFormattedTrace(),
getFormattedDebugInfo(), arrayToTable(), and flattenArray(). We'll defer
a detailed discussion of these helper methods until after having looked at the
output() method.
First, the method output() summarizes the error message, lename, and line number
in plain English. It also uses utility method DebugException::getSourceExcerpt()
to extract a partial source code listing of the le in which the error or exception
occurred. If the $ouputFormat property is set to HTML, the hightlight_string()
function will be used to apply syntax highlighting to the source code excerpt.
Another integral part of our output is the backtrace of functions or methods that
were called from the top level of our script to get to the point where the exception
or error occurred. Unless your object hierarchy is at, it can happen pretty quickly
that various objects are calling methods of other objects. Before you know it, your
code has traversed seven or eight methods that all make their way into the backtrace.
Viewing that much output can be overwhelming and confusing. The detail to help
you x your code might be lost in a ood of information.
Download from Wow! eBook
www.WoweBook.com
Debugging
[ 226 ]
The output() method enlists the help of the DebugException::getFormattedTra
ce() method to pull in information about each trace, which is formatted similar to
the main exception/error information in that it contains a lename, line number, and
a source code excerpt. Since each backtrace can provide quite a bit of information and
there may be any number of these backtraces, we employ a little JavaScript to toggle
the visibility of each backtrace. By default, the user only sees a hyperlink for each trace
that will show the whole trace when clicked.
Next, the DebugException::getFormattedDebugInfo() method is in charge of
aggregating the additional debug variables that were passed to the constructor of
our class.
At the end, the only thing left is for the output() method to display the information
that was collected in the $output array. If the requested output format is PLAIN, it
will use the flattenArray() method to convert our multi-dimensional output array
to a one-dimensional and simply implode the array of text. However, if the requested
format is HTML, it will use DebugException::arrayToTable() to organize the
output in an HTML table to make it more visually appealing and easier to read.
Having worked through the actions of the output() method, let's take a look
at the cast of supporting methods that are doing much of the work. First,
getSourceExcerpt() takes the absolute path to le on the server and a line number
as input. It then reads that le and tries to extract the line number from the input
parameter and any number lines preceding and following it. The default of how
many additional surrounding lines to be returned is 10 and it is specied in the
DebugException::$sourceCodeSpan property. The method is smart enough to know
if fewer lines are available because the target line number is too close to the beginning
or end of the le. The getSourceExcerpt() returns an array containing the source
code extract; as well as the number of the rst and last line actually extracted.
Next, getFormattedTrace() iterates over the array of backtraces. For each trace, it
extracts the class, type, and function name. Finally, it also uses getSourceExcerpt()
to include some lines of code surrounding the trace point.
getFormattedDebugInfo() starts off by checking the class of the exception
being passed as a parameter. Since the $addedDebug property belongs to the
DebugException class, we only need to proceed if the exception is of that class.
However, once we have established that we are dealing with the correct class, we
simply iterate over $addedDebug and use the print_r() function to return a human
readable representation of the value of each item.
The second to last method we need to cover is arrayToTable(). This method will
be invoked only when the $outputFormat property is set to HTML. Its purpose is
to convert an array of output data to an HTML table for easier reading. The method
expects an input array where each item corresponds to a row in the table to be
Download from Wow! eBook
www.WoweBook.com
Chapter 5
[ 227 ]
constructed. There are two options for each item in the array. If the item is an array,
it will be assumed that the rst item in the sub-array is the label and the second item
is the value. All other items in the sub-array will be ignored. The label and value
will be converted to an HTML table row with two cells. Alternatively, if the item
in the output array is not an array, it will simply be printed on an individual row
of the table. arrayToTable() also takes some optional arguments: an ID to assign
to the table for easier manipulation using JavaScript, a caption, and a Boolean ag
determining whether the content of the table will rst be rendered hidden or not.
Finally, the last method to look at is flattenArray(), which takes our
multi-dimensional output array of debug info and converts it to a one-dimensional
one that can be easily imploded to generate plain text output. This method is only
used when $outputFormat is set to PLAIN, which is typically the case when you are
working from the command line or saving the output to a log le.
Using DebugException
Wow—that was certainly a lot to digest! Luckily, for all the code we had to absorb,
actually using the DebugException class couldn't be easier. All we have to do is
include the class before we want to use it, registering the exception and error handler
methods by calling DebugException::init(), and throwing a DebugException
whenever we want to generate some output. Let's look at the simple example in
the following listing:
<?php
require_once('classes/DebugException.php');
class DebugExample
{
private $imHiding = FALSE;
public function trySomething()
{
$this->somethingWrong('dead');
}
public function somethingWrong($bang)
{
$ie = array('just' => 'something',
'to' => 'output',
'for' => 'the',
'Debug' => 'Exception');
throw new DebugException("exceptions are no good!",
null,
Download from Wow! eBook
www.WoweBook.com
Debugging
[ 228 ]
array('A local associative array' =>
$ie,
'The current object is class '
. __CLASS__ => $this));
// throw new Exception("exceptions are no good!");
// trigger_error("errors are no good!");
}
}
$debugExample = new DebugExample();
$debugExample->trySomething();
?>
The DebugExample class in the above listing doesn't really serve any purpose other
than to illustrate our DebugException class. After including the DebugException
class and instantiating DebugExample, the code calls method trySomething(),
which in turn calls method somethingWrong(). We're doing this merely to generate
a backtrace. Inside somethingWrong() we then proceed to throw a DebugException.
Note how the third argument to the constructor contains additional variables that we
would like to be displayed in the debug output.
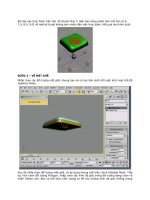
If we were to throw a regular exception at this point, the output displayed in the
browser would look something like this:
The way a regular exception gets displayed is only somewhat informative. Much
of the available information is being omitted and what is being displayed is not
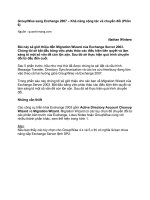
organized very well. Now let's take a look at the output our DebugException
class generates:
Download from Wow! eBook
www.WoweBook.com
Chapter 5
[ 229 ]
As you can see, the new format is much more complete and informative. For starters,
it includes source code excerpts that let you inspect the code right there in the
browser without having to switch to your development environment. It also includes
a complete hierarchy of backtraces. However, so as not to clutter the initial display,
they are hidden until you decide to view them by clicking on the corresponding link.
The above screenshot shows the second backtrace while the rst one is still hidden.
Download from Wow! eBook
www.WoweBook.com
Debugging
[ 230 ]
There is also a section for "Additional debug info" that displays the extra parameters
we passed to the DebugExceptions's constructor. And the best part of it is that all
this happens without having to write any code in the le we are debugging.
What happens if PHP encounters an error or exception rather than us throwing an
exception on purpose? You'll be happy to know that the output looks nearly identical.
Although, we do lose the ability to pass in additional debug variables to be displayed.
As you know from our discussion of the DebugException class, it can also generate
plain text output. Obviously you lose some of the niceties of the HTML version, but
you still get the source code excerpts, backtraces, and thoughtful organization. All
you have to do to enable plain text output is to set the $outputFormat property to
PLAIN before any of the output gets generated.
<?php require_once('classes/
DebugException.php');
DebugException::init(); DebugException::$outputFormat
= DebugException::PLAIN
// debug output will be in plain text …
?>
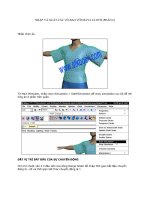
Here is the same debug output formatted for plain text display. It is long enough
that it made sense to only show the beginning and end while still gaining an
understanding of the functionality of the underlying code.
Download from Wow! eBook
www.WoweBook.com
Chapter 5
[ 231 ]
The way I use the DebugException class is that I include it in my bootstrap le or
a particular source le during development. Any exception or error will be displayed
nicely formatted. If I need more info at a particular line in the code, all I have to
do is throw a DebugException and pass it to all variables I wish to display in the
third parameter.
Remember to remove all references to the DebugException class
before deploying to production. Exposing your source code and
lesystem information to end-users in this way poses a serious
security vulnerability.
Download from Wow! eBook
www.WoweBook.com
Debugging
[ 232 ]
DebugException: Pros and cons
With everything the DebugException class does for us, we have also taken a couple
of shortcuts that should not be ignored. First, how the information can be viewed is
integrated into the class itself. We are essentially trading a tight coupling between
the formatting of the output and the actual data against compactness. If we wanted
to support additional ways of outputting, writing to a log le for example, we pretty
much have to modify the class. DebugExample is not exactly a shining example of
object-oriented design, but it is very compact and easy to use. That design decision
was made intentionally. If you wanted to use DebugException as the basis for your
own small debugging framework, you will probably want to create some classes to
hold backtraces and other debug data and other classes to handle the view layer.
If you go back a couple of pages and review our original design goals, you will see
that we have achieved all of them. DebugException is small and compact, easy to use,
and generates both HTML and plain text output. The HTML version takes advantage
of source code highlighting and dynamically showing/hiding content via JavaScript.
Moreover, DebugException handles regular (uncaught) exceptions and converts errors
to exceptions, which are then handled by the class itself. Finally, it displays backtraces,
source code excerpts, and any number of additional debug variables.
Introducing Xdebug
So far we have been talking about debugging PHP scripts by outputting info at one or
more places in your code. Now it is time to look at a professional tool that will facilitate
that activity. It also allows us to take things a step further.
Xdebug is a Zend extension that is able to hook into the internals of the PHP
interpreter. With that ability comes added power over simply outputting debug
information with echo statements. Among its many features, in this chapter we
want to focus on the ones specically designed to nd, diagnose, and x bugs. In
particular, we will be looking at improved output of stack traces, function traces, and
variables; as well as support for interactively debugging scripts locally and remotely.
In addition to the Xdebug features to be discussed below, it offers the following tools
that we will look at in other chapters of this book:
• Code Proling allows you to optimize the performance of your application
• Code Coverage Analysis feature will be used to test applications
Xdebug is an Open Source project that was started and is being maintained by the
main developer, Derick Rethans. This debugger has been around since about 2003
and is at version 2.0.5, which is PHP 5.3 compatible, as of this writing. It runs on Mac,
Linux, and Windows and you can nd out more about it at />Download from Wow! eBook
www.WoweBook.com
Chapter 5
[ 233 ]
Installing Xdebug
The preferred way of installing Xdebug is via PECL. PECL is a sister repository to
PEAR and both share the same packaging and distribution system. While both PECL
and PEAR command line clients support the same set of commands, they differ in
which repository they access. Following is an excerpt of the output generated when
using the PECL command to install Xdebug:
In addition to the PECL repository, there are other options for installing Xdebug.
Windows users can download precompiled modules. The second option is to check
the source code out of the project's CVS repository and compile it yourself. Detailed
instructions for compiling the code can be found on the xdebug.org website.
Assuming the PECL installation ran without complaining, restart Apache, and check
your phpinfo() output. To see your phpinfo() output, create the following simple
PHP script and view it in your browser. It will display many details about how PHP
was compiled, installed, and congured.
<?php
phpinfo();
?>
Download from Wow! eBook
www.WoweBook.com
Debugging
[ 234 ]
You should see Xdebug mentioned in the copyright/powered by box just below the
summary information near the top of the page.
Further down the page, you will also see a section listing all the Xdebug conguration
variables. Here is a shortened version of that section:
You shouldn't use any other Zend extension at the same
time as Xdebug—especially debuggers. They will most likely
conict with each other.
If there is no mention of Xdebug in your phpinfo() output, it means that Xdebug
was not installed properly. Here are a few pointers on where to start troubleshooting
the installation:
• Make sure that you properly restarted your web server after installing Xdebug.
Download from Wow! eBook
www.WoweBook.com
Chapter 5
[ 235 ]
• Check that your active php.ini le contains a line telling PHP to load
the extension:
(replace zend_extension with zend_extension_ts on system thread-safe
installations of PHP prior to version 5.3). Also, make sure that the path in the
above line points to an existing le.
• Scan you web server's and PHP's log les for any startup or
initialization errors.
• Consult Xdebug's online installation documentation:
/>Conguring Xdebug
I'm using Xdebug 2.0.5 to write this chapter. This version lists 44 conguration
parameters in the phpinfo() output. Rather than looking at each and every
conguration directive, we will limit ourselves to the ones that affect our task of
debugging an application. Besides, the complete list of conguration directives can
be viewed on the xdebug.org site.
Since Xdebug is a Zend extension, you can congure it by putting conguration
settings in your php.ini le. Xdebug contains a default for each possible conguration
option, which can then be overwritten in php.ini. Furthermore, you can then
overwrite these settings in Apache's httpd.conf/.htaccess le or use the ini_set()
function in any of your scripts to modify the behavior of Xdebug and the output it
generates. Here is the Xdebug specic section I added to my php.ini cong le:
[xdebug]
; tell PHP where to find the Xdebug extension and load it
zend_extension=/usr/local/apache2/php/lib/php/extensions/no-debug-non-
zts-20060613/xdebug.so
; protection
xdebug.max_nesting_level=100
; what to show when outputting variables & debug info
xdebug.show_local_vars=1
xdebug.collect_params=1
xdebug.var_display_max_children=128
xdebug.var_display_max_data=1024
Download from Wow! eBook
www.WoweBook.com
Debugging
[ 236 ]
xdebug.var_display_max_depth=5
xdebug.dump.COOKIE=*
xdebug.dump.FILES=*
xdebug.dump.GET=*
xdebug.dump.POST=*
xdebug.dump.REQUEST=*
xdebug.dump.REQUEST=*
xdebug.dump.SESSION=*
; enable & configure remote debugging
xdebug.remote_enable=1
xdebug.remote_host=127.0.0.1
xdebug.remote_port=9000
xdebug.remote_port=xdebug.remote_handler=dbgp
xdebug.remote_mode=req
xdebug.remote_log=/tmp/xdebug_remote.log
xdebug.remote_autostart=0
xdebug.idekey=dirk
; configure profiler - disabled by default, but can be triggered
xdebug.profiler_enable=0
xdebug.profiler_enable_trigger=1
xdebug.profiler_output_dir=/tmp
xdebug.profiler_output_name=xdebug.out.%s
Remember that PHP can have multiple .ini conguration les.
Often, this depends on which SAPI (Server Application Programming
Interface) you are using. For example, if you are using PHP from
the command line, you are likely using the CLI SAPI, which will
by default look for the php-cli.ini cong le. If Xdebug is not
responding as expected, you might want to make sure that you added
the conguration settings to the correct .ini le.
With the default settings in place, you can then ne-tune the conguration in your
scripts on an as-needed basis.
<?php
// configure Xdebug locally
ini_set('xdebug.var_display_max_children', 3);
ini_set('xdebug.var_display_max_data', 6);
ini_set('xdebug.var_display_max_depth', 2);
class DebugExample { … }
?>
Download from Wow! eBook
www.WoweBook.com
Chapter 5
[ 237 ]
At this point, I hope that you are thinking back to the beginning of the chapter where
we discussed the management of different sets of conguration settings. You might
want to create a .ini le dedicated to your application's Xdebug setting. You can
then have separate sections that correspond to environments, such as development,
production, proling, and so on.
Immediate benets
Once Xdebug is congured properly, you can get some of the benets it provides
without having to do much.
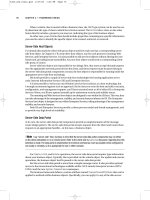
var_dump() improved
First, Xdebug overwrites our old friend, the var_dump() function. The new and
improved var_dump() function installed by Xdebug formats the output nicer and
employs some other formatting and syntax highlighting to make the information
easier to digest. Here is an example of what var_dump() output looks like without
and with Xdebug enabled.
Download from Wow! eBook
www.WoweBook.com
Debugging
[ 238 ]
var_dump() settings
The following Xdebug conguration settings affect the behavior of the var_dump()
function installed by Xdebug:
Setting Description Recommended value
xdebug.var_display_
max_children
Number array elements and
object properties to display.
128 (128)
xdebug.var_display_
max_data
Maximum string length for
values of object properties,
array elements, and values of
variables.
1024 (512)
xdebug.var_display_
max_depth
How many levels to descend
the object / array hierarchy.
5 (3)
Errors and exceptions beautied
The second out-of-the-box benet Xdebug provides is that errors and uncaught
exceptions will be formatted and displayed in HTML. This is similar to the
DebugExceptions class we constructed previously. Here is an example of the
resulting output when throwing an exception in our DebugExample class without
registering DebugException and after enabling Xdebug. Notice how the output
includes a listing of variables in local scope when the exception was thrown; as
well as a dump of all local and global variables.
Download from Wow! eBook
www.WoweBook.com
Chapter 5
[ 239 ]
Stack trace settings
The following table lists some of the settings that affect how and what information is
displayed in the stack trace when Xdebug encounters an error or exception. Rather
than presenting a complete listing of all conguration settings, we will focus on the
ones that are used most commonly and ones where it pays to change them from their
installation default.
Setting Description Recommended value
x
Whether to output
superglobals listed in xdebug.
dump.*.
1 (1)
xdebug.dump.*
List of superglobals to dump
if xdebug.dump_globals is
enabled.
xdebug.dump.COOKIE=*
xdebug.dump.FILES=*
xdebug.dump.GET=*
xdebug.dump.POST=*
xdebug.dump.
REQUEST=*
xdebug.dump.
REQUEST=*
xdebug.dump.
SESSION=*
xdebug.dump_once
Whether to dump superglobals
on all errors or only on the
rst one.
1 (1)
xdebug.dump_undefined
Whether to include empty
superglobals in dump.
1 (0)
xdebug.show_local_
vars
Whether to dump all variables
dened in the local scope
(includes top-most scope).
1 (0)
xdebug.collect_params
Whether Xdebug should
record variable names & values
passed to functions.
2 (0)
xdebug.collect_
includes
Whether to show names of
include/require<_once> les
in trace les.
1 (1)
Since stack traces make use of the var_dump() function when outputting
information, the var_dump() settings affect the appearance of stack traces as well.
Download from Wow! eBook
www.WoweBook.com