Báo cáo sinh học: "An enhanced RNA alignment benchmark for sequence alignment programs" docx
Bạn đang xem bản rút gọn của tài liệu. Xem và tải ngay bản đầy đủ của tài liệu tại đây (394.1 KB, 11 trang )
BioMed Central
Page 1 of 11
(page number not for citation purposes)
Algorithms for Molecular Biology
Open Access
Research
An enhanced RNA alignment benchmark for sequence alignment
programs
Andreas Wilm, Indra Mainz and Gerhard Steger*
Address: Institut für Physikalische Biologie, Heinrich-Heine-Universität Düsseldorf, Universitätsstr. 1, 40225 Düsseldorf, Germany
Email: Andreas Wilm - ; Indra Mainz - ;
Gerhard Steger* -
* Corresponding author
Abstract
Background: The performance of alignment programs is traditionally tested on sets of protein
sequences, of which a reference alignment is known. Conclusions drawn from such protein
benchmarks do not necessarily hold for the RNA alignment problem, as was demonstrated in the
first RNA alignment benchmark published so far. For example, the twilight zone – the similarity
range where alignment quality drops drastically – starts at 60 % for RNAs in comparison to 20 %
for proteins. In this study we enhance the previous benchmark.
Results: The RNA sequence sets in the benchmark database are taken from an increased number
of RNA families to avoid unintended impact by using only a few families. The size of sets varies from
2 to 15 sequences to assess the influence of the number of sequences on program performance.
Alignment quality is scored by two measures: one takes into account only nucleotide matches, the
other measures structural conservation. The performance order of parameters – like nucleotide
substitution matrices and gap-costs – as well as of programs is rated by rank tests.
Conclusion: Most sequence alignment programs perform equally well on RNA sequence sets with
high sequence identity, that is with an average pairwise sequence identity (APSI) above 75 %.
Parameters for gap-open and gap-extension have a large influence on alignment quality lower than
APSI ≤ 75 %; optimal parameter combinations are shown for several programs. The use of different
4 × 4 substitution matrices improved program performance only in some cases. The performance
of iterative programs drastically increases with increasing sequence numbers and/or decreasing
sequence identity, which makes them clearly superior to programs using a purely non-iterative,
progressive approach. The best sequence alignment programs produce alignments of high quality
down to APSI > 55 %; at lower APSI the use of sequence+structure alignment programs is
recommended.
Background
Correctly aligning RNAs in terms of sequence and struc-
ture is a notoriously difficult problem.
Unfortunately, the solution proposed by Sankoff [1] 20
years ago has a complexity of O(n
3m
) in time, and O(n
2m
)
in space, for m sequences of length n. Thus, most structure
alignment programs (e.g. DYNALIGN [2], FOLDALIGN
[3], PMCOMP [4], or STEMLOC [5]) implement light-
Published: 24 October 2006
Algorithms for Molecular Biology 2006, 1:19 doi:10.1186/1748-7188-1-19
Received: 30 August 2006
Accepted: 24 October 2006
This article is available from: />© 2006 Wilm et al; licensee BioMed Central Ltd.
This is an Open Access article distributed under the terms of the Creative Commons Attribution License ( />),
which permits unrestricted use, distribution, and reproduction in any medium, provided the original work is properly cited.
Algorithms for Molecular Biology 2006, 1:19 />Page 2 of 11
(page number not for citation purposes)
weight variants of Sankoff's algorithm, but are still com-
putationally demanding. Consequently, researchers often
create an initial sequence alignment that is afterwards cor-
rected manually or by the aid of RNA alignment editors (e.
g. CONSTRUCT [6], JPHYDIT [7], RALEE [8], or SARSE
[9]) to satisfy known structural constraints. The question
which alignment technique and/or program performs
best under which conditions has been extensively investi-
gated for proteins. The first exhaustive protein alignment
benchmark [10] used the so called BAliBASE (Benchmark
Alignment dataBASE) [11]. BAliBASE is widely used and
has been updated twice since the original publication
(BAliBASE 2 and 3, [12,13]). There are a number of other
protein alignment databases for example HOMSTRAD
[14], OXBench [15], PREFAB [16], SABmark [17], or
SMART [18].
These databases contain only sets of protein sequences
and, as a reference, high quality alignments of these sets.
As a result, emerging alignment tools are generally not
tested on non-coding RNA (ncRNA), despite the availabil-
ity of rather reliable RNA alignments from databases like
5S Ribosomal RNA Database [19], SRPDB [20], or the
tRNA database [21].
The BRAliBase (Benchmark RNA Alignment dataBase)
dataset used in the first comprehensive RNA alignment
benchmark published so far [22] was constructed using
alignments from release 5.0 of the Rfam database [23], a
large collection of hand-curated multiple RNA sequence
alignments. The dataset consists of two parts: the first,
which contains RNA sets of five sequences from Group I
introns, 5S rRNA, tRNA and U5 spliceosomal RNA, was
used for assessing the quality of sequence alignment pro-
grams such as CLUSTALW. The other part, consisting of
only pairwise tRNA alignments, was used to test a selec-
tion of structural alignment programs such as FOLDA-
LIGN, DYNALIGN and PMCOMP. The single sets have an
average pairwise sequence identity (APSI) ranging from
20 to 100 %.
Here we extend the previous reference alignment sets sig-
nificantly in terms of the number and diversity of align-
ments and the number of sequences per alignment. We
present an updated benchmark on the formerly identified
"good aligners" and (fast) sequence alignment programs
using new or optimized program versions. The perform-
ance of programs is rated by Friedman rank sum and Wil-
coxon tests. We restricted our selection of alignment
programs to multiple "sequence" alignment programs
because – at least for the computing resources available to
us – most structural alignment programs are either too
time and memory demanding, or they are restricted to
pairwise alignment. Next, we demonstrate for several pro-
grams that default program parameters are not optimal
for RNA alignment, but can easily be optimized. Further-
more, we evaluate the influence of sequence number per
alignment on program performance. One major conclu-
sion is that iterative alignment programs clearly outper-
form progressive alignment programs, particularly when
sequence identity is low and more than five sequences are
aligned.
Results and discussion
At first we established an extended RNA alignment data-
base for benchmarking (BRAliBase 2.1) as described in
Methods. The datasets are based on (hand-curated) seed
alignments of 36 RNA families taken from Rfam version
7.0 [24,23]. Thus, the BRAliBase 2.1 contains in total
18,990 aligned sets of sequences; the individual sets con-
sist of 2, 3, 5, 7, 10, and 15 sequences, respectively (see
Table 1), with 20 ≤ APSI ≤ 95 %.
To test the performance of an alignment program or the
influence of program parameters on performance, we
removed all gaps from the datasets, realigned them by the
program to be tested, and scored the new alignments by a
modified sum-of-pairs score (SPS') and the structure con-
servation index (SCI). The SPS' scores the identity
between test and reference alignments, whereas the SCI
scores consensus secondary structure information; for
details see Methods. Both scores were multiplied to yield
the final RNA alignment score, termed BRALISCORE. For
the ranking of program parameters and options of indi-
vidual programs, or of different programs we used Fried-
man rank sum and Wilcoxon signed rank tests; for details
see Methods. Different program options or even different
programs resulted in only small differences in alignment
quality for datasets of APSI above 80 %, which is in
accordance with the previous benchmark results [22].
Because the alignment problem seems to be almost trivial
at these high identities and in order to reduce the number
of alignments that need to be computed, we report all
results only on datasets with APSI ≤ 80 %.
Table 1: Number of reference alignments and average Structure Conservation Index (SCI) for each alignment of k sequences.
k2 k3 k5 k7 k10 k15 total
no. aln. 8976 (118) 4835 2405 (481) 1426 845 504 18990
∅ SCI 0.95 (1.05) 0.92 0.91 (0.87) 0.90 0.89 0.89 0.93
Values for the previously used data-set1 [22] are given in brackets.
Algorithms for Molecular Biology 2006, 1:19 />Page 3 of 11
(page number not for citation purposes)
Optimizing gap costs
With the existence of reference alignments specifically
compiled for the purpose of RNA alignment benchmarks,
program parameters can be specifically optimized for
RNA alignments.
Parameters for MAFFT version 5 [25] have been optimized
by K. Katoh using BRAliBase II's data-set1 [22]. The gap-
cost values of MAFFT version 4 (gap-open penalty op =
0.51 and gap-extension penalty ep = 0.041) turned out to
be far too low. Applying the improved values (op = 1.53
and ep = 0.123; these are the default in versions ≥ 5.667)
to the new BRAliBase 2.1 datasets results in a dramatic
performance gain (exemplified in Figure 1 for alignment
sets with five sequences). Similarly, parameters for MUS-
CLE [16,26] have been optimized by its author.
Motivated by the successful optimizations of MAFFT and
MUSCLE parameters, we searched for optimal gap-costs of
CLUSTALW [27,28]. We varied gap-open (go) and gap-
extension (ge) penalties from 7.5 to 22.5 and from 3.33 to
9.99, respectively (default values of CLUSTALW for RNA/
DNA sequences are go = 15.0 and ge = 6.66, respectively).
Ranks derived by Friedman tests are averaged over all
alignment sets, i. e. consisting of 2, 3, 5, 7, 10, and 15
sequences. Table 2 summarizes the results. Alignments
created with higher gap-open penalties score significantly
better. A combination of go = 22.5 and ge = 0.83 is optimal
for the tested parameter range. It should be noted that this
performance gain results mainly from a better SCI,
whereas the SPS' remains almost the same.
Similarly we optimized gap values for the recently pub-
lished PRANK [29]. Average ranks can be found in Table
3. Default values (go = 0.025 and ge = 0.5) are too high.
Due to time reasons we did not test all parameter combi-
nations; optimal values found so far are 10 times lower
than the default values. One should bear in mind that
Friedman rank tests do not indicate to which degree a par-
ticular program or option works better, but that it consist-
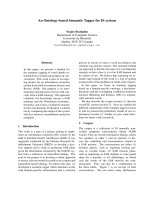
MAFFT (FFT-NS-2) and ClustalW performance with optimized and old parametersFigure 1
MAFFT (FFT-NS-2) and ClustalW performance with optimized and old parameters. PROALIGN (earlier identified
to be a good aligner [22]) is included as a reference. Performance is measured as BRALISCORE vs. reference APSI and exem-
plified for k = 5 sequences. MAFFT version 5.667 was used with optimized parameters, which are default in version 5.667, and
with (old) parameters of version 4, respectively; CLUSTALW was used either with default parameters or with optimized
parameters (see Table 2 and text).
0.4 0.5 0.6 0.7 0.8
0.4 0.6 0
.8
k5 / Mafft (opt. param.)
k5 / Mafft (old param.)
k5 / Proalign
k5 / ClustalW (default param.
)
k5 / ClustalW (opt param.)
Reference APSI
BRALISCORE
0.20.0
Algorithms for Molecular Biology 2006, 1:19 />Page 4 of 11
(page number not for citation purposes)
ently performs better. The actual performance gain can be
visualized by plotting BRALISCORE vs. reference APSI
(see Figure 1). For MAFFT the new options result in an
extreme performance gain whereas CLUSTALW gap
parameter optimization only yields a modest improve-
ment indicating that CLUSTALW default options are
already near optimal. In both cases the influence of opti-
mized parameters has its greatest impact at sequence iden-
tities ≤ 55% APSI.
Choice of substitution matrices
Each alignment program has to use a substitution matrix
for replacement of characters during the alignment proc-
ess. Traditionally these matrices differentiate between
transitions (purine to purine and pyrimidine to pyrimi-
dine substitutions) and transversions (purine to pyrimi-
dine and vice versa), but more complex matrices have
been described in the literature. An example for the latter
are the RIBOSUM matrices [30] used by RSEARCH to
score alignments of single-stranded regions. To address
the question whether incorporating RIBOSUM matrices
results in a significant performance change, we used the
RIBOSUM 85–60 4 × 4 matrix as substitution matrix for
CLUSTALW, ALIGN-M and POA, as these programs allow
an easy integration of non-default substitution matrices
via command line options. Since gap-costs and substitu-
tion matrix values are interdependent we adjusted the
original RIBOSUM values to the range of the default val-
ues. We applied Wilcoxon tests to test whether using the
RIBOSUM matrix (instead of the simpler default matrices)
yields a statistical significant performance change. Results
are summarized in Table 4. POA and ALIGN-M perform
significantly better, only CLUSTALW's performance suf-
fers from RIBOSUM utilization. The reason for CLUS-
TALW's performance loss is not obvious to us; it might be
that CLUSTALW's dynamic variation of gap penalties in a
position and residue specific manner [27] works opti-
mally only with CLUSTALW's default matrix. Further-
more, the RIBOSUM 4 × 4 matrix is based on nucleotide
substitutions in single-stranded regions whereas we used
it as a general substitution matrix. Other matrices, based
on base-paired as well as loop regions from a high-quality
alignment of ribosomal RNA [31], gave, however, no sig-
nificantly different results (data not shown).
Effect of sequence number on performance
A major improvement of the BRAliBase 2.1 datasets com-
pared to BRAliBase II is the increased range of sequence
numbers per set. This allows, for example, to test the influ-
Table 3: Averaged ranks derived from Friedman rank sum tests for prank's gap parameter optimization.
ge
go 0.05 0.125 0.1875 0.25 0.375 0.5
0.0025 3.5 2.0 4.8 NA NA NA
0.00625 6.8 3.5 3.2 NA NA NA
0.00938 8.8 6.5 8.0 NA NA NA
0.0125 NA NA NA 8.2 11.0 13.5
0.01875 NA NA NA 12.8 12.5 15.8
0.025NANANA15.817.219.0
0.03125 NA NA NA 20.0 22.0 23.8
0.0375 NA NA NA 25.0 27.0 27.8
Ranks (smaller values mean better performance) for each gap-open (go)/gap-extension (ge) value combination are averaged over all alignment sets
with k ∈ {5, 7, 10, 15} sequences and APSI ≤ 80 %. The default option for PRANK version 1508b is given in bold-face. Values for sets k2 and k3 are
missing because PRANK crashed repeatedly with these sets, but we needed all values to compute the Friedman tests.
Table 2: Averaged ranks derived from Friedman rank sum tests for ClustalW's gap parameter optimization.
ge
go 0.42 0.83 1.67 3.33 4.99 6.66 8.32 9.99
7.5 56.0 55.0 54.0 53.0 51.2 50.0 47.0 42.8
11.25 47.5 44.0 41.5 37.2 34.5 27.3 28.2 31.5
15.0 20.8 24.0 20.0 14.5 13.5 15.5 22.3 29.3
18.75 10.8 8.3 8.2 7.5 11.3 20.8 27.5 35.8
22.5 4.7 2.8 3.7 8.8 17.7 27.0 34.5 39.2
26.25 5.8 5.5 8.8 17.5 31.2 36.7 42.3 46.2
30.0 15.2 17.2 22.8 32.8 39.3 45.0 49.0 51.5
Ranks (smaller values mean better performance) for each gap-open (go)/gap-extension (ge) penalty combination are based on the BRALISCORE
averaged over all alignment sets with k ∈ {2, 3, 5, 7, 10, 15} sequences and APSI ≤ 80 %. CLUSTALW's default and the optimized value combinations
are given in bold-face.
Algorithms for Molecular Biology 2006, 1:19 />Page 5 of 11
(page number not for citation purposes)
ence of sequence number on performance of alignment
programs.
It has already been shown that iterative alignment strate-
gies generally perform better than progressive approaches
on protein alignments [10]. The same is true for RNA
alignments: with increasing number of sequences and
decreasing sequence homology iterative programs per-
form relatively better compared to non-iterative
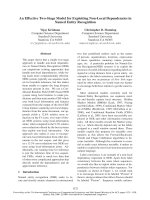
approaches. Figure 2 demonstrates this for PRRN – a rep-
resentative for an iterative alignment approach – and
CLUSTALW as the standard progressive, non-iterative
alignment program. The effect is again most notable in the
low sequence identity range (APSI < 0.55). In this range,
alignment errors occur that can be corrected during the
refinement stage of iterative programs. The same can be
demonstrated for other iterative vs. non-iterative program
combinations like MAFFT or MUSCLE vs. POA or PROA-
LIGN etc. (see supplementary plots on our website [32]).
Relative performance of RNA sequence alignment
programs
To find the sequence alignment program that performs
best under all non-trivial situations (e. g. reference APSI ≤
80 %), we did a comparison of all those programs previ-
ously identified [22] to be top ranking. If available we
used the newest program versions and optimized param-
eters. In the comparison we included the RNA version of
PROBCONS [33] (PROBCONSRNA; see [34]) whose
parameters have been estimated via training on the BRAl-
iBase II datasets. We applied Friedman rank sum tests to
each alignment set with a fixed number of sequences.
Results are summarized in Table 5. MAFFT version 5 [25]
with the option "G-INS-i" ranks first throughout all test-
sets. This option is suitable for sequences of similar
lengths, recommended for up to 200 sequences, and uses
an iterative (COFFEE-like [35]) refinement method incor-
porating global pairwise alignment information. This
option clearly outperforms the default option "FFT-NS-2",
which uses only a progressive method for alignment.
MUSCLE and PROBCONSRNA rank second and third
place.
Conclusion
We have extended the previous "Benchmark RNA Align-
ment dataBase" BRAliBase II by a factor of 30 in terms of
the alignment number and with respect to the range of
sequences per alignment. With the new datasets of BRAli-
Base 2.1 we tested several sequence alignment programs.
Obviously it is not possible to test all available programs;
here we concentrated on well-known sequence alignment
programs and those already identified as good aligners in
our first study [22]. Additionally we showed that gap-
parameters can be (easily) optimized and tested whether
the incorporation of RNA-specific substitution matrices
results in a performance change.
From these tests, in comparison with the previous one
[22], several conclusions can be drawn:
• While testing the performance of several programs, as
for example published in [36], with the k5 datasets of
BRAliBase II and of BRAliBase 2.1, we found no statisti-
cally significant difference of results obtained by the use of
these (data not shown); that is, there exists no bias due to
the smaller alignment number and the restricted number
of RNA families used in BRAliBase II.
• Gap parameter optimization has previously been done
only for protein alignment programs. The first BRAliBase
benchmark enabled several authors [25] to optimize
parameters of their programs for RNA alignments. For
example the performance of the previously lowest ranking
program MAFFT increased enormously: the new version 5
including optimized parameters [25] is now top ranking.
This result can be generalized: At least the gap costs are
critical parameters especially in the low-homology range,
but program's default parameters are in most cases not
optimal for RNA (e. g. see Tables 2 and 3).
• A further critical parameter set is the nucleotide substi-
tution matrix. We compared the RIBOSUM 85–60 matrix
with the default matrix of three programs (see Table 4).
The performance of ALIGN-M and POA was either
Table 4: Comparison of default vs. RIBOSUM substitution matrix by Wilcoxon tests
Program k2k3k5k7k10k15
ALIGN-M / +++ / /
CLUSTALW
POA +++ / / /
If the use of the RIBOSUM 85–60 matrix resulted in a statistically significant performance increase in comparison to use of the default matrix this is
indicated with a "+"; "-" indicates that the default matrix scores significantly better. If no statistical significance was found this is indicated with a "/".
Algorithms for Molecular Biology 2006, 1:19 />Page 6 of 11
(page number not for citation purposes)
unchanged or improved; however, CLUSTALW performed
worse with this RIBOSUM matrix.
• The relative performance of iterative programs (e. g.
MAFFT, MUSCLE, PRRN) improves with an increasing
number of input sequences and/or decreasing sequence
identity. The non-iterative, progressive programs show the
opposite trend. With increasing number of sequences and
decreasing sequence identity the progressive alignment
approach is more likely to introduce errors, which cannot
be corrected at a later alignment stage ("once a gap, always
a gap" [37]). These errors are corrected by iterative pro-
grams during their refinement stage.
• An APSI of 55 % seems to be a critical threshold where
the performance boost of (i) iterative programs and of (ii)
programs with optimized parameters becomes obvious.
• Given the CPU and memory demand of structure (or
sequence+structure) alignment programs, which is mostly
above (n
4
) with sequence length n and two sequences,
the use of BRAliBase 2.1 is too time consuming. Bench-
marks with structure alignment programs are possible,
however, with a restricted subset of BRAliBase 2.1 or with
BRAliBase II (e. g. see [36] and [38]).
Based upon these results we now provide recommenda-
tions to users on the current state of the art for aligning
homologous sets of RNAs:
1. Align the sequence set with a (fast) program of your
choice.
2. Check the sequence identity in the preliminary align-
ment:
• if APSI ≥ 75 %, the preliminary alignment is already of
high quality;
• if 55 % < APSI < 75 %, realign with a good sequence
alignment program; at present we recommend MAFFT (G-
INS-i) (see Table 5);
• if APSI ≤ 55 %, sequence alignment programs might not
be sufficient; structure alignment programs might be of
Performance of Prrn compared to ClustalW in dependence on sequence number per alignmentFigure 2
Performance of Prrn compared to ClustalW in dependence on sequence number per alignment. The plot shows
the difference of the scores of PRRN as a representative of an iterative alignment approach and CLUSTALW (standard
options) as a representative of a progressive approach.
∆
BRALISCORE
Reference APSI
Algorithms for Molecular Biology 2006, 1:19 />Page 7 of 11
(page number not for citation purposes)
help (e. g. STEMLOC [5], FOLDALIGN [3], etc.), but be
aware of memory and CPU usage.
We hope that the BRAliBase 2.1 reference alignments con-
stitute a testing platform for developers, similarly as the
BRAliBase II was already used for parameter optimiza-
tion/training of MAFFT [25], MUSCLE [16,26], PROB-
CONSRNA [33], STRAL [36], and TLARA [39]. In the
future we will try to provide a web interface, to which pro-
gram authors may upload alignments created with their
programs, that are than automatically scored and their
performance plotted.
Methods
The database, which consists of 18,990 sequence set files
plus their reference alignments, and scripts used for
benchmarking are available [32]. Plots showing BRALIS-
CORE, SCI, and SPS versus APSI for all alignment sets (k
∈ 2, 3, 5, 7, 10, 15) and for all programs given in Table 5
can also be found there.
Reference alignments
For the construction of reference alignments we used
"seed" alignments from the Rfam database version 7.0
[24,23]. In most cases these alignments are hand-curated
and thus of higher quality than Rfam's "full" alignments
generated automatically by the INFERNAL RNA profile
package [40]. Alignments with less than 50 sequences
were discarded to increase the possibility for creation of
subalignments (see below). The SCI (see below) for scor-
ing of structural alignment quality is based on a combina-
tion of thermodynamic and covariation measures.
Thermodynamic structure prediction becomes increas-
ingly inaccurate with increasing sequence length – e. g.
due to kinetic effects – but is widely regarded as suffi-
ciently accurate for sequences not exceeding 300 nt in
length [41,42]. Thus we excluded alignments with an
average sequence length above 300 nt to ensure proper
thermodynamic scoring.
To each remaining seed alignment we applied a "naive"
combinatorial approach that extracts sub-alignments with
k ∈ {2, 3, 5, 7, 10, 15} sequences for a given average pair-
wise sequence identity range (APSI; a measure for
sequence homology computed with ALISTAT from the
squid package [43]). Therefore we computed identities for
all sequence pairs from an alignment and selected those
pairs possessing the desired APSI ± 10 %. From the
remaining list of sequences we randomly picked k unique
sequences. Additionally we dropped all alignments with
an SCI below 0.6 to assure the structural quality of the
alignments and to make sure that the SCI can be applied
later to score the test alignments. This way we generated
overall 18,990 reference alignments with an average SCI
of 0.93; the data-set1 used in [22] consists of only 388
alignments with an average SCI of 0.89. For further details
see Tables 1 and 6.
Scores
Just as in the previous BRAliBase II benchmark [22] we
used the SCI [44] to score the structural conservation in
alignments. The SCI is defined as the quotient of the con-
sensus minimum free energy plus a covariance-like term
(calculated by RNAALIFOLD; see [45]) to the mean mini-
mum free energy of each individual sequence in the align-
ment. A SCI ≈ 0 indicates that RNAALIFOLD does not find
a consensus structure, whereas a set of perfectly conserved
structures has SCI = 1; a SCI ≥ 1 indicates a perfectly con-
served secondary structure, which is, in addition, sup-
ported by compensatory and/or consistent mutations.
The SCI can, for example, be computed by means of RNAZ
[44]. To speed up the SCI calculation we implemented a
program, SCIF, which is based upon RNAZ but computes
only the SCI. SCIF was linked against RNAlib version 1.5
[46,47].
In [22] we used the BALISCORE, which computes the frac-
tion of identities between a trusted reference alignment
and a test alignment, where identity is defined as the aver-
Table 5: Ranks determined by Friedman rank sum tests for all top-ranking programs.
Program/Option k2 k3 k5 k7 k10 k15
CLUSTALW (default)878877
CLUSTALW (optimized) 6 6 7 7 6 6
MAFFT (FFT-NS-2) 2 4 4 4 5 5
MAFFT (G-INS-i) 1 1 1 1 1 1
MUSCLE 333222
PCMA 9 1010101010
POA 789999
PROALIGN 556688
PROBCONSRNA 422334
PRRN 1095543
Programs were ranked according to BRALISCORE averaged over all alignment sets with k ∈ {2, 3, 5, 7, 10, 15} sequences and APSI ≤ 80 %. MAFFT
(G-INS-i) is the top performing program on all test sets. For program versions and options see Methods.
Algorithms for Molecular Biology 2006, 1:19 />Page 8 of 11
(page number not for citation purposes)
aged sequence identity over all aligned pairs of sequences.
Because the original BALISCORE program has certain lim-
itations and peculiarities, e. g. skips all alignment col-
umns with more than 20 % gaps, we instead used a
modified version of COMPALIGN [43] called COMPAL-
IGNP, which also calculates the fractional sequence-iden-
tity between a trusted alignment and a test alignment.
Curve progressions for scores computed by BALISCORE
and COMPALIGNP are only marginally shifted. The
COMPALIGNP score is called SPS' throughout the manu-
script.
As both scores complement each other and are correlated,
we use the product of both throughout this work and term
this new score BRALISCORE.
Statistical methods
The software package R [48] offers numerous methods for
statistical and graphical data interpretations. We used R
version 2.2.0 to carry out the statistical analyses and visu-
alizations of program performances. For a given APSI
value, the scores of the alignments are distributed over a
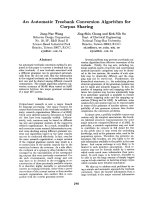
wide range (see for example, in Figure 3 the BRALIS-
COREs range from 0.0 to 1.2 at APSI = 0.45). Further-
more, the alignments are not evenly spaced on the APSI
axis. Thus we used the non-parametric lowess function
(locally weighted scatter plot smooth) of R to fit a curve
through the data points. The lowess function is a locally
weighted linear regression, which also takes into consider-
ation horizontally neighbouring values to smooth a data
point. The range in which data points are considered is
Table 6: Number of reference alignments for each RNA family
RNA family k2 k3 k5 k7 k10 k15 ∑
5S_rRNA 1162 568 288 150 90 50 2308
5_8S_rRNA 76 45 17 5 3 0 146
Cobalamin 188 61 15 4 0 0 268
Entero_5_CRE48321910 8 5122
Entero_CRE65382013 8 4148
Entero_OriR 49 31 17 11 8 4 120
gcvT 167672212 3 1272
Hammerhead_1 53 32 9 1 0 0 95
Hammerhead_3 126 99 52 32 17 12 338
HCV_SLIV 98 63 36 26 16 10 249
HCV_SLVII5133191310 7133
HepC_CRE 45 29 18 11 7 3 113
Histone3 84 59 27 11 7 6 194
HIV_FE 733 408 227 147 98 56 1669
HIV_GSL3 786 464 246 151 95 61 1803
HIV_PBS18812476553825506
Intron_gpII 181 82 35 22 11 4 335
IRES_HCV 764 403 205 146 83 47 1648
IRES_Picorna 181 117 75 53 35 25 486
K_chan_RES 124 40 2 0 0 0 166
Lysine 80 48 30 17 7 3 185
Retroviral_psi 89 57 34 24 17 11 232
SECIS 114 67 33 16 11 6 247
sno_14q I_II 44 14 1 0 0 0 59
SRP_bact11476391912 7267
SRP_euk_arch 122 94 42 21 12 6 297
S_box 91512512 7 2188
T-box 188000026
TAR 28616592624228675
THI 321 144 69 32 17 5 588
tRNA 2039 1012 461 267 143 100 4022
U1 82 65 26 16 6 0 195
U2 11283382214 7276
U6 30 21 14 7 1 0 73
UnaL2 138 71 43 20 7 0 279
yybP-ykoY12764331812 8262
∑ 8976 4835 2405 1426 845 503 18990
Algorithms for Molecular Biology 2006, 1:19 />Page 9 of 11
(page number not for citation purposes)
defined by the smoothing factor. The curve in Figure 3 was
computed by a smoothing factor of 0.3, which means that
a range of 30 % of all data points surrounding the value to
smooth are involved.
For statistical analyses we computed the BRALISCORE for
each alignment. To rate the alignment programs or pro-
gram options, we ranked these scores after averaging over
all datasets. Because the score distributions cannot be
assumed to be either normal or symmetric, we used as
non-parametric tests the Friedman rank sum and the Wil-
coxon signed rank test. R's Friedman test was accommo-
dated to calculate the ranking. Afterwards the Wilcoxon
test determined which programs or options pairwisely dif-
fer significantly. As already shown in [22] programs gen-
erally perform equally well above sequence similarity of
about 80 %; that is, with such a similarity level the align-
ment problem becomes almost trivial. To avoid introduc-
tion of a bias due to the large number of high-homology
alignments with a reference APSI > 80 %, we only used
alignments with a reference APSI ≤ 80 % for the statistical
analyses.
Programs and options
The following program versions and options were used:
ClustalW : version 1.83[27]
default: -type=dna -align
gap-opt: -type=dna -align -pwgapopen=GO -gapopen=GO
-pwgapext=GE -gapext=GE
Lowess smoothingFigure 3
Lowess smoothing. The plot shows the scattered data points, each corresponding to one alignment, exemplified by the per-
formance of PROALIGN with k = 7 sequences per alignment. The curve is the result of a lowess smoothing with a smoothing
factor of 0.3.
0.4 0.5 0.6 0.7 0.8
0.0 0.2 0.4 0.6 0.8 1.0 1.2
Reference APSI
BRALISCORE
original
smoothed
Algorithms for Molecular Biology 2006, 1:19 />Page 10 of 11
(page number not for citation purposes)
subst-mat.: -type=dna -align -dnamatrix=MATRIX -pwd-
namatrix=MATRIX
MAFFT : version 5.667[25]
default: fftns
default: ginsi
old: fftns op 0.51 ep 0.041
old: ginsi op 0.51 ep 0.041
MUSCLE : version 3.6[16,26]
-seqtype rna
PCMA : version 2.0[49]
POA : version 2[50]
-do_global -do_progressive MATRIX
prank : version 270705b – 1508b[29]
-gaprate=GR -gapext=GE
ProAlign : version 0.5a3[51]
java -Xmx256m -bwidth = 400 -jar ProAlign_0.5a3.jar
ProbConsRNA : version 1.10[33]
Prrn : version 3.0 (package scc)[52]
Competing interests
The author(s) declare that they have no competing inter-
ests.
Authors' contributions
A.W. developed the BRAliBase 2.1 and performed the
benchmark; I.M. developed the ranking tests. All authors
participated in writing the manuscript.
Acknowledgements
We are especially grateful to Paul P. Gardner for extensive discussions.
A.W. was supported by the German National Academic Foundation.
References
1. Sankoff D: Simultaneous solution of the RNA folding, align-
ment and protosequence problems. SIAM J Appl Math 1985,
45:810-825.
2. Mathews DH: Predicting a set of minimal free energy RNA
secondary structures common to two sequences. Bioinformat-
ics 2005, 21:2246-2253.
3. Havgaard JH, Lyngso RB, Stormo GD, Gorodkin J: Pairwise local
structural alignment of RNA sequences with sequence simi-
larity less than 40 %. Bioinformatics 2005, 21:1815-1824.
4. Hofacker IL, Bernhart SHF, Stadler PF: Alignment of RNA base
pairing probability matrices. Bioinformatics 2004, 20:2222-2227.
5. Holmes I: Accelerated probabilistic inference of RNA struc-
ture evolution. BMC Bioinformatics 2005, 6:73.
6. Lück R, Gräf S, Steger G: ConStruct: a tool for thermodynamic
controlled prediction of conserved secondary structure.
Nucleic Acids Res 1999, 27:4208-4217.
7. Jeon YS, Chung H, Park S, Hur I, Lee JH, Chun J: jPHYDIT: a JAVA-
based integrated environment for molecular phylogeny of
ribosomal RNA sequences. Bioinformatics 2005, 21:3171-3173.
8. Griffiths-Jones S: RALEE-RNA ALignment Editor in Emacs.
Bioinformatics 2005, 21:257-259.
9. Andersen E, Lind-Thomsen A, Knudsen B, Kristensen S, Havgaard J,
Sestoft P, Kjems J, Gorodkin J: Detection and editing of struc-
tural groups in RNA families. 2006 in press.
10. Thompson J, Plewniak F, Poch O: A comprehensive comparison
of multiple sequence alignment programs. Nucl Acids Res 1999,
27:2682-2690.
11. Thompson J, Plewniak F, Poch O: BAliBASE: a benchmark align-
ment database for the evaluation of multiple alignment pro-
grams. Bioinformatics 1999, 15:87-88.
12. Bahr A, Thompson JD, Thierry JC, Poch O: BAliBASE (Bench-
mark Alignment dataBASE): enhancements for repeats,
transmembrane sequences and circular permutations.
Nucleic Acids Res 2001, 29:323-326.
13. Thompson JD, Koehl P, Ripp R, Poch O: BAliBASE 3.0: Latest
developments of the multiple sequence alignment bench-
mark. Proteins: Structure, Function, and Bioinformatics 2005,
61:127-136.
14. Mizuguchi K, Deane CM, Blundell TL, Overington JP: HOMSTRAD:
A database of protein structure alignments for homologous
families. Protein Sci 1998, 7:2469-2471.
15. Raghava G, Searle S, Audley P, Barber J, Barton G: OXBench: A
benchmark for evaluation of protein multiple sequence
alignment accuracy. BMC Bioinformatics 2003, 4:47.
16. Edgar RC: MUSCLE: multiple sequence alignment with high
accuracy and high throughput. Nucleic Acids Res 2004,
32:1792-1797.
17. Van Walle I, Lasters I, Wyns L: SABmark-a benchmark for
sequence alignment that covers the entire known fold space.
Bioinformatics 2005, 21:1267-1268.
18. Letunic I, Copley RR, Schmidt S, Ciccarelli FD, Doerks T, Schultz J,
Ponting CP, Bork P: SMART 4.0: towards genomic data integra-
tion. Nucl Acids Res 2004, 32:D142-144.
19. Szymanski M, Barciszewska MZ, Erdmann VA, Barciszewski J: 5S
Ribosomal RNA Database. Nucleic Acids Res 2002, 30:176-178.
20. Rosenblad MA, Gorodkin J, Knudsen B, Zwieb C, Samuelsson T:
SRPDB: Signal Recognition Particle Database. Nucleic Acids
Res 2003, 31:363-364.
21. Sprinzl M, Vassilenko KS: Compilation of tRNA sequences and
sequences of tRNA genes. Nucleic Acids Res 2005, 33:D139-140.
22. Gardner PP, Wilm A, Washietl S: A benchmark of multiple
sequence alignment programs upon structural RNAs. Nucleic
Acids Res 2005, 33:2433-2439.
23. Griffiths-Jones S, Moxon S, Marshall M, Khanna A, Eddy SR, Bateman
A: Rfam: annotating non-coding RNAs in complete genomes.
Nucleic Acids Res 2005, 33:D121-124.
24. Griffiths-Jones S, Bateman A, Marshall M, Khanna A, Eddy SR: Rfam:
an RNA family database. Nucleic Acids Res 2003, 31:439-441.
25. Katoh K, Kuma Ki, Toh H, Miyata T: MAFFT version 5: improve-
ment in accuracy of multiple sequence alignment. Nucleic
Acids Res 2005, 33:511-518.
26. Edgar R: MUSCLE: a multiple sequence alignment method
with reduced time and space complexity. BMC Bioinformatics
2004, 5:113.
27. Thompson J, Higgins D, Gibson T: CLUSTAL W: improving the
sensitivity of progressive multiple sequence alignment
through sequence weighting, position-specific gap penalties
and weight matrix choice. Nucl Acids Res 1994, 22:4673-4680.
28. Chenna R, Sugawara H, Koike T, Lopez R, Gibson TJ, Higgins DG,
Thompson JD: Multiple sequence alignment with the Clustal
series of programs. Nucl Acids Res 2003, 31:3497-3500.
29. Loytynoja A, Goldman N: An algorithm for progressive multiple
alignment of sequences with insertions. PNAS 2005,
102:10557-10562.
Publish with BioMed Central and every
scientist can read your work free of charge
"BioMed Central will be the most significant development for
disseminating the results of biomedical research in our lifetime."
Sir Paul Nurse, Cancer Research UK
Your research papers will be:
available free of charge to the entire biomedical community
peer reviewed and published immediately upon acceptance
cited in PubMed and archived on PubMed Central
yours — you keep the copyright
Submit your manuscript here:
/>BioMedcentral
Algorithms for Molecular Biology 2006, 1:19 />Page 11 of 11
(page number not for citation purposes)
30. Klein R, Eddy S: RSEARCH: Finding homologs of single struc-
tured RNA sequences. BMC Bioinformatics 2003, 4:44.
31. Lescoute A, Leontis NB, Massire C, Westhof E: Recurrent struc-
tural RNA motifs, Isostericity Matrices and sequence align-
ments. Nucleic Acids Res 2005, 33:2395-2409.
32. BRAliBase 2.1 [ />]
33. Do C, Mahabhashyam M, Brudno M, Batzoglou S: ProbCons: Prob-
abilistic consistency-based multiple sequence alignment.
Genome Research 2005, 15:330-340.
34. Do C, Mahabhashyam M, Brudno M, Batzoglou S: ProbCons: Prob-
abilistic consistency-based multiple alignment of amino acid
sequences. 2006 [ />].
35. Notredame C, Holm L, Higgins D: COFFEE: an objective func-
tion for multiple sequence alignments. Bioinformatics 1998,
14:407-422.
36. Dalli D, Wilm A, Mainz I, Steger G: StrAl: Progressive alignment
of non-coding RNA using base pairing probability vectors in
quadratic time. Bioinformatics 2006, 22:1593-1599.
37. Feng D, Doolittle R: Progressive sequence alignment as a pre-
requisite to correct phylogenetic trees. J Mol Evol 1987,
25:351-360.
38. Tabei Y, Tsuda K, Kin T, Asai K: SCARNA: fast and accurate
structural alignment of RNA sequences by matching fixed-
length stem fragments. Bioinformatics 2006, 22:1723-1729.
39. Bauer M, Klau G, Reinert K: Fast and Accurate Structural RNA
Alignment by Progressive Lagrangian Optimization. In Lec-
ture Notes in Computer Science. Computational Life Sciences Volume
3695. Edited by: Berthold M, Glen R, Diederichs K, Kohlbacher O,
Fischer I. Springer-Verlag, Berlin, Heidelberg; 2005:217-228.
40. Eddy S: A memory efficient dynamic programming algorithm
for optimal structural alignment of a sequence to an RNA
secondary structure. BMC Bioinformatics 2002, 3:18.
41. Mathews DH, Sabina J, Zuker M, Turner DH: Expanded sequence
dependence of thermodynamic parameters improves pre-
diction of RNA secondary structure. J Mol Biol 1999,
288:911-940.
42. Doshi K, Cannone J, Cobaugh C, Gutell R: Evaluation of the suit-
ability of free-energy minimization using nearest-neighbor
energy parameters for RNA secondary structure prediction.
BMC Bioinformatics 2004, 5:105.
43. Eddy S: SQUID – C function library for sequence analysis.
2005 [ />].
44. Washietl S, Hofacker IL, Stadler PF: Fast and reliable prediction
of noncoding RNAs. Proc Nat Acad Sci USA 2005, 102:2454-2459.
45. Hofacker I, Fekete M, Stadler P: Secondary structure prediction
for aligned RNA sequences. J Mol Biol 2002, 319:1059-1066.
46. Hofacker I, Fontana W, Stadler P, Bonhoeffer S, Tacker M, Schuster
P: Fast folding and comparsion of RNA structures. Monatsh
Chem 1994, 125:167-188.
47. Hofacker IL: Vienna RNA secondary structure server. Nucleic
Acids Res 2003, 31:3429-3431.
48. R Development Core Team: R: A language and environment for statisti-
cal computing R Foundation for Statistical Computing, Vienna, Austria;
2005.
49. Pei J, Sadreyev R, Grishin NV: PCMA: fast and accurate multiple
sequence alignment based on profile consistency. Bioinformat-
ics 2003, 19:427-428.
50. Lee C, Grasso C, Sharlow MF: Multiple sequence alignment
using partial order graphs. Bioinformatics 2002, 18:452-464.
51. Löytynoja A, Milinkovitch MC: A hidden Markov model for pro-
gressive multiple alignment. Bioinformatics 2003, 19:1505-1513.
52. Gotoh O: Significant Improvement in Accuracy of Multiple
Protein Sequence Alignments by Iterative Refinement as
Assessed b y Reference to Structural Alignments. J Mol Biol
1996, 264:823-838.