Báo cáo sinh học: "Reconstructing protein structure from solvent exposure using tabu search" pot
Bạn đang xem bản rút gọn của tài liệu. Xem và tải ngay bản đầy đủ của tài liệu tại đây (2.57 MB, 14 trang )
BioMed Central
Page 1 of 14
(page number not for citation purposes)
Algorithms for Molecular Biology
Open Access
Research
Reconstructing protein structure from solvent exposure using tabu
search
Martin Paluszewski*
1
, Thomas Hamelryck
2
and Pawel Winter
1
Address:
1
Department of Computer Science, University of Copenhagen, Universitetsparken 1, 2100 Copenhagen, Denmark and
2
Bioinformatics
Center, Institute of Molecular Biology, University of Copenhagen, Universitetsparken 15 building 10, 2100 Copenhagen, Denmark
Email: Martin Paluszewski* - ; Thomas Hamelryck - ; Pawel Winter -
* Corresponding author
Abstract
Background: A new, promising solvent exposure measure, called half-sphere-exposure (HSE), has
recently been proposed. Here, we study the reconstruction of a protein's C
α
trace solely from
structure-derived HSE information. This problem is of relevance for de novo structure prediction
using predicted HSE measure. For comparison, we also consider the well-established contact
number (CN) measure. We define energy functions based on the HSE- or CN-vectors and
minimize them using two conformational search heuristics: Monte Carlo simulation (MCS) and tabu
search (TS). While MCS has been the dominant conformational search heuristic in literature, TS has
been applied only a few times. To discretize the conformational space, we use lattice models with
various complexity.
Results: The proposed TS heuristic with a novel tabu definition generally performs better than
MCS for this problem. Our experiments show that, at least for small proteins (up to 35 amino
acids), it is possible to reconstruct the protein backbone solely from the HSE or CN information.
In general, the HSE measure leads to better models than the CN measure, as judged by the RMSD
and the angle correlation with the native structure. The angle correlation, a measure of structural
similarity, evaluates whether equivalent residues in two structures have the same general
orientation. Our results indicate that the HSE measure is potentially very useful to represent
solvent exposure in protein structure prediction, design and simulation.
Background
The extent to which an amino acid in a protein is accessi-
ble to the surrounding solvent is highly dependent on the
type of amino acid. In general, hydrophilic amino acids
tend to be near the solvent accessible surface, while hydro-
phobic amino acids tend to be buried in the core of the
protein. To measure this effect, several solvent exposure
measures have been proposed [1-7], and one of these is
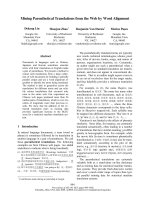
the contact number measure (CN) [7]. The CN of a residue
is the number of C
α
atoms in a sphere centered at the C
α
atom of the residue in question (Figure 1). The CN of all
residues of a protein is called the CN vector. The CN vector
is well conserved and can be predicted with high accuracy
[8].
Recently, a new promising solvent exposure measure,
called half-sphere-exposure (HSE), has been proposed [9].
While the CN measure uses a single sphere centered at the
C
α
atom, the HSE measure considers two hemispheres.
Two values, an up and a down value, are associated with
Published: 27 October 2006
Algorithms for Molecular Biology 2006, 1:20 doi:10.1186/1748-7188-1-20
Received: 30 March 2006
Accepted: 27 October 2006
This article is available from: />© 2006 Paluszewski et al; licensee BioMed Central Ltd.
This is an Open Access article distributed under the terms of the Creative Commons Attribution License ( />),
which permits unrestricted use, distribution, and reproduction in any medium, provided the original work is properly cited.
Algorithms for Molecular Biology 2006, 1:20 />Page 2 of 14
(page number not for citation purposes)
each residue, corresponding to the upper and lower hem-
isphere. The geometry of the HSE construction is shown
schematically in Figure 2. The up and down HSE values
measure two fundamentally different environments of an
amino acid, one of them corresponding to the neighbour-
hood of the side chain [9]. The HSE measure compares
favorably with other solvent exposure measures in terms
of computational complexity, sensitivity, correlation with
the stability of mutants and conservation. An important
advantage of the HSE measure is that it can be calculated
from C
α
-only or other simplified protein models. There-
fore, it forms an attractive alternative to the use of the CN
measure in protein structure prediction methods [10].
Here, we study if it is possible to reconstruct a protein's C
α
trace solely from a CN vector or an HSE vector. These vec-
tors are obtained from the protein's known native state
and our goal is therefore to evaluate the information con-
tents of these measures. This problem could become
important for de novo structure prediction, for example if
predicted HSE values are used as restraints. Preliminary
results show that the HSE measure can be predicted with
reasonably high accuracy[11]. Reconstruction of a protein
structure from a predicted HSE vector might thus be an
attractive way of approaching the sequence-to-structure
problem. Predicted CN-/HSE vectors are expected to have
errors compared to the exact vectors. The results presented
in this paper are based on exact vectors and therefore pro-
vide an upper bound on the information contents of pre-
dicted CN-/HSE vectors. If protein structure prediction
was carried out on a predicted HSE vector only, it is
expected that the results would not be better than the
results presented in this paper. It would therefore be nat-
ural to add other predictable information such as second-
ary structure, radius of gyration etc. to a structure
prediction system using predicted HSE vectors. The prob-
lem of reconstructing protein structure from vectors of
one-dimensional structural information has been studied
before. Kinjo et al.[12] used exact vectors of secondary
structure (SS), CN and residue-wise contact order (RWCO)
together with refinement using the AMBER force field to
reconstruct native like structures. Their results show that
SS and CN information without the use of RWCO is not
enough to reconstruct native like structures. Unfortu-
nately, prediction methods for the RWCO measure only
have moderate performance as compared to SS and
CN[12].
Porto et al.[13] described an algorithm for reconstructing
the contact map (CM) from its principal (one-dimen-
sional) eigenvector. However, methods for predicting a
high quality eigenvector are not likely to exist. Here, we
only consider measures that potentially can be predicted
with high accuracy. Furthermore we only use one type of
measure (either CN or HSE), which is important for eval-
uating the information content of a measure. To this end,
we compare structure reconstruction using an energy
function based on the HSE measure with an energy func-
tion that uses the well-established CN measure.
If an approximate CN-/HSE vector is obtained from a pre-
diction method, there might be no structure that exactly
realizes the vector. In that case, we are interested in find-
ing a structure with a CN- or HSE-vector similar to the pre-
dicted vector. Therefore we define energy functions based
on the HSE- or CN-vectors and minimize them using two
conformational search heuristics: Monte Carlo simulation
(MCS) and tabu search (TS). MCS has been widely used for
protein structure prediction, and TS has been applied with
great success to many optimization problems, but has
rarely been used for protein structure prediction [14-16].
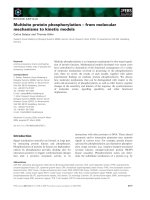
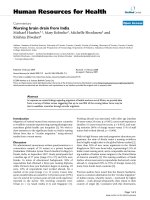
HSEFigure 2
HSE. Given the positions of 3 consecutive C
α
atoms (A, B, C),
the approximate side-chain direction
b
can be computed as
the sum of and . The plane perpendicular to
b
cuts
the sphere centered at B in an upper and a lower hemi-
sphere.
G
V
AB
JGJJ
CB
JGJJ
G
V
CNFigure 1
CN. The contact number (CN) of a residue.
Algorithms for Molecular Biology 2006, 1:20 />Page 3 of 14
(page number not for citation purposes)
In this article, the radius of the HSE sphere is chosen to be
12 Å for all experiments. The optimal radius has yet to be
determined, both in terms of predictability and recon-
structability. If the radius is too small, important residue
pairs might be overlooked. On the other hand, if the
radius is too large, many irrelevant residues are consid-
ered. In this respect, 12 Å seems to be a good compromise
[9].
The rest of the article is organized as follows. In the next
section we describe the energy function based on the HSE
measure. Then the protein abstraction and lattice model
are discussed. In section Heuristics, we present the two
conformational search heuristics, MCS and TS. In section
Lattice experiments, MCS and TS are evaluated in lattices of
different complexity. Finally, we evaluate the information
content (that is, to what extent they can be used to recon-
struct a protein structure) of the HSE and CN measures
using TS and a high complexity lattice.
HSE energy function
The similarity of two HSE vectors A and B of length N can
be measured using the following RMS deviation:
where and are the up and down values
of the i'th index. RMSD (A, B) can be used to describe the
energy of structure S
A
where A is the HSE vector of S
A
and
B is the HSE vector of the native structure. These defini-
tions are easily extended to the CN measure. The energy
functions are the only optimization criteria used by the
MCS and TS algorithms.
The protein model
The HSE and CN energy functions only depend on the
positions of the C
α
atoms in the protein backbone. This
allows us to simplify the problem by considering a protein
as a chain of connected points representing the positions
of the C
α
atoms. Furthermore, to reduce and discretize the
conformational space of the protein, we require the C
α
atoms of the chain to be positioned on a 3D lattice. A lat-
tice can be defined as a set of basis vectors corresponding
to the directions to the neighbouring nodes. The basis vec-
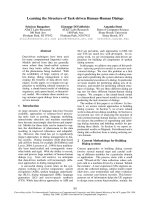
tors of the simple cubic lattice (SCC) are the cyclic permu-
tations of [± 1,0,0] ([1,0,0], [-1,0,0], [0,1,0], [0,-1,0],
[0,0,1], [0,0,-1]) and the basis vectors of the face centered
cubic lattice (FCC) are the cyclic permutations of [± 1, ±
1,0] ([1,1,0], [1,0,1], [1,-1,0], [1,0,-1], [-1,1,0], [-1,0,1], [-
1,-1,0], [-1,0,-1], [0,1,1], [0,1,-1], [0,-1,1], [0,-1,-1]). This
gives 6 basis vectors for SCC and 12 for FCC as illustrated
in Figure 3. The length of an edge between two neighbour-
ing nodes is taken to be 3.8 Å which is the average distance
between two consecutive C
α
atoms in proteins.
Lattice models are widely used for studying the funda-
mental properties of protein structure[17]. Such models
have for example provided invaluable insights on topics
such as the validity of pairwise energy functions[18], the
evolution of protein superfamilies[19] and the impor-
tance of local structural bias in the determination of a pro-
tein's fold[20]. Many lattice models have been proposed
and evaluated in the literature. Not surprisingly, experi-
RMSD( , )
(( ) ( ) )
,AB
AB AB
N
uu dd
i
N
ii ii
=
−+−
=
∑
22
1
2
{,}AB
u
i
{,}AB
d
i
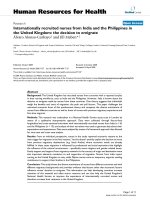
LatticesFigure 3
Lattices. Interior nodes of the SCC and FCC lattices are connected to respectively 6 and 12 neighbouring nodes. Nodes of
high coordination lattices have many neighbours because of variable edge size.
Algorithms for Molecular Biology 2006, 1:20 />Page 4 of 14
(page number not for citation purposes)
ments show a high correlation between the number of
basis vectors of a lattice and its ability to represent a pro-
tein backbone[21,22]. When deciding on a lattice model,
one must always consider the trade-off between the reduc-
tion of the conformational space and the quality of the
structure representation. Therefore, in section Lattice
experiments we evaluate four different lattices of various
complexity: The SCC lattice, the FCC lattice and two high
coordination (HC) lattices with 54 and 390 basis vectors,
respectively.
A high coordination lattice has an underlying cubic lattice
with unit length less than 3.8/N Å for some integer N > 1.
Cubic lattice points are connected in the high coordina-
tion lattice if their Euclidean distance is between 3.8 ±
ε
for some
ε
> 0. The high coordination lattices used here
are named HC4 and HC8 corresponding to their N value
(4 and 8). The
ε
value is 0.2 for all HC lattices. Figure 3
shows an illustration of a 2D high coordination lattice
with N = 3 and
ε
= 0.4. High coordination lattices have
previously been used for protein structure predic-
tion[23,24]. Note that the SCC and FCC lattices both have
the excluded volume property, meaning that atoms at two
different lattice points will never collide. This property
does not necessarily hold for high coordination lattices,
and collisions must therefore be detected explicitly.
Heuristics
We apply two iterative search heuristics for minimization
of the HSE energy. One of them is the tabu search meta-
heuristic proposed by F. Glover in 1989[25,26]. A meta-
heuristic is a general framework that can be specialized to
solve various optimization problems. For many problems
in Operations Research (OR), tabu search is the metaheu-
ristic of choice. However, for protein structure prediction,
tabu search has only been given a modest amount of
attention[14-16].
In Algorithm 1 and 2 (Figures 5 and 6) the pseudo code
for tabu search is shown. TS is basically a local improve-
ment heuristic where the best structure in a neighbour-
hood is repeatedly selected. However, memory is used to
prevent cycling in local minima. A previous TS implemen-
tation [16] inserts visited structures into a tabu list and
only consider new structures if they are not in the tabu list.
We have found that extending the tabu definition
improves the performance considerably. Here, we still
keep a list of previously visited structures in a so-called
explicit tabu list. Each structure in the explicit tabu list
defines a set of implicit tabu structures. Given a structure E
in the explicit tabu list, a structure I is said to be implicit
tabu if the distance-RMSD (dRMSD) between E and I is
less than
ε
and the energy of I is greater than or equal to
the energy of E. The adjustable parameter
ε
is called the
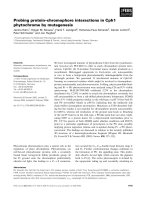
tabu difference. Figure 4 illustrates a sequence of visited
structures (black points) in a solution space. Only the vis-
ited structures are inserted in the explicit tabu list. The
additional green and red points correspond to structures
within
ε
dRMSD of the explicit tabu structures. Green
points are structures with lower energy and red points are
structures with higher energy than the explicit tabu struc-
ture. When choosing a new solution in the neighbour-
hood three things can happen, a) A solution is more than
ε
dRMSD away from all explicit tabu structure. b) the solu-
tion is within
ε
dRMSD, and the energy is lower than the
explicit tabu structure, c) the solution is within
ε
dRMSD,
and the energy is higher than the explicit tabu structure.
Structures that comply with case c are said to be implicit
tabu and cannot be visited. Note that when
ε
= 0 the search
heuristic works as a regular TS heuristic since only visited
structures become tabu. The use of implicit tabu structures
is new in the context of protein structure prediction. How-
ever, in TS implementations for OR problems it is a com-
mon technique to make features of a solution tabu, such
that regions of the search space become tabu.
We have also applied standard Monte Carlo simulation
(MCS) for minimizing the HSE energy. MCS heuristics are
stochastic and therefore differ from TS by being nondeter-
mistic. An MCS iteration consists of randomly choosing a
protein conformation in the neighbourhood of a current
conformation. For a fixed temperature T, the new protein
conformation is accepted with the probability
p = e
-ΔE/T
,
where ΔE is the difference between the energy of the cur-
rent conformation and the new conformation. A protein
conformation is modelled as a list of N vectors, where N
is the number of C
α
atoms of the protein. The neighbour-
hood of both MCS and TS consists of conformations
resulting from changes of one, two or three consecutive
indices. A single index change results in a new structure
where one part of the structure is fixed and the other part
is translated. Two or three indices are changed locally such
that the parts of the structure before and after the chang-
ing indices are fixed. All local index changes between two
lattice points can be stored in a table to speed up the com-
putation time significantly.
Lattice experiments
Here, we evaluate TS and MCS on lattices of different com-
plexity. The purpose of the experiments in this section is
to tune the parameters (lattice type, tabu difference, tem-
perature). In the next section we fix the parameters to their
optimal values found here and compare the HSE and CN
measures on different proteins. For each lattice, the heu-
ristics are initialized with 20 random conformations using
different parameter values. The variable parameter of MCS
is the temperature and the variable parameter of TS is the
Algorithms for Molecular Biology 2006, 1:20 />Page 5 of 14
(page number not for citation purposes)
tabu difference. Each run is stopped after 15 minutes and
the structure with the lowest observed HSE energy is
reported. To get reasonable running times for these exper-
iments, the HSE energy is based on the native structure of
the small protein Protegrin 1 (1PG1, 18 residues). Tables 1
and 2 show the results of the lattice experiments for the TS
and MCS heuristics. There is a row for each lattice type and
data columns show the average HSE energy found over
the 20 runs for the various parameters. In the SCC lattice,
structures with the same HSE energy are found in all 20
runs (tabu difference 0.4 and 0.5), but the best observed
HSE energy is rather high. The reason is that the SCC lat-
tice is very coarse grained and low energy structures there-
fore do not exist in this lattice. For lattices of increasing
complexity, the ability to find structures with lower energy
increases. TS and MCS seem to perform equally well in
low complexity lattices. However, in high coordination
lattices, the TS heuristic performs slightly better than MCS
on average. For the lattice with highest complexity (HC8)
TS found zero energy structures for all 20 runs, this robust-
ness was not observed for the MCS heuristic. These results
indicate that conformational search heuristics using the
HSE measure require high complexity lattices or off-lattice
models with a high degree of freedom. Furthermore, TS is
slightly more robust that MCS in high coordination lat-
tices. The results of experiments with variable tabu list size
Explicit- and implicit tabu structuresFigure 4
Explicit- and implicit tabu structures. Black points represent explicit tabu structures and red points represent implicit
tabu structures.
Algorithm 1Figure 5
Algorithm 1.
Algorithms for Molecular Biology 2006, 1:20 />Page 6 of 14
(page number not for citation purposes)
and variable tabu difference in the HC8 lattice are shown
in Figure 7. The figure shows that the tabu list size should
generally be more than 50 elements, and there is no gain
of having a very long list.
Comparison of HSE and CN measures
In the previous section, experiments on a small protein
show that minimization of the HSE energy in high coor-
dination lattices leads to structures with HSE vectors that
are very similar (or equal) to the native structure. In this
section, experiments on proteins of varying size are done
using the TS heuristic with tabu difference 0.4 and the
HC8 lattice. The energy functions are based on the HSE
vectors of native structures as described in section HSE
energy function. In addition to the HSE energy, the CN
energy is considered for comparison. The main purpose of
the experiments is to examine the reconstructability of a
protein's backbone solely from the information stored in
the HSE-/CN vectors.
Each TS run is started from a random structure which is
iteratively improved as described in section Heuristics. For
these experiments we want to start TS on 100 random
structures that are as different from each other as possible.
Therefore, to effectively sample the search space, 10000
random conformations are initially generated. Ideally,
from this set of 10000 conformations, we would like to
choose the set of 100 conformations such that the mini-
mum RMSD between any two conformations is maxi-
mized. This problem is generally known as the p-
dispersion problem and is NP hard[27]. Solving this prob-
lem to optimality is therefore not feasible, so we use a
greedy heuristic to find a good set of 100 different random
conformations. The greedy heuristic works by first picking
a random conformation. The following 99 conformations
are then picked one at a time, such the minimimum
RMSD to any of the already picked conformations is max-
imized.
For each protein, the energy function based on its native
structure is minimized for each of the 100 random start-
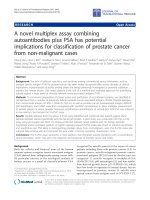
Table 1: Average HSE energy for Protegrin 1 using TS on various lattices and tabu differences.
Tabu difference
Lattice 0.0 0.1 0.2 0.3 0.4 0.5 0.6 0.7 0.8 0.9 1.0
SCC 1.76 1.65 1.64 1.64 1.64 1.64 1.64 1.64 1.64 1.64 1.64
FCC 1.52 1.12 1.12 1.11 1.07 1.07 1.04 1.05 1.03 1.03 1.03
HC4 1.13 0.41 0.36 0.30 0.28 0.27 0.29 0.32 0.32 0.36 0.38
HC8 1.21 0.46 0.08 0.01 0.00 0.00 0.01 0.07 0.15 0.22 0.30
The best averages for each lattice type are boldfaced. The column with 0.0 tabu difference corresponds to the results of a regular TS
implementation with no implicit tabu structures.
Algorithm 2Figure 6
Algorithm 2.
Algorithms for Molecular Biology 2006, 1:20 />Page 7 of 14
(page number not for citation purposes)
ing conformations and the structures with lowest energy
are reported. The search is stopped after 12 hours or if the
energy reaches zero. Zero energy means that a structure
with exactly the same HSE- or CN vector as the native
structure is found (but not necessarily identical struc-
tures).
To evaluate the quality of the structures with low energy,
the RMSD with the native structure and angle correlation
[28,29] is used. Angle correlation is a measure with the
following definition. For each C
α
, let
α
be the vector
pointing in the side chain direction (see Figure 2). Let
be the vector pointing in the direction of the mass
center, and let
θ
α
be the angle between
α
and . The
angle correlation measure is the average of the differences
in
θ
α
between the optimized structure and the native
structure. Zero angle correlation is perfect correlation, 90°
is random correlation and 180° is perfect 'anti'-correla-
tion. Note that the CN- and HSE vectors of a structure are
identical to the vectors of the mirror of the structure.
Therefore, in the following results, if the RMSD between a
structure and its native mirror image is smaller we report
this value instead. All computations were performed on a
236 nodes Dell Optiplex GX260 cluster (2,4 GHz P4, 512
Mb RAM).
G
V
V
mc
α
→
G
V
V
mc
α
→
Table 2: Average HSE energy for Protegrin 1 using MCS on various lattices and temperatures.
Temperature
Lattice 0.000 0.002 0.004 0.006 0.008 0.010 0.012 0.014 0.016 0.018 0.020 0.022
SCC 1.88 1.80 1.74 1.68 1.68 1.65 1.64 1.64 1.64 1.64 1.64 1.64
FCC 1.57 1.39 1.25 1.15 1.08 1.05 1.03 1.03 1.03 1.03 1.03 1.03
HC4 1.48 1.09 0.85 0.63 0.54 0.48 0.37 0.32 0.31 0.29 0.27 0.34
HC8 1.29 0.46 0.37 0.25 0.17 0.06 0.07 0.07 0.04 0.08 0.15 0.28
The best averages for each lattice type are boldfaced.
Lattice experimentsFigure 7
Lattice experiments. The two first plots show the values in table 1 and 2. The right figure shows the average HSE energy on
HC8 with variable tabu list size and variable tabu difference.
Algorithms for Molecular Biology 2006, 1:20 />Page 8 of 14
(page number not for citation purposes)
Results and discussion
The results of the HSE and CN comparisons are shown in
Table 3. The table shows how many of the 100 HSE/CN
minimized conformations are below a certain RMSD
threshold. The associated RMSDs and energy values of the
100 conformations are also shown. In Figures 8 to 12, his-
tograms show the RMSD and energy distribution of the
CN- or HSE-optimized structures. The histograms reveal
that most of the lowest energy structures are similar to the
native structure. This trend is much more prevalent for the
HSE-optimized structures. Based on the histograms, we
conclude that the CN-/HSE-energy functions have a large
smooth minimum around the structure of the native state
and few smaller local minima scattered around the con-
formational space.
Scatter plots show the angle correlation vs. RMSD. The
Figures also show the best HSE- and CN-optimized struc-
tures superimposed on the native structure. The yellow
backbone is the native structure, the red backbone is the
best HSE optimized structure and the green backbone is
the best CN optimized structure.
The CN and HSE comparisons show that low HSE-energy
structures are generally closer to the native structure than
low CN-energy structures, this both in terms of RMSD and
angle correlation. A backbone structure with a good angle
correlation implies that the general orientation of the res-
idues is accurate. The plots show that this property is
much more prevalent in HSE-optimized structures. Exist-
ing protein structure prediction methods that use the CN
measure could therefore benefit from using the HSE meas-
ure instead of the CN measure.
Here we have developed a lattice model for protein struc-
ture prediction using the CN-/HSE energy functions. The
search heuristic is based on TS with a novel tabu defini-
tion and the results indicate that TS performs better than
MCS for this problem. TS with this new tabu definition
might also be applied with success for other protein struc-
ture optimization problems.
Lattice experiments suggest that near zero energy struc-
tures only exists in high coordination lattices. Therefore,
when using the HSE measure the model should have a
high degree of freedom. All results are found using small
proteins (the largest protein has 35 amino acids). When
using larger proteins, it becomes very time consuming to
find low energy structures and they are often not native
like.
We have shown that it is possible to reconstruct the back-
bone of small proteins using the HSE vector of the native
structure. Obviously, a predicted HSE vector would have
some errors or noise as compared to the exact HSE vector.
A future research project could therefore be to analyze the
reconstructability of a protein backbone using HSE vec-
tors with various degree of noise. Other directions could
be to consider a more detailed energy function using other
predictable information such as secondary structure.
Another option could be to enforce protein-like geometry,
using for example angular constraints.
Table 3: Comparison of the HSE- and CN measures for various proteins.
Residues Measure < 7 Å
RMSD
< 6 Å
RMSD
< 5 Å
RMSD
< 4 Å
RMSD
< 3 Å
RMSD
< 2 Å
RMSD
lowest
RMSD
lowest
energy
Human Endothelin (1EDN)
21 CN 100 100 98 60 18 0 2.09 0.00
HSE 100 100 100 93 65 37 0.88 0.00
Tryptophan Zipper 1(1LE0)
13 CN 100 100 100 100 100 22 1.38 0.00
HSE 100 100 100 100 100 67 0.95 0.00
Third Zinc Finger (1SRK)
35 CN 60 42 17 (1SRK) 1 0 0 3.52 0.00
HSE 563313 5 0 03.02 0.33
Mu-Conotoxin GIIA (1TCH)
23 CN 100 100 97 63 23 5 1.58 0.00
HSE 100 100 100 97 61 38 0.91 0.00
Pandinus Toxin (2PTA)
35 CN 59 32 14 3 0 0 3.17 0.00
HSE 58441711 2 02.66 0.33
Algorithms for Molecular Biology 2006, 1:20 />Page 9 of 14
(page number not for citation purposes)
Human Endothelin (1EDN), 21 residuesFigure 8
Human Endothelin (1EDN), 21 residues. In the energy versus RMSD plot, the CN values have an offset of 0.01 for better
illustration.
Algorithms for Molecular Biology 2006, 1:20 />Page 10 of 14
(page number not for citation purposes)
Third Zinc Finger (1SRK). 35 residuesFigure 9
Third Zinc Finger (1SRK). 35 residues.
Algorithms for Molecular Biology 2006, 1:20 />Page 11 of 14
(page number not for citation purposes)
Mu-Conotoxin GIIA (1TCH). 23 residuesFigure 10
Mu-Conotoxin GIIA (1TCH). 23 residues. In the energy versus RMSD plot, the CN values have an offset of 0.01 for bet-
ter illustration.
Algorithms for Molecular Biology 2006, 1:20 />Page 12 of 14
(page number not for citation purposes)
Pandinus Toxin (2PTA). 35 residuesFigure 11
Pandinus Toxin (2PTA). 35 residues.
Algorithms for Molecular Biology 2006, 1:20 />Page 13 of 14
(page number not for citation purposes)
In this article, we only considered lattice models. How-
ever, off-lattice models and other conformational search
heuristics such as replica exchange MCMC[30] could be
considered as well.
Acknowledgements
Thomas Hamelryck is supported by a Marie Curie Intra-European Fellow-
ship within the 6th European Community Framework Programme. Martin
Paluszewski and Pawel Winter are partially supported by a grant from the
Danish Research Council (51-00-0336).
References
1. Lee B, Richards F: The Interpretation of Protein Structures:
Estimation of Static Accessibility. J Mol Biol 1971, 55:379-400.
2. Greer J, Bush BL: Macromolecular shape and surface maps by
solvent exclusion. Proc Natl Acad Sci USA 1978, 75:303-7.
3. Connolly ML: Solvent-accessible surfaces of proteins and
nucleic acids. Science 1983, 221(4612):709-13.
4. Chakravarty S, Varadarajan R: Residue depth: a novel parameter
for the analysis of protein structure and stability. Structure
1999, 7(7):723-32.
5. Pintar A, Carugo O, Pongor S: Atom depth in protein structure
and function. Trends Biochem Sci 2003, 28(11):593-7.
6. Pintar A, Carugo O, Pongor S: Atom depth as a descriptor of the
protein interior. Biophys J 2003, 84(4):2553-61.
7. Pollastri G, Baldi P, Fariselli P, Casadio R: Prediction of coordina-
tion number and relative solvent accessibility in proteins.
Proteins 2002, 47(2):142-53.
8. Kinjo A, Horimoto K, Nishikawa K: Predicting absolute contact
numbers of native protein structure from amino acid
sequence. Proteins 2005, 58:158-65.
9. Hamelryck T: An amino acid has two sides: a new 2D measure
provides a different view of solvent exposure. Proteins 2005,
59:38-48.
10. Simons KT, Kooperberg C, Huang E, Baker D: Assembly of protein
tertiary structures from fragments with similar local
sequences using simulated annealing and Bayesian scoring
functions. J Mol Biol 1997, 268:209-25.
Tryptophan Zipper 1 (1LEO). 13 residuesFigure 12
Tryptophan Zipper 1 (1LEO). 13 residues. All optimized structures have zero energy.
Publish with BioMed Central and every
scientist can read your work free of charge
"BioMed Central will be the most significant development for
disseminating the results of biomedical research in our lifetime."
Sir Paul Nurse, Cancer Research UK
Your research papers will be:
available free of charge to the entire biomedical community
peer reviewed and published immediately upon acceptance
cited in PubMed and archived on PubMed Central
yours — you keep the copyright
Submit your manuscript here:
/>BioMedcentral
Algorithms for Molecular Biology 2006, 1:20 />Page 14 of 14
(page number not for citation purposes)
11. Bjarni Vilhjalmsson, Thomas Hamelryck: Predicting a New Type of
Solvent Exposure. ECCB Computational Biology Madrid 05 P-C35
Poster 2005.
12. Kinjo AR, Nishikawa K: Recoverable one-dimensional encoding
of three-dimensional protein structures. Bioinformatics 2005,
21(10):2167-70.
13. Porto M, Bastolla U, Roman HE, Vendruscolo M: Reconstruction of
protein structures from a vectorial representation. Phys Rev
Lett 2004, 92(21):.
14. Pardalos PM, Liu X, Xue GL: Protein Conformation of a Lattice
Model Using Tabu Search. Journal of Global Optimization 1997,
11:55-68.
15. Morales LB, Garduño-Juárez R, Aguilar-Alvarado JM, Riveros-Castro
FJ: A parallel tabu search for conformational energy optimi-
zation of oligopeptides. Journal of Computational Chemistry 2000,
21(2):147-156.
16. Oakley M, Garibaldi J, Hirst J: Lattice models of peptide aggrega-
tion: Evaluation of conformational search algorithms. J Com-
put Chem 2005, 26(15):1638-46.
17. Dill KA, Bromberg S, Yue K, Fiebig KM, Yee DP, Thomas PD, Chan
HS: Principles of protein folding-a perspective from simple
exact models. Protein Sci 1995, 4:561-602.
18. Thomas PD, Dill KA: Statistical potentials extracted from pro-
tein structures: how accurate are they? J Mol Biol 1996,
257:457-69.
19. Zeldovich KB, Berezovsky IN, Shakhnovich EI: Physical origins of
protein superfamilies. J Mol Biol 2006, 357(4):1335-43.
20. Chikenji G, Fujitsuka Y, Takada S: Shaping up the protein folding
funnel by local interaction: Lesson from a structure predic-
tion study. Proc Natl Acad Sci USA 2006, 103:3141-3146.
21. Adam Godzik, Andrzej Kolinski, Jeffrey Skolnick: Lattice Represen-
tations of Globular Proteins: How Good Are They. 1993
[ />ABSTRACT].
22. Park B, Levitt M: The complexity and accuracy of discrete state
models of protein structure. J Mol Biol 1995, 249(2):493-507.
23. Kihara D, Lu H, Kolinski A, Skolnick J: TOUCHSTONE: an ab ini-
tio protein structure prediction method that uses threading-
based tertiary restraints. Proc Natl Acad Sci USA 2001,
98(18):10125-30.
24. Zhang Y, Kolinski A, Skolnick J: TOUCHSTONE II: a new
approach to ab initio protein structure prediction. Biophys J
2003, 85(2):1145-64.
25. Glover F: Tabu Search, PART I. ORSA J Comput 1989, 1:190-206.
26. Glover F: Tabu Search, PART II. ORSA J Comput 1990, 2:4-32.
27. Erkut E: The Discrete P-Dispersion Problem. European Journal
of Operational Research 1990, 46:48-60.
28. Rackovsky S, Scheraga HA: Hydrophobicity, hydrophilicity, and
the radial and orientational distributions of residues in native
proteins. Proc Natl Acad Sci USA 1977, 74(12):5248-51.
29. Yan A, Jernigan RL: How do side chains orient globally in pro-
tein structures? Proteins 2005, 61:513-22.
30. Swendsen RH, Wang JS: Replica Monte Carlo simulation of spin
glasses. PHYSICAL REVIEW LETTERS 1986, 57(21):2607-2609.