Báo cáo sinh học: "A weighted average difference method for detecting differentially expressed genes from microarray data" ppt
Bạn đang xem bản rút gọn của tài liệu. Xem và tải ngay bản đầy đủ của tài liệu tại đây (390.87 KB, 12 trang )
BioMed Central
Page 1 of 12
(page number not for citation purposes)
Algorithms for Molecular Biology
Open Access
Research
A weighted average difference method for detecting differentially
expressed genes from microarray data
Koji Kadota*, Yuji Nakai and Kentaro Shimizu
Address: Graduate School of Agricultural and Life Sciences, The University of Tokyo, 1-1-1 Yayoi, Bunkyo-ku, Tokyo 113-8657, Japan
Email: Koji Kadota* - ; Yuji Nakai - ; Kentaro Shimizu -
* Corresponding author
Abstract
Background: Identification of differentially expressed genes (DEGs) under different experimental
conditions is an important task in many microarray studies. However, choosing which method to
use for a particular application is problematic because its performance depends on the evaluation
metric, the dataset, and so on. In addition, when using the Affymetrix GeneChip
®
system,
researchers must select a preprocessing algorithm from a number of competing algorithms such as
MAS, RMA, and DFW, for obtaining expression-level measurements. To achieve optimal
performance for detecting DEGs, a suitable combination of gene selection method and
preprocessing algorithm needs to be selected for a given probe-level dataset.
Results: We introduce a new fold-change (FC)-based method, the weighted average difference
method (WAD), for ranking DEGs. It uses the average difference and relative average signal
intensity so that highly expressed genes are highly ranked on the average for the different
conditions. The idea is based on our observation that known or potential marker genes (or
proteins) tend to have high expression levels. We compared WAD with seven other methods;
average difference (AD), FC, rank products (RP), moderated t statistic (modT), significance analysis
of microarrays (samT), shrinkage t statistic (shrinkT), and intensity-based moderated t statistic
(ibmT). The evaluation was performed using a total of 38 different binary (two-class) probe-level
datasets: two artificial "spike-in" datasets and 36 real experimental datasets. The results indicate
that WAD outperforms the other methods when sensitivity and specificity are considered
simultaneously: the area under the receiver operating characteristic curve for WAD was the
highest on average for the 38 datasets. The gene ranking for WAD was also the most consistent
when subsets of top-ranked genes produced from three different preprocessed data (MAS, RMA,
and DFW) were compared. Overall, WAD performed the best for MAS-preprocessed data and the
FC-based methods (AD, WAD, FC, or RP) performed well for RMA and DFW-preprocessed data.
Conclusion: WAD is a promising alternative to existing methods for ranking DEGs with two
classes. Its high performance should increase researchers' confidence in microarray analyses.
Background
One of the most common reasons for analyzing microar-
ray data is to identify differentially expressed genes
(DEGs) under two different conditions, such as cancerous
versus normal tissue [1]. Numerous methods have been
proposed for doing this [2-27], and several evaluation
Published: 26 June 2008
Algorithms for Molecular Biology 2008, 3:8 doi:10.1186/1748-7188-3-8
Received: 4 December 2007
Accepted: 26 June 2008
This article is available from: />© 2008 Kadota et al; licensee BioMed Central Ltd.
This is an Open Access article distributed under the terms of the Creative Commons Attribution License ( />),
which permits unrestricted use, distribution, and reproduction in any medium, provided the original work is properly cited.
Algorithms for Molecular Biology 2008, 3:8 />Page 2 of 12
(page number not for citation purposes)
studies have been reported [28-32]. A prevalent approach
to such an analysis is to calculate a statistic (such as the t-
statistic or the fold change) for each gene and to rank the
genes in accordance with the calculated values (e.g., the
method of Tusher et al. [3]). A large absolute value is evi-
dence of a differential expression. Inevitably, different
methods (statistics) generally produce different gene
rankings, and researchers have been troubled about the
differences. Another approach is to rank genes in accord-
ance with their predictive accuracy such as by performing
gene-by-gene prediction [24].
Although the two approaches are not mutually exclusive,
their suitabilities differ; the former approach is better
when the identified DEGs are to be investigated for a fol-
low-up study [24], and the latter is better when a classifier
or predictive model needs to be developed for class pre-
diction [17]. The method presented in this paper focuses
on the former approach – many "wet" researchers want to
rank the true DEGs as high as possible, and the former
approach is more suitable for that purpose.
Methods for ranking genes in accordance with their
degrees of differential expression can be divided into t-sta-
tistic-based methods and fold-change (FC)-based meth-
ods. Both types are commonly used for selecting DEGs
with two classes. They each have certain disadvantages.
The t-statistic-based gene ranking is deficient because a
gene with a small fold change can have a very large statis-
tic for ranking, due to the t-statistic possibly having a very
small denominator [24]. The FC-based ranking is defi-
cient because a gene with larger variances has a higher
probability of having a larger statistic [24]. From our expe-
rience, a disadvantage that they share is that some top-
ranked genes which are falsely detected as "differentially
expressed" tend to exhibit lower expression levels. This
interferes with the chance of detecting the "true" DEGs
because the relative error is higher at lower signal intensi-
ties [4,33-36]. Although many researchers have addressed
this problem, false positives remain to some extent in the
subset of top-ranked genes.
Our weighted average difference (WAD) method was
designed for accurate gene ranking. We evaluated its per-
formance in comparison with those of the average differ-
ence (AD) method, the FC method, the rank products
(RP) method [12,37], the moderated t statistic (modT)
method [9], the significance analysis of microarrays t sta-
tistic (samT) method [3], the shrinkage t statistic
(shrinkT) method [23], and the intensity-based moder-
ated t statistic (ibmT) method [20] by using datasets with
known DEGs (Affymetrix spike-in datasets and datasets
containing experimentally validated DEGs).
Results and discussion
The evaluation was mainly based on the area under the
receiver operating characteristic (ROC) curve (AUC). The
AUC enables comparisons without a trade-off in sensitiv-
ity and specificity because the ROC curve is created by
plotting the true positive (TP) rate (sensitivity) against the
false positive (FP) rate (1 minus the specificity) obtained
at each possible threshold value [38-40]. This is one of the
most important characteristics of a method. The evalua-
tion was performed using 38 different datasets [41-73]
containing true DEGs that enabled us to determine the TP
and FP.
Seven methods were used for comparison: AD was used to
evaluate the effect of the "weight" term in WAD (see the
Methods section), FC was recommended by Shi et al. [74],
RP [12] and modT [9] were recommended by Jeffery et al.
[29], samT [3] is a widely used method, and shrinkT [23]
and ibmT [20] were recently proposed at the time of writ-
ing. All programming was done in R [75] using Biocon-
ductor [76].
Datasets
The evaluation used two publicly available spike-in data-
sets [41,42] (Datasets 1 and 2) and 36 experimental data-
sets that each had some true DEGs confirmed by real-time
polymerase chain reaction (RT-PCR) [43-73] (Dataset 3–
38). The first two datasets are well-chosen sets of data
from other studies [20,23]. Dataset 1 is a subset of the
completely controlled Affymetrix spike-in study done on
the HG-U95A array [41], which contains 12,626
probesets, 12 technical replicates of two different states of
samples, and 16 known DEGs. The details of this experi-
ment are described elsewhere [41]. The subset was
extracted from the original sets by following the recom-
mendations of Opgen-Rhein and Strimmer [23]. Dataset
2 was produced from the Affymetrix HG-U133A array,
which contains 22,300 probesets, three technical repli-
cates of 14 different states of samples, and 42 known
DEGs. Accordingly, there were 91 possible comparisons
(
14
C
2
= 91). Dataset 2 was evaluated on the basis of the
average values of the 91 results.
Since these experiments (using Datasets 1 and 2) were
performed using the Affymetrix GeneChip
®
system, one of
several available preprocessing algorithms (such as
Affymetrix Microarray Suite version 5.0 (MAS) [77],
robust multichip average (RMA) [38], and distribution
free weighted method (DFW) [40]) could be applied to
the probe-level data (.CEL files). We used these three algo-
rithms to preprocess the probe-level data; MAS and RMA
are most often used for this purpose, and DFW is currently
the best algorithm [40]. Of these, DFW is essentially a
summarization method and its original implementation
consists of following steps: no background correction,
Algorithms for Molecular Biology 2008, 3:8 />Page 3 of 12
(page number not for citation purposes)
quantile normalization (same as in RMA), and DFW sum-
marization. The probeset summary scores for Datasets 1
and 2 are publicly available on-line [42]. Accordingly, a
total of six datasets were produced from Datasets 1 and 2,
i.e., Dataset x (MAS), Dataset x (RMA), Dataset x (DFW),
where x = 1 or 2.
Datasets 3–38 were produced from the Affymetrix HG-
U133A array, which is currently the most used platform.
All of the datasets consisted of two different states of sam-
ples (e.g., cancerous vs. non-cancerous) and the number
of samples in each state was > = 3. Each dataset had two
or more true DEGs and these DEGs were originally
detected on MAS- or RMA-preprocessed data. The raw
(probe-level) data are also publicly available from the
Gene Expression Omnibus (GEO) website [78]. One can
preprocess the raw data using the MAS, RMA, and DFW
algorithms. Detailed information on these datasets is
given in the additional file [see Additional file 1].
Evaluation using spike-in datasets (Datasets 1 and 2)
The AUC values for the eight methods for Datasets 1 and
2 are shown in Table 1. Overall, WAD outperformed the
other methods. It performed the best for five of the six
datasets and ranked no lower than fourth best for all data-
sets. RP performed the best for Dataset 2 (RMA). The R-
codes for analyzing these datasets are available in the
additional files [see Additional files 2 and 3].
The largest difference between WAD and the other meth-
ods was observed for Dataset 1 (MAS). Because MAS uses
local background subtraction, MAS-preprocessed data
tend to have extreme variances at low intensities. As
shown in Table 2, increasing the floor values for the MAS-
preprocessed data increased the AUC values for all meth-
ods except WAD. Nevertheless, the AUC values for WAD
at the four intensity thresholds were clearly higher than
those for the other methods. These results indicate that
the advantage of WAD over the other methods is not
merely due to a defect in the MAS algorithm.
The basic assumption of WAD is that "strong signals are
better signals." This assumption may unfairly favorable
when spike-in datasets are used for evaluation. One can
only spike mRNA at rather high concentrations because of
technical limitations such as mRNA stability and pipetting
accuracy, meaning that spike-in transcripts tend to have
strong signals [79]. The basic assumption is therefore nec-
essarily true for spike-in data. Indeed, a statistic based on
the relative average signal intensity (e.g., a statistic based
on the "weight" term, w, in the WAD statistic; see Meth-
ods) for Dataset 1 (MAS) could, for example, give a very
high AUC value of 90.0%. We also observed high AUC
values based on the w statistic for the RMA- (87.3% of
AUC) and DFW-preprocessed data (80.4%).
Evaluation using experimental datasets (Datasets 3–38)
Nevertheless, we have seen that several well-known
marker genes and experimentally validated DEGs tend to
have strong signals, which supports our basic assumption.
Table 1: AUC (percent) values for Datasets 1 and 2 for eight methods
MAS RMA DFW
Method Dataset 1 Dataset 2 Dataset 1 Dataset 2 Dataset 1 Dataset 2
WAD 96.772(1) 97.684(1) 99.980(1) 98.240(4) 100.00(1) 99.953(1)
AD 83.381(6) 96.430(8) 99.897(6) 98.631(2) 100.00(1) 99.948(2)
FC 83.092(7) 96.445(7) 99.655(8) 98.617(3) 100.00(1) 99.948(2)
RP 81.981(8) 96.626(6) 99.757(7) 99.161(1) 99.993(4) 99.938(3)
modT 93.257(4) 97.561(4) 99.928(5) 98.109(7) 99.983(7) 98.459(6)
samT 94.002(3) 97.547(5) 99.944(3) 98.139(6) 99.988(5) 98.656(4)
shrinkT 92.379(5) 97.617(3) 99.955(2) 97.846(8) 99.984(6) 98.558(5)
ibmT 94.693(2) 97.618(2) 99.941(4) 98.183(5) 99.983(7) 98.455(7)
Numbers in parentheses show the rankings. Signal intensities smaller than 1 in the MAS-preprocessed data were set to 1 so that the logarithm of
the data could be taken.
Table 2: AUC (percent) values for Dataset 1 (MAS) for different
signal intensity thresholds
Signal intensity threshold
Method 1 5 10 15
WAD 96.772(1) 99.052(1) 99.228(1) 98.506(1)
AD 83.381(6) 89.215(6) 92.996(7) 94.915(6)
FC 83.092(7) 88.353(8) 92.381(8) 94.455(7)
RP 81.981(8) 88.516(7) 93.131(6) 95.456(5)
modT 93.257(4) 94.776(2) 95.284(3) 95.977(4)
samT 94.002(3) 94.731(4) 95.074(5) 96.028(3)
shrinkT 92.379(5) 94.114(5) 95.537(2) 96.437(2)
ibmT 94.693(2) 94.770(3) 95.260(4) 94.318(8)
AUC values when floor signal values in MAS-preprocessed data were
1, 5, 10, and 15, corresponding to substitutions of 4.1, 24.7, 40.2, and
50.8% of signals.
Algorithms for Molecular Biology 2008, 3:8 />Page 4 of 12
(page number not for citation purposes)
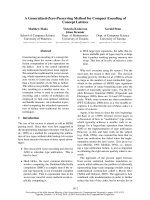
If there is no correlation between differential expression
and expression level, the AUC value based on the w statis-
tic should be approximately 0.5. Actually, of the 36 exper-
imental datasets, 34 had AUC values > 0.5 when the w
statistic was used (Figure 1, light blue circle) and the aver-
age AUC value was high (72.7%). These results demon-
strate the validity of our assumption.
This high AUC value may not be due to the microarray
technology because any technology is unreliable at the
low intensity/expression end. Inevitably, genes that can be
confirmed as DEGs using a particular technology tend to
have high signal intensity. That is, it is difficult to confirm
candidate genes having low signal intensity [48,80].
Whether a candidate is a true DEG must ultimately be
decided subjectively. Therefore, many candidates having
low signal intensity should not be considered true DEGs.
Apart from the above discussion, a good method should
produce high AUC values for real experimental datasets.
The analysis of Datasets 3–38 showed that the average
AUC value for WAD (96.737%) was the highest of the
eight methods when the preprocessing algorithms were
selected following the original studies (Table 3). WAD
performed the best for 12 of the 36 experimental datasets.
The 36 experimental datasets can be divided into two
groups: One group (Datasets 3–26) had originally been
analyzed using MAS-preprocessed data and the other
(Datasets 27–38) had originally been analyzed using
RMA-preprocessed data. Table 4 shows the average AUC
values for MAS-, RMA-, and DFW-preprocessed data for
the two groups (Datasets 3–26 and Datasets 27–38). The
values for the MAS- (RMA-) preprocessed data for the first
Effect of the weight (w) term in WAD statistic for 36 real experimental datasets (Datasets 3–38)Figure 1
Effect of the weight (w) term in WAD statistic for 36 real experimental datasets (Datasets 3–38). AUC values for
the weight term (w, light blue circle) in WAD, AD (black circle), and WAD (red circle) are shown. Analyses of Datasets 3–26
and Datasets 27–38 were performed using MAS- and RMA-preprocessed data, respectively, following the choice of preproc-
essing algorithm in the original papers. The average AUC values for their respective methods as well as the other methods are
shown in Table 3. Note that WAD statistics (AD with the w term) can overall give higher AUC values than AD statistics.
Table 3: Results for Dataset 3–38 using eight methods
Method Average AUC (%) No. of datasets best performed
WAD 96.737 12
AD 94.758 1
FC 94.659 4
RP 93.182 2
modT 95.541 1
samT 95.866 7
shrinkT 95.439 4
ibmT 96.060 5
Analyses of Datasets 3–26 and Datasets 27–38 were performed using
MAS- and RMA-preprocessed data, respectively, following the choice
of preprocessing algorithm in the original papers. Accordingly, the
average AUC value was calculated from those for Datasets 3–26
(MAS) and Datasets 27–38 (RMA). The best performing methods for
each dataset is given in the additional file [see Additional file 1].
Algorithms for Molecular Biology 2008, 3:8 />Page 5 of 12
(page number not for citation purposes)
(second) group were overall the best among the three pre-
processing algorithms. This is reasonable because the best
performing algorithms were practically used in the origi-
nal papers [43-73]. The exception was for RP [12] in the
first group: the average AUC values for RMA- (92.540) and
DFW-preprocessed data (92.534) were higher than the
value for MAS-preprocessed data (91.511).
Interestingly, the FC-based methods (AD, WAD, FC, and
RP) were generally superior to the t-statistic-based meth-
ods (modT, samT, shrinkT, and ibmT) when RMA- or
DFW-preprocessed data were analyzed. This is probably
because the RMA and DFW algorithms simultaneously
preprocess data across a set of arrays to improve the preci-
sion of the final measures of expression [81] and include
a variance stabilization step [38,40]. Accordingly, some
variance estimation strategies employed in the t-statistic-
based methods may be no longer necessary for such pre-
processed data. Indeed, the t-statistic-based methods were
clearly superior to the FC-based methods (except WAD)
when the MAS-preprocessed data were analyzed: The MAS
algorithm considers data on a per-array basis [77] and has
been criticized for its exaggerated variance at low intensi-
ties [82].
It should be noted that we cannot compare the three pre-
processing algorithms with the results from the 36 real
experimental datasets. One might think the RMA algo-
rithm is the best among the three algorithms because (1)
the average AUC values for the RMA (the average is
91.978) were higher than those for DFW (91.274) in the
results for Datasets 3–26 and (2) the average AUC values
for DFW (93.465) were also higher than those for MAS
(89.587) in the results for Datasets 27–38 (Table 4). How-
ever, the lower average AUC values for DFW compared
with the RMA in the results for Datasets 3–26 were mainly
due to the poor affinity between the t-statistic-based
methods and the DFW algorithm. The average AUC values
for DFW were quite similar to those for RMA only when
the FC-based methods were compared. In addition, the
higher average AUC values for DFW (93.465) than for
MAS in the results for Datasets 27–38 were rather by virtue
of the similarity of data processing to RMA: DFW employs
the same background correction and normalization pro-
cedures as RMA, and the only difference between the two
algorithms is in their summarization procedure.
It should also be noted that there must be many addi-
tional DEGs in the 36 experimental datasets because the
RT-PCR validation is performed only for a subset of top-
ranked genes. Accordingly, we cannot compare the eight
methods by using other evaluation metrics such as the
false discovery rate (FDR) [83] or compare their abilities
of identifying new genes that might have been missed in
a previous analysis. Such comparisons could also produce
different results with different parameters such as number
of top ranked genes or different gene ranking methods
used in the original study. For example, the FC-based
methods (AD, WAD, FC, and RP) and the t-statistic-based
methods (modT, samT, shrinkT, and ibmT) produce
clearly dissimilar gene lists (see Table 5). This difference
suggests that the FC-based methods should be advanta-
geous for six datasets (Datasets 3–6 and 27–28) whose
gene rankings were originally performed with only the FC-
based methods. Likewise, the t-statistic-based methods
should be advantageous for 15 datasets (Datasets 19–26
and 32–38). The RT-PCR validation for a subset of poten-
tial DEGs were based on those gene ranking results.
Indeed, the average rank (3.92) of AUC values for the FC-
based methods on the six datasets and for the t-statistic-
based methods on the 15 datasets was clearly higher than
that (5.08) for the t-statistic-based methods on the six
datasets and for the FC-based methods on the 15 datasets
(p-value = 0.001, Mann-Whitney U test). This implies a
Table 4: Average AUC values for Datasets 3–26 and 27–38
Datasets 3–26 Datasets 27–38
Method MAS RMA DFW MAS RMA DFW Average
WAD 96.740(1) 91.373(6) 91.407(5) 92.416(1) 96.732(2) 94.090(4) 93.793
AD 93.755(6) 93.098(2) 92.239(2) 87.411(7) 96.766(1) 94.222(2) 92.915
FC 93.625(7) 93.117(1) 92.239(2) 88.230(6) 96.726(3) 94.221(3) 93.026
RP 91.511(8) 92.540(3) 92.534(1) 84.552(8) 96.526(4) 94.665(1) 92.055
modT 95.673(5) 91.381(5) 90.109(7) 90.895(4) 95.277(7) 92.355(7) 92.615
samT 95.947(3) 91.231(8) 89.959(8) 90.305(5) 95.702(5) 92.052(8) 92.533
shrinkT 95.733(4) 91.316(7) 91.451(4) 90.968(3) 94.851(8) 93.684(5) 93.001
ibmT 96.344(2) 91.771(4) 90.252(6) 91.921(2) 95.491(6) 92.427(6) 93.034
Average 94.916 91.978 91.274 89.587 96.009 93.465
Analyses of Datasets 3–26 and Datasets 27–38 were performed using MAS- and RMA-preprocessed data, respectively, following the choice of
preprocessing algorithm in the original papers.
Algorithms for Molecular Biology 2008, 3:8 />Page 6 of 12
(page number not for citation purposes)
comparison using a total of the 21 datasets (Datasets 3–6,
19–28, and 32–38) should give an advantageous result for
the t-statistic-based methods since those methods were
used in the original analysis for 15 of the 21 datasets. Nev-
ertheless, the best performing methods across the 36
experimental datasets including the 21 datasets seem to
be independent of the originally analyzed methods, by
virtue of WAD's high performance. Also, the overall per-
formances of eight methods for the two artificial spike-in
datasets (Datasets 1 and 2) and for the 36 real experimen-
tal datasets (Datasets 3–38) were quite similar (Tables 1
and 4). These results suggest that the use of genes only val-
idated by RT-PCR as DEGs does not affect the objective
evaluations of the methods.
To our knowledge, the number (32) of real experimental
datasets we analyzed is much larger than those analyzed
by previous methodological studies: Two experimental
datasets were evaluated for the ibmT [20] method and one
was for the shrinkT [23] method. Although those studies
performed a profound analysis on a few datasets, we think
a superficial comparison on a large number of experimen-
tal datasets is more important than a profound one on a
few experimental datasets when estimating the methods'
practical ability to detect DEGs, as the superficial compar-
ison on a large number of datasets can also prevent selec-
tion bias regarding the datasets. Therefore, we think the
number of experimental datasets interrogated is also very
important for evaluating the practical advantages of the
existing methods. A profound comparison on a large
number of experimental datasets should be of course the
most important. For example, a comparison of significant
Gene Ontology [84] categories using top-ranked genes
from each of the eight methods would be interesting. We
think such a comparison would be important as another
reasonable assessment of whether some top-ranked genes
detected only by WAD might actually be differentially
expressed. The analysis of many datasets is however prac-
tically difficult because of wide range of knowledge it
would require, and this related to the next task.
Effect of different preprocessing algorithms on gene
ranking
In general, different choices of preprocessing algorithms
can output different subsets of top-ranked genes (e.g., see
Tables 1 and 4) [85]. We compared the gene rankings of
MAS-, RMA-, and DFW-preprocessed data. Table 6 shows
the average number of common genes in 20, 50, 100, and
200 top-ranked genes for the 36 experimental datasets.
Although all methods output relatively low numbers of
common genes, the numbers for WAD were consistently
higher than those for the other methods. This result indi-
cates the gene ranking based on WAD is more robust
against data processing than the other methods are.
From the comparison of WAD and AD, it is obvious that
the high rank-invariant property of WAD is by virtue of
the inclusion of the weight term: The gene ranking based
on the w statistic is much more reproducible than the one
based on the AD statistic. Relatively small numbers of
common genes were observed for the other FC-based
methods (AD, FC, and RP) (Table 6). This was because
differences in top-ranked genes between MAS and RMA
(or DFW) were much larger than those between RMA and
DFW (data not shown).
Effect of outliers on the weight term in WAD statistic
Recall that the WAD statistic is composed of the AD statis-
tic and the weight (w) term (see the Methods section).
Some researchers may be suspicious about the use of w
because it is calculated from a sample mean (i.e., ) for
gene i, and sample means are notoriously sensitive to out-
liers in the data. Actually, the w term is calculated from
logged data and is therefore insensitive to outliers. Indeed,
we observed few outliers in two datasets (there were 31
outliers in Dataset 14 and 7 outliers in Dataset 29; they
x
i
Table 5: Average number of genes common to each pair of
methods for Datasets 3–38
(a) MAS AD FC RP modT samT shrinkT ibmT
WAD 52.0 39.1 49.7 37.7 45.2 39.8 42.8
AD 61.9 84.1 34.4 47.1 37.2 33.2
FC 58.2 29.5 39.1 31.2 28.1
RP 30.5 41.8 32.4 29.8
modT 79.9 92.7 78.1
samT 83.5 65.0
shrinkT 74.8
(b) RMA AD FC RP modT samT shrinkT ibmT
WAD 62.2 50.4 60.2 31.7 32.6 30.8 33.4
AD 78.8 84.7 35.2 36.2 33.9 38.0
FC 72.3 32.2 32.8 30.8 34.5
RP 36.8 37.6 35.4 39.4
modT 88.3 93.0 88.4
samT 87.6 83.6
shrinkT 85.1
(c) DFW AD FC RP modT samT shrinkT ibmT
WAD 84.3 83.9 72.1 13.6 13.4 14.6 13.9
AD 98.6 77.3 13.7 13.5 14.7 14.0
FC 77.0 13.6 13.4 14.6 13.9
RP 18.1 17.9 20.1 18.8
modT 94.1 83.2 93.4
samT 81.1 91.0
shrinkT 83.0
The averages were calculated from top 100 genes. Due to the
symmetric nature of the matrix only the upper triangular part is
presented.
Algorithms for Molecular Biology 2008, 3:8 />Page 7 of 12
(page number not for citation purposes)
corresponded to (31 + 7)/(22,283 clones × 36 datasets) =
0.0047%) when an outlier detection method based on
Akaike's Information Criterion (AIC) [85-87] was applied
to the average expression vector calculated
from each of the 36 datasets. In addition to the automatic
detection of outliers, we also visually examined the distri-
bution of the average vectors and concluded there were no
outliers. Also, the differences in the AUC values between
AD and WAD were less than 0.1% for the two datasets
(Datasets 14 and 29). We therefore decided that all the
automatically detected outliers did not affect the result.
The average expression vectors and the results of outlier
detection using the AIC-based method are available in the
additional files [see Additional files 4 and 5].
Choice of best methods with preprocessing algorithms
In this study, we analyzed eight gene-ranking methods
with three preprocessing algorithms. Currently, there is no
convincing rationale for choosing among different pre-
processing algorithms. Although the three algorithms
from best to worst were DFW, RMA, and MAS when artifi-
cial spike-in datasets (Datasets 1 and 2) were evaluated
using the AUC metric with the eight methods (Table 1),
their performance might not be generalizable in practice
[79]. Indeed, a recent study reported the utility of MAS
[82]. Also, a shared disadvantage of RMA and DFW is that
the probeset intensities change when microarrays are re-
preprocessed because of the inclusion of additional
arrays, but modification strategies to deal with it have
only been developed for RMA [81,88,89]. We therefore
discuss the best methods for each preprocessing algo-
rithm.
For MAS users, we think WAD is the most promising
method because it gave good results for both types of
dataset (artificial spike-in and real experimental datasets,
see Tables 1, 2, and 4). The second best was ibmT [20].
Although there was no a statistically significant difference
between the 36 AUC values for WAD from the real exper-
imental datasets and those for the second best method
(ibmT) (one-tail p-value = 0.18, paired t-test; see Table
7a), it is natural that one should select the best performing
method for a number of real datasets.
For RMA users, FC-based methods can be recommended.
Although these methods (except WAD) were inferior to
the t-statistic-based methods when the results for the
older spike-in dataset (Dataset 1, which is obtained from
the HG-U95A array) were compared, they were better for
both the newer spike-in dataset (Dataset 2, which is from
the HG-U133A array) and the 36 real experimental data-
sets (Datasets 3–38, which is also from the HG-U133A
array). We think that the results for the real experimental
datasets (or a newer platform) should take precedence
over the results for the artificial datasets (or an older plat-
form). AD or FC may be the best since they are the best for
the 36 real datasets (see Tables 4 and 7b).
For DFW users, RP can be recommended since it was the
best for the 36 real experimental datasets (see Tables 4 and
7c). However, the use of RP for analyzing large numbers
of arrays can be sometimes limited by available computer
memory. The other FC-based methods can be recom-
mended for such a situation.
The variance estimation is much more challenging when
the number of replicates is small [29]. This suggests that
the FC-based methods including WAD tend to be more
powerful (or less powerful) than the t-statistic-based
methods if the number of replicates is small (or large). We
found that WAD was the best for some datasets which
contain large (> 10) replicates (e.g., Datasets 5, 7, and 26)
while FC and RP tended to perform the best on datasets
with relatively small replicates (e.g., Datasets 34 and 10,
whose numbers of replicates in one class were smaller
than 6) [see Additional file 1]. These results suggest that
WAD can perform well across a range of replicate num-
bers.
It is important to mention that there are other preprocess-
ing algorithms such as FARMS [39] and SuperNorm [90].
FARMS considers data on a multi-array basis as does RMA
and DFW, while SuperNorm considers data on a per-array
basis as does MAS. Although the FC-based methods were
superior to the t-statistic-based methods, the latter meth-
ods might perform well for FARMS- or SuperNorm-pre-
processed data. The evaluation of competing methods for
these preprocessing algorithms will be our next task.
In practice, one may want to detect the DEGs from gene
expression data, produced from a comparison of two or
more classes (or time points), and the current method
does not analyze these DEGs. A simple way to deal with
them is to use and
( , , )xx
p1
AD i x x
i
q
i
q
() max( ) min( )=−
Table 6: Average number of common genes in results of three
preprocessing algorithms for Datasets 3–38
Method Top 20 Top 50 Top 100 Top 200
WAD 8.2 19.8 38.0 73.1
AD 4.5 10.7 20.0 37.9
FC 5.0 12.2 22.0 40.6
RP 4.6 11.1 20.6 40.5
modT 4.4 13.1 27.6 60.3
samT 4.0 11.9 24.4 52.4
shrinkT 4.5 13.6 29.0 62.4
ibmT 5.3 15.2 32.0 66.7
Algorithms for Molecular Biology 2008, 3:8 />Page 8 of 12
(page number not for citation purposes)
in WAD for the q class problem (q = 1, 2,
3, ) (see the Methods section for details). Of course,
there are many possible ways to analyze these DEGs. Fur-
ther work is needed to make WAD universal.
Conclusion
We proposed a new method (called WAD) for ranking dif-
ferentially expressed genes (DEGs) from gene expression
data, especially obtained by Affymetrix GeneChip
®
tech-
nology. The basic assumption for WAD was that strong
signals are better signals. We demonstrated that known or
potential marker genes had high expression levels on aver-
age in 34 of the 36 real experimental datasets and applied
our idea as the weight term in the WAD statistic.
Overall, WAD was more powerful than the other methods
in terms of the area under the receiver operating character-
istic curve. WAD also gave consistent results for different
preprocessing algorithms. Its performance was verified
using a total of 38 artificial spike-in datasets and real
experimental datasets. Given its excellent performance,
we believe that WAD should become one of the methods
used for analyzing microarray data.
xmeanx
i
i
q
= ()
Table 7: Statistical significance between two methods for Datasets 3–38
a) MAS Inferior
WAD AD FC RP modT samT shrinkT ibmT
Superior WAD - 2.1E-07 6.7E-07 2.3E-06 2.2E-02 1.7E-02 2.0E-02 1.8E-01
AD 1.0E+00 - 8.1E-01 2.9E-04 1.0E+00 1.0E+00 1.0E+00 1.0E+00
FC 1.0E+00 1.9E-01 - 2.6E-04 1.0E+00 1.0E+00 1.0E+00 1.0E+00
RP 1.0E+00 1.0E+00 1.0E+00 - 1.0E+00 1.0E+00 1.0E+00 1.0E+00
modT 9.8E-01 8.6E-04 4.0E-03 1.4E-04 - 4.7E-01 9.0E-01 1.0E+00
samT 9.8E-01 2.5E-04 2.0E-03 6.6E-05 5.3E-01 - 6.9E-01 1.0E+00
shrinkT 9.8E-01 4.0E-04 2.2E-03 9.0E-05 1.0E-01 3.1E-01 - 1.0E+00
ibmT 8.2E-01 4.7E-05 2.6E-04 2.6E-05 2.2E-04 2.3E-03 2.9E-04 -
(b) RMA Inferior
WAD AD FC RP modT samT shrinkT ibmT
Superior WAD - 9.8E-01 9.8E-01 8.9E-01 3.0E-01 3.1E-01 2.5E-01 4.4E-01
AD 2.3E-02 - 4.7E-01 8.3E-02 9.2E-03 1.1E-02 7.2E-03 2.8E-02
FC 2.4E-02 5.3E-01 - 8.8E-02 1.1E-02 1.3E-02 8.4E-03 3.1E-02
RP 1.1E-01 9.2E-01 9.1E-01 - 8.4E-02 9.7E-02 6.6E-02 1.7E-01
modT 7.0E-01 9.9E-01 9.9E-01 9.2E-01 - 5.6E-01 6.5E-02 1.0E+00
samT 6.9E-01 9.9E-01 9.9E-01 9.0E-01 4.4E-01 - 2.1E-01 8.3E-01
shrinkT 7.5E-01 9.9E-01 9.9E-01 9.3E-01 9.4E-01 7.9E-01 - 1.0E+00
ibmT 5.6E-01 9.7E-01 9.7E-01 8.3E-01 3.2E-03 1.7E-01 1.9E-03 -
(c) DFW Inferior
WAD AD FC RP modT samT shrinkT ibmT
Superior WAD - 1.0E+00 1.0E+00 1.0E+00 1.3E-01 1.2E-01 4.5E-01 1.6E-01
AD 2.5E-03 - 1.6E-01 9.6E-01 5.1E-02 4.7E-02 2.1E-01 6.9E-02
FC 2.6E-03 8.4E-01 - 9.6E-01 5.1E-02 4.7E-02 2.1E-01 6.9E-02
RP 8.7E-04 4.2E-02 4.1E-02 - 3.0E-02 3.0E-02 1.1E-01 4.4E-02
modT 8.7E-01 9.5E-01 9.5E-01 9.7E-01 - 8.6E-02 9.9E-01 8.5E-01
samT 8.8E-01 9.5E-01 9.5E-01 9.7E-01 9.1E-01 - 9.9E-01 1.0E+00
shrinkT 5.5E-01 7.9E-01 7.9E-01 8.9E-01 6.1E-03 1.0E-02 - 2.6E-02
ibmT 8.4E-01 9.3E-01 9.3E-01 9.6E-01 1.5E-01 5.2E-04 9.7E-01 -
The p-values between the 36 AUC values from a possibly superior method and those from a possibly inferior method were calculated by a one-tail
paired t-test. The null hypothesis is that the mean of the 36 AUC values for one method is the same as that for the other method. There are two
p-values for two methods compared. For example, in (a) MAS-preprocessed data, the p-value is 1.8E-01 when the alternative hypothesis is that the
mean of the 36 AUC values for WAD is greater than that for ibmT while the p-value is 8.2E-01 when the alternative hypothesis is that the mean of
the 36 AUC values for ibmT is greater than that for WAD. Combinations having p < 0.05 are highlighted in bold.
Algorithms for Molecular Biology 2008, 3:8 />Page 9 of 12
(page number not for citation purposes)
Methods
Microarray data
The processed data (MAS-, RMA-, and DFW-preprocessed
data) for Datasets 1 and 2 were downloaded from the
Affycomp II website [42]. The raw (probe level) data for
Dataset 3–38 were obtained from the Gene Expression
Omnibus (GEO) website [78]. All analyses were per-
formed using log
2
-transformed data except for the FC
analysis. In Datasets 3–38, the 'true' DEGs were defined as
those differential expressions that had been confirmed by
real-time polymerase chain reaction (RT-PCR). For exam-
ple, we defined 16 probesets (corresponding to 15 genes)
of 20 candidates as DEGs in Dataset 9 [48] because the
remaining four probesets (or genes) showed incompati-
ble expression patterns between RT-PCR and the microar-
ray. For reproducibility, detailed information on these
datasets is given in the additional file [see Additional file
1].
Weighted Average Difference (WAD) method
Consider a gene expression matrix consisting of p genes
and n arrays, produced from a comparison between
classes A and B. The average difference ( ),
defined here as the average log signal for all class B repli-
cates ( ) minus the average log signal for all class A rep-
licates ( ), is an obvious indicator for estimating the
differential expression of the ith gene, .
Some of the top-ranked genes from the simple statistic,
however, tend to exhibit lower expression levels. This is
not good because the signal-to-noise ratio decreases with
the gene expression level [3] and because known DEGs
tend to have high expression levels.
To account for these observations, we use relative average
log signal intensity w
i
for weighting the average difference
in x
i
.
where is calculated as , and the max (or
min) indicates the maximum (or minimum) value in an
average expression vector on a log scale.
The WAD statistic for the ith gene, WAD(i), is calculated
simply as
WAD(i) = AD
i
× w
i
.
The basic assumption for our approach to the gene rank-
ing problem is that ''strong signals are better signals'' [36].
The WAD statistic is a straightforward application of this
idea. The R-source codes for analyzing Datasets 1 and 2
are available in additional files [see Additional files 2 and
3].
Fold change (FC) method
The FC statistic for the ith gene, FC(i), was calculated as
the average non-log signal for all class B replicates divided
by the average non-log signal for all class A replicates. The
ranking for selecting DEGs was performed using the log of
FC(i).
Rank products (RP) method
The RP method is an FC-based method. The RP statistic
was calculated using the RP() function in the "RankProd"
library [37] in R [75] and Bioconductor [76].
Moderated t-statistic (modT) method
The modT method is an empirical Bayes modification of
the t-test [9]. The modT statistic was calculated using the
modt.stat() function in the "st" library [23] in R [75].
Significance analysis of microarrays (samT) method
The samT method is a modification of the t-test [3], and it
works by adding a small value to the denominator of the
t statistic. The samT statistic was calculated using the
sam.stat() function in the "st" library [23] in R [75].
Shrinkage t-statistic (shrinkT) method
The shrinkT method is a quasi-empirical Bayes modifica-
tion of the t-test [23]. The shrinkT statistic was calculated
using the shrinkt.stat() function in the "st" library [23] in
R [75].
Intensity-based moderated t-statistic (ibmT) method
The ibmT method is a modified version of the modT
method [20]. The ibmT statistic was calculated using the
IBMT() function, available on-line [91].
Abbreviations
AUC: area under ROC curve; DEG: differentially expressed
gene; DFW: distribution-free weighted (method); FC: fold
change; FP: false positive; ibmT: intensity-based moder-
ated t-statistic; MAS: (Affymetrix) MicroArray Suite ver-
sion 5; modT: moderated t-statistic; RMA: robust multi-
chip average; ROC: receiver operating characteristic; RP:
rank products; samT: significance analysis of microarrays;
shrinkT: shrinkage t-statistic; TP: true positive; WAD:
weighted average difference (method)
Authors' contributions
KK developed the method and wrote the paper, YN and KS
provided critical comments and led the project.
AD x x
ii
B
i
A
=−
x
i
B
x
i
A
x
ii i
n
xx= ( , , )
1
w
x
i
min
max min
i
=
−
−
,
x
i
()/xx
i
A
i
B
+ 2
( , , )xx
p1
Algorithms for Molecular Biology 2008, 3:8 />Page 10 of 12
(page number not for citation purposes)
Additional material
Acknowledgements
This study was supported by Special Coordination Funds for Promoting Sci-
ence and Technology and by KAKENHI (19700273) to KK from the Japa-
nese Ministry of Education, Culture, Sports, Science and Technology
(MEXT).
References
1. Feten G, Aastveit AH, Snipen L, Almoy T: A discussion concerning
the inclusion of variety effect when analysis of variance is
used to detect differentially expressed genes. Gene Regulation
Systems Biol 2007, 1:43-47.
2. Kerr MK, Martin M, Churchill GA: Analysis of variance for gene
expression microarray data. J Comput Biol 2000, 7:819-837.
3. Tusher VG, Tibshirani R, Chu G: Significance analysis of micro-
arrays applied to the ionizing radiation response. Proc Natl
Acad Sci USA 2001, 98(9):5116-5121.
4. Baldi P, Long AD: A Bayesian framework for the analysis of
microarray expression data: regularized t-test and statistical
inference of gene changes. Bioinformatics 2001, 17:509-519.
5. Li L, Weinberg C, Darden T, Pedersen L: Gene selection for sam-
ple classification based on gene expression data: study of sen-
sitivity to choice of parameters of the GA/KNN method.
Bioinformatics 2001, 17:1131-1142.
6. Pavlidis P, Noble WS: Analysis of strain and regional variation
in gene expression in mouse brain. Genome Biol 2001,
2(10):RESEARCH0042.
7. Efron B, Tibshirani R: Empirical bayes methods and false discov-
ery rates for microarrays. Genet Epidemiol 2002, 23(1):70-86.
8. Parodi S, Muselli M, Fontana V, Bonassi S: ROC curves are a suita-
ble and flexible tool for the analysis of gene expression pro-
files. Cytogenet Genome Res 2003, 101(1):90-91.
9. Smyth GK: Linear models and empirical bayes methods for
assessing differential expression in microarray experiments.
Stat Appl Genet Mol Biol 2004, 3(1):Article 3.
10. Martin DE, Demougin P, Hall MN, Bellis M: Rank Difference Anal-
ysis of Microarrays (RDAM), a novel approach to statistical
analysis of microarray expression profiling data. BMC Bioinfor-
matics 2004, 5:148.
11. Cho JH, Lee D, Park JH, Lee IB: Gene selection and classification
from microarray data using kernel machine. FEBS Lett 2004,
571:93-98.
12. Breitling R, Armengaud P, Amtmann A, Herzyk P:
Rank products: a
simple, yet powerful, new method to detect differentially
regulated genes in replicated microarray experiments. FEBS
Lett 2004, 573(1–3):83-92.
13. Breitling R, Herzyk P: Rank-based methods as a non-parametric
alternative of the T-statistic for the analysis of biological
microarray data. J Bioinform Comput Biol 2005, 3(5):1171-1189.
14. Yang YH, Xiao Y, Segal MR: Identifying differentially expressed
genes from microarray experiments via statistic synthesis.
Bioinformatics 2005, 21(7):1084-1093.
15. Smyth GK, Michaud J, Scott HS: Use of within-array replicate
spots for assessing differential expression in microarray
experiments. Bioinformatics 2005, 21(9):2067-2075.
16. Hein AM, Richardson S: A powerful method for detecting differ-
entially expressed genes from GeneChip arrays that does
not require replicates. BMC Bioinformatics 2006, 7:353.
17. Baker SG, Kramer BS: Identifying genes that contribute most to
good classification in microarrays. BMC Bioinformatics 2006,
7:407.
18. Lewin A, Richardson S, Marshall C, Glazier A, Aitman T: Bayesian
modeling of differential gene expression. Biometrics 2006,
62(1):1-9.
19. Gottardo R, Raftery AE, Yeung KY, Bumgarner RE: Bayesian robust
inference for differential gene expression in microarrays
with multiple samples. Biometrics 2006, 62(1):10-18.
20. Sartor MA, Tomlinson CR, Wesselkamper SC, Sivaganesan S, Leikauf
GD, Medvedovic M: Intensity-based hierarchical Bayes method
improves testing for differentially expressed genes in micro-
array experiments. BMC Bioinformatics 2006, 7:538.
21. Zhang : An improved nonparametric approach for detecting
differentially expressed genes with replicated microarray
data. Stat Appl Genet Mol Biol 2006, 5:Article 30.
22. Hess A, Iyer H: Fisher's combined p-value for detecting differ-
entially expressed genes using Affymetrix expression arrays.
BMC Genomics 2007,
8:96.
23. Opgen-Rhein R, Strimmer K: Accurate ranking of differentially
expressed genes by a distribution-free shrinkage approach.
Stat Appl Genet Mol Biol 2007, 6:Article 9.
24. Chen JJ, Tsai CA, Tzeng S, Chen CH: Gene selection with multi-
ple ordering criteria. BMC Bioinformatics 2007, 8:74.
25. Lo K, Gottardo R: Flexible empirical Bayes models for differ-
ential gene expression. Bioinformatics 2007, 23(3):328-335.
26. Yousef M, Jung S, Showe LC, Showe MK: Recursive cluster elimi-
nation (RCE) for classification and feature selection from
gene expression data. BMC Bioinformatics 2007, 8:144.
27. Gusnanto A, Tom B, Burns P, Macaulay I, Thijssen-Timmer DC, Tijs-
sen MR, Langford C, Watkins N, Ouwehand W, Berzuini C, Dud-
bridge F: Improving the power to detect differentially
expressed genes in comparative microarray experiments by
including information from self-self hybridizations. Comput
Biol Chem 2007, 31(3):178-185.
28. Pan W: A comparative review of statistical methods for dis-
covering differentially expressed genes in replicated micro-
array experiments. Bioinformatics 2002, 18(4):546-554.
Additional file 1
Detailed information for Datasets 3–38.
Click here for file
[ />7188-3-8-S1.doc]
Additional file 2
R-code for analyzing Dataset 1.
Click here for file
[ />7188-3-8-S2.txt]
Additional file 3
R-code for analyzing Dataset 2.
Click here for file
[ />7188-3-8-S3.txt]
Additional file 4
Average expression vectors and the results of outlier detection for Datasets
3–26. Sheet 1: Average expression vectors are provided. Sheet 2: For each
of the original average expression vectors, an outlier vector (consisting of
1 for over-expressed outliers, -1 for under-expressed outliers, and 0 for
non-outliers) is provided. This sheet does not contain "-1".
Click here for file
[ />7188-3-8-S4.xls]
Additional file 5
Average expression vectors and the results of outlier detection for Datasets
27–38. Sheet 1: Average expression vectors are provided. Sheet 2: For
each of the original average expression vectors, an outlier vector (consist-
ing of 1 for over-expressed outliers, -1 for under-expressed outliers, and 0
for non-outliers) is provided. This sheet does not contain "-1".
Click here for file
[ />7188-3-8-S5.xls]
Algorithms for Molecular Biology 2008, 3:8 />Page 11 of 12
(page number not for citation purposes)
29. Jeffery IB, Higgins DG, Culhane AC: Comparison and evaluation
of methods for generating differentially expressed gene lists
from microarray data. BMC Bioinformatics 2006, 7:359.
30. Yang K, Li J, Gao H: The impact of sample imbalance on iden-
tifying differentially expressed genes. BMC Bioinformatics 2006,
7(Suppl 4):S8.
31. Perelman E, Ploner A, Calza S, Pawitan Y: Detecting differential
expression in microarray data: comparison of optimal proce-
dures. BMC Bioinformatics 2007, 8:28.
32. Zhang S: A comprehensive evaluation of SAM, the SAM R-
package and a simple modification to improve its perform-
ance. BMC Bioinformatics 2007, 8:230.
33. Claverie JM: Computational methods for the identification of
differential and coordinated gene expression. Human Mol
Genet 1999, 8(10):1821-1832.
34. Mutch DM, Berger A, Mansourian R, Rytz A, Roberts MA: The limit
fold change model: A practical approach for selecting differ-
entially expressed genes from microarray data. BMC Bioinfor-
matics 2002, 3:17.
35. Quackenbush J: Microarray data normalization and transfor-
mation. Nat genet 2002, 32(Suppl):496-501.
36. Belle WV, Gerits N, Jakobsen K, Brox V, Ghelue MV, Moens U:
Intensity dependent confidence intervals on microarray
measurements of differentially expressed genes: A case
study of the effect of MK5, FKRP and TAF4 on the transcrip-
tome. Gene Regulation Systems Biol 2007, 1:57-72.
37. Hong F, Breitling R, McEntee CW, Wittner BS, Nemhauser JL, Chory
J: RankProd: a bioconductor package for detecting differen-
tially expressed genes in meta-analysis. Bioinformatics 2006,
22(22):2825-2827.
38. Irizarry RA, Hobbs B, Collin F, Beazer-Barclay YD, Antonellis KJ,
Scherf U, Speed TP: Exploration, normalization, and summa-
ries of high density oligonucleotide array probe level data.
Biostatistics 2003, 4:
249-264.
39. Hochreiter S, Clevert DA, Obermayer K: A new summarization
method for Affymetrix probe level data. Bioinformatics 2006,
22(8):943-949.
40. Chen Z, McGee M, Liu Q, Scheuermann RH: A distribution free
summarization method for Affymetrix GeneChip arrays.
Bioinformatics 2007, 23(3):321-327.
41. Cope LM, Irizarry RA, Jaffee HA, Wu Z, Speed TP: A benchmark
for Affymetrix GeneChip expression measures. Bioinformatics
2004, 20(3):323-331.
42. Affycomp II website [ />]
43. Crimi M, Bordoni A, Menozzi G, Riva L, Fortunato F, Galbiati S, Del
Bo R, Pozzoli U, Bresolin N, Comi GP: Skeletal muscle gene
expression profiling in mitochondrial disorders. FASEB J 2005,
19(7):866-868.
44. Manley K, Gee GV, Simkevich CP, Sedivy JM, Atwood WJ: Microar-
ray analysis of glial cells resistant to JCV infection suggests a
correlation between viral infection and inflammatory
cytokine gene expression. Virology 2007, 366(2):394-404.
45. Thalacker-Mercer AE, Fleet JC, Craig BA, Carnell NS, Campbell WW:
Inadequate protein intake affects skeletal muscle transcript
profiles in older humans. Am J Clin Nutr 2007, 85(5):1344-1352.
46. Jin B, Tao Q, Peng J, Soo HM, Wu W, Ying J, Fields CR, Delmas AL,
Liu X, Qiu J, Robertson KD: DNA methyltransferase 3B
(DNMT3B) mutations in ICF syndrome lead to altered epi-
genetic modifications and aberrant expression of genes reg-
ulating development, neurogenesis, and immune function.
Hum Mol Genet 2008, 17(5):690-709.
47. Hall JL, Grindle S, Han X, Fermin D, Park S, Chen Y, Bache RJ, Mariash
A, Guan Z, Ormaza S, Thompson J, Graziano J, de Sam, Lazaro SE, Pan
S, Simari RD, Miller LW: Genomic profiling of the human heart
before and after mechanical support with a ventricular assist
device reveals alterations in vascular signaling networks.
Physiol Genomics 2004, 17(3):283-291.
48. Viemann D, Goebeler M, Schmid S, Nordhues U, Klimmek K, Sorg C,
Roth J: TNF induces distinct gene expression programs in
microvascular and macrovascular human endothelial cells. J
Leukoc Biol 2006, 80(1):174-185.
49. Toruner GA, Ulger C, Alkan M, Galante AT, Rinaggio J, Wilk R, Tian
B, Soteropoulos P, Hameed MR, Schwalb MN, Dermody JJ: Associa-
tion between gene expression profile and tumor invasion in
oral squamous cell carcinoma. Cancer Genet Cytogenet 2004,
154(1):27-35.
50. Csoka AB, English SB, Simkevich CP, Ginzinger DG, Butte AJ, Schat-
ten GP, Rothman FG, Sedivy JM: Genome-scale expression pro-
filing of Hutchinson-Gilford progeria syndrome reveals
widespread transcriptional misregulation leading to meso-
dermal/mesenchymal defects and accelerated atherosclero-
sis. Aging Cell 2004, 3(4):235-243.
51. Plager DA, Leontovich AA, Henke SA, Davis MD, McEvoy MT, Sciallis
GF 2nd, Pittelkow MR: Early cutaneous gene transcription
changes in adult atopic dermatitis and potential clinical
implications.
Exp Dermatol 2007, 16(1):28-36.
52. Goh SH, Josleyn M, Lee YT, Danner RL, Gherman RB, Cam MC,
Miller JL: The human reticulocyte transcriptome. Physiol
Genomics 2007, 30(2):172-178.
53. Gumz ML, Zou H, Kreinest PA, Childs AC, Belmonte LS, LeGrand
SN, Wu KJ, Luxon BA, Sinha M, Parker AS, Sun LZ, Ahlquist DA,
Wood CG, Copland JA: Secreted frizzled-related protein 1 loss
contributes to tumor phenotype of clear cell renal cell carci-
noma. Clin Cancer Res 2007, 13(16):4740-4749.
54. Reischl J, Schwenke S, Beekman JM, Mrowietz U, Sturzebecher S,
Heubach JF: Increased expression of Wnt5a in psoriatic
plaques. J Invest Dermatol 2007, 127(1):163-169.
55. Parikh H, Carlsson E, Chutkow WA, Johansson LE, Storgaard H,
Poulsen P, Saxena R, Ladd C, Schulze PC, Mazzini MJ, Jensen CB,
Krook A, Bjornholm M, Tornqvist H, Zierath JR, Ridderstrale M,
Altshuler D, Lee RT, Vaag A, Groop LC, Mootha VK: TXNIP regu-
lates peripheral glucose metabolism in humans. PLoS Med
2007, 4(5):e158.
56. Hsu EL, Yoon D, Choi HH, Wang F, Taylor RT, Chen N, Zhang R,
Hankinson O: A proposed mechanism for the protective effect
of dioxin against breast cancer. Toxicol Sci 2007, 98(2):436-444.
57. Spira A, Beane J, Pinto-Plata V, Kadar A, Liu G, Shah V, Celli B, Brody
JS: Gene expression profiling of human lung tissue from
smokers with severe emphysema. Am J Respir Cell Mol Biol 2004,
31(6):601-610.
58. Wood JR, Nelson-Degrave VL, Jansen E, McAllister JM, Mosselman S,
Strauss JF 3rd: Valproate-induced alterations in human theca
cell gene expression: clues to the association between val-
proate use and metabolic side effects. Physiol Genomics 2005,
20(3):233-243.
59. Eckfeldt CE, Mendenhall EM, Flynn CM, Wang TF, Pickart MA, Grin-
dle SM, Ekker SC, Verfaillie CM: Functional analysis of human
hematopoietic stem cell gene expression using zebrafish.
PLoS Biol 2005, 3(8):e254.
60. Hyrcza MD, Kovacs C, Loutfy M, Halpenny R, Heisler L, Yang S,
Wilkins O, Ostrowski M, Der SD: Distinct transcriptional pro-
files in ex vivo CD4+ and CD8+ T cells are established early
in human immunodeficiency virus type 1 infection and are
characterized by a chronic interferon response as well as
extensive transcriptional changes in CD8+ T cells.
J Virol 2007,
81(7):3477-3486.
61. Tripathi A, King C, de la Morenas A, Perry VK, Burke B, Antoine GA,
Hirsch EF, Kavanah M, Mendez J, Stone M, Gerry NP, Lenburg ME,
Rosenberg CL: Gene expression abnormalities in histologically
normal breast epithelium of breast cancer patients. Int J Can-
cer 2008, 122(7):1557-1566.
62. Wu W, Zou M, Brickley DR, Pew T, Conzen SD: Glucocorticoid
receptor activation signals through forkhead transcription
factor 3a in breast cancer cells. Mol Endocrinol 2006,
20(10):2304-2314.
63. Cole SW, Hawkley LC, Arevalo JM, Sung CY, Rose RM, Cacioppo JT:
Social regulation of gene expression in human leukocytes.
Genome Biol 2007, 8(9):R189.
64. Horwitz PA, Tsai EJ, Putt ME, Gilmore JM, Lepore JJ, Parmacek MS,
Kao AC, Desai SS, Goldberg LR, Brozena SC, Jessup ML, Epstein JA,
Cappola TP: Detection of cardiac allograft rejection and
response to immunosuppressive therapy with peripheral
blood gene expression. Circulation 2004, 110(25):3815-3821.
65. Pescatori M, Broccolini A, Minetti C, Bertini E, Bruno C, D'amico A,
Bernardini C, Mirabella M, Silvestri G, Giglio V, Modoni A, Pedemonte
M, Tasca G, Galluzzi G, Mercuri E, Tonali PA, Ricci E: Gene expres-
sion profiling in the early phases of DMD: a constant molec-
ular signature characterizes DMD muscle from early
postnatal life throughout disease progression. FASEB J 2007,
21(4):1210-1226.
66. Gomez BP, Riggins RB, Shajahan AN, Klimach U, Wang A, Crawford
AC, Zhu Y, Zwart A, Wang M, Clarke R: Human X-box binding
Publish with BioMed Central and every
scientist can read your work free of charge
"BioMed Central will be the most significant development for
disseminating the results of biomedical research in our lifetime."
Sir Paul Nurse, Cancer Research UK
Your research papers will be:
available free of charge to the entire biomedical community
peer reviewed and published immediately upon acceptance
cited in PubMed and archived on PubMed Central
yours — you keep the copyright
Submit your manuscript here:
/>BioMedcentral
Algorithms for Molecular Biology 2008, 3:8 />Page 12 of 12
(page number not for citation purposes)
protein-1 confers both estrogen independence and anties-
trogen resistance in breast cancer cell lines. FASEB J 2007,
21(14):4013-4027.
67. Jaworski J, Klapperich CM: Fibroblast remodeling activity at
two- and three-dimensional collagen-glycosaminoglycan
interfaces. Biomaterials 2006, 27(23):4212-4220.
68. Raetz EA, Perkins SL, Bhojwani D, Smock K, Philip M, Carroll WL, Min
DJ: Gene expression profiling reveals intrinsic differences
between T-cell acute lymphoblastic leukemia and T-cell lym-
phoblastic lymphoma. Pediatr Blood Cancer 2006, 47(2):130-140.
69. Barth AS, Merk S, Arnoldi E, Zwermann L, Kloos P, Gebauer M, Stein-
meyer K, Bleich M, Kaab S, Pfeufer A, Uberfuhr P, Dugas M, Steinbeck
G, Nabauer M: Functional profiling of human atrial and ven-
tricular gene expression. Pflugers Arch 2005, 450(4):201-208.
70. Barth AS, Merk S, Arnoldi E, Zwermann L, Kloos P, Gebauer M, Stein-
meyer K, Bleich M, Kaab S, Hinterseer M, Kartmann H, Kreuzer E,
Dugas M, Steinbeck G, Nabauer M: Reprogramming of the
human atrial transcriptome in permanent atrial fibrillation:
expression of a ventricular-like genomic signature. Circ Res
2005, 96(9):1022-1029.
71. Burleigh DW, Kendziorski CM, Choi YJ, Grindle KM, Grendell RL,
Magness RR, Golos TG: Microarray analysis of BeWo and JEG3
trophoblast cell lines: identification of differentially
expressed transcripts. Placenta 2007, 28(5–6):383-389.
72. Ryan MM, Lockstone HE, Huffaker SJ, Wayland MT, Webster MJ,
Bahn S: Gene expression analysis of bipolar disorder reveals
downregulation of the ubiquitin cycle and alterations in syn-
aptic genes. Mol Psychiatry 2006, 11(10):965-978.
73. Lockstone HE, Harris LW, Swatton JE, Wayland MT, Holland AJ, Bahn
S: Gene expression profiling in the adult Down syndrome
brain. Genomics 2007, 90(6):647-660.
74. Shi L, Tong W, Fang H, Scherf U, Han J, Puri RK, Frueh FW, Goodsaid
FM, Guo L, Su Z, Han T, Fuscoe JC, Xu ZA, Patterson TA, Hong H,
Xie Q, Perkins RG, Chen JJ, Gasciano DA: Cross-platform compa-
rability of microarray technology: Intra-platform consist-
ency and appropriate data analysis procedures are essential.
BMC Bioinformatics 2005, 6(Suppl 2):S12.
75. R Foundation for Statistical Computing:
R: A Language and Envi-
ronment for Statistical Computing. Vienna, Austria; 2006.
76. Gentleman RC, Carey VJ, Bates DM, Bolstad B, Dettling M, Dudoit S,
Ellis B, Gautier L, Ge Y, Gentry J, Hornik K, Hothorn T, Huber W,
Iacus S, Irizarry R, Leisch F, Li C, Maechler M, Rossini AJ, Sawitzki G,
Smith C, Smyth G, Tierney L, Yang JY, Zhang J: Bioconductor: open
software development for computational biology and bioin-
formatics. Genome Biol 2004, 5(10):R80.
77. Hubbell E, Liu WM, Mei R: Robust estimators for expression
analysis. Bioinformatics 2002, 18:1585-1592.
78. Barrett T, Troup DB, Wilhite SE, Ledoux P, Rudnev D, Evangelista C,
Kim IF, Soboleva A, Tomashevsky M, Edgar R: NCBI GEO: mining
tens of millions of expression profiles – database and tools
update. Nucleic Acids Res 2007:D760-D765.
79. Irizarry RA, Wu Z, Jaffee HA: Comparison of Affymetrix Gene-
Chip expression measures. Bioinformatics 2006, 22(7):789-794.
80. Kadota K, Araki R, Nakai Y, Abe M: GOGOT: a method for the
identification of differentially expressed fragments from
cDNA-AFLP data. Algorithm Mol Biol 2007, 2:5.
81. Katz S, Irizarry RA, Lin X, Tripputi M, Porter MW: A summariza-
tion approach for Affymetrix GeneChip data using a refer-
ence training set from a large, biologically diverse database.
BMC Bioinformatics 2006, 7:464.
82. Pepper SD, Saunders EK, Edwards LE, Wilson CL, Miller CJ: The util-
ity of MAS5 expression summary and detection call algo-
rithms. BMC Bioinformatics 2007, 8:273.
83. Benjamini Y, Hochberg Y: Controlling the False Discovery Rate:
a practical and powerful approach to multiple testing. J Royal
Stat Soc B 1995, 57:289-300.
84. Ashburner M, Ball CA, Blake JA, Botstein D, Butler H, Cherry JM,
Davis AP, Dolinski K, Dwight SS, Eppig JT, Harris MA, Hill DP, Issel-
Tarver L, Kasarskis A, Lewis S, Matese JC, Richardson JE, Ringwald M,
Rubin GM, Sherlock G: Gene ontology: tool for the unification
of biology. The Gene Ontology Consortium. Nat Genet 2000,
25(1):25-29.
85. Kadota K, Ye J, Nakai Y, Terada T, Shimizu K: ROKU: a novel
method for identification of tissue-specific genes. BMC Bioin-
formatics 2006,
7:294.
86. Kadota K, Nishimura SI, Bono H, Nakamura S, Hayashizaki Y, Okazaki
Y, Takahashi K: Detection of genes with tissue-specific expres-
sion patterns using Akaike's Information Criterion (AIC)
procedure. Physiol Genomics 2003, 12:251-259.
87. Kadota K, Konishi T, Shimizu K: Evaluation of two outlier-detec-
tion-based methods for detecting tissue-selective genes
from microarray data. Gene Regulation Systems Biol 2007, 1:9-15.
88. Harbron C, Chang KM, South MC: RefPlus: an R package extend-
ing the RMA algorithm. Bioinformatics 2007, 23(18):2493-2494.
89. Goldstein DR: Partition resampling and extrapolation averag-
ing: approximation methods for quantifying gene expression
in large numbers of short oligonucleotide arrays. Bioinformat-
ics 2006, 22(19):2364-2372.
90. Konishi T: Three-parameter lognormal distribution ubiqui-
tously found in cDNA microarray data and its application to
parametric data treatment. BMC Bioinformatics 2004, 5:5.
91. The R code for the ibmT method [ />]