Báo cáo sinh học: "Sequence embedding for fast construction of guide trees for multiple sequence alignmen" pdf
Bạn đang xem bản rút gọn của tài liệu. Xem và tải ngay bản đầy đủ của tài liệu tại đây (1.01 MB, 11 trang )
Blackshields et al. Algorithms for Molecular Biology 2010, 5:21
/>Open Access
RESEARCH
© 2010 Blackshields et al; licensee BioMed Central Ltd. This is an Open Access article distributed under the terms of the Creative Com-
mons Attribution License ( which permits unrestricted use, distribution, and reproduc-
tion in any medium, provided the original work is properly cited.
Research
Sequence embedding for fast construction of
guide trees for multiple sequence alignment
Gordon Blackshields, Fabian Sievers*, Weifeng Shi, Andreas Wilm and Desmond G Higgins
Abstract
Background: The most widely used multiple sequence alignment methods require sequences to be clustered as an
initial step. Most sequence clustering methods require a full distance matrix to be computed between all pairs of
sequences. This requires memory and time proportional to N
2
for N sequences. When N grows larger than 10,000 or so,
this becomes increasingly prohibitive and can form a significant barrier to carrying out very large multiple alignments.
Results: In this paper, we have tested variations on a class of embedding methods that have been designed for
clustering large numbers of complex objects where the individual distance calculations are expensive. These methods
involve embedding the sequences in a space where the similarities within a set of sequences can be closely
approximated without having to compute all pair-wise distances.
Conclusions: We show how this approach greatly reduces computation time and memory requirements for clustering
large numbers of sequences and demonstrate the quality of the clusterings by benchmarking them as guide trees for
multiple alignment. Source code is available for download from />.
Introduction
The majority of multiple sequence alignment (MSA)
methods use some form of progressive alignment [1-7].
In progressive alignment the usual first step is to compute
a pair-wise distance matrix which is then used to make a
so called guide tree, in order to determine the order of
alignment of the input sequences. The computation of
the distance matrix requires N (N - 1)/2 pair-wise com-
parisons, N being the number of sequences. Construction
of the guide tree, usually has an additional time complex-
ity of (N
2
) to (N
3
), depending on the algorithm used
and its implementation. The complexity of these steps
can become prohibitive when N becomes very large e.g.
when N is in the tens of thousands. There are very few
multiple alignment programs that can handle datasets of
this size, with MUSCLE and MAFFT being the most
familiar [6,7]. Some of the most accurate multiple
sequence alignment methods can only routinely handle
sequences numbering in the hundreds [4,8,9]. The explo-
sive growth in the number of sequences coming from
genomic studies means that the ability to cluster and
align greater numbers of sequences is becoming even
more important. For example, the Ribosomal Database
Project [10] Release 10 consists of more than a million
sequences.
In order to make very large guide trees, the first issue is
the sheer number of distance calculations. For example,
with 100,000 sequences, we need to compute approxi-
mately 5 billion distances to construct a complete dis-
tance matrix as needed by standard implementations of
Neighbor-Joining [11] or UPGMA [12]. Even if the
sequences are short, and pair-wise distance calculations
can be done relatively quickly, say at a rate of 5000s
-1
, this
still requires of the order of 1 million seconds (11.57 days)
of CPU time. Just to store the distance matrix is then dif-
ficult as it will take up of the order of 20 GB of disk space
and/or memory.
There are some shortcuts that can be taken to reduce
the number of distance calculations needed for cluster-
ing. For example, a recent paper by Katoh and Toh [13]
introduced the PartTree heuristic, which could rapidly
build a very rough guide tree from an initial small num-
ber of seed sequences, using a very fast 6-mer pair-wise
distance function and a divisive clustering algorithm with
an average time complexity of (N log N). This algo-
* Correspondence:
1
UCD Conway Institute of Biomolecular and Biomedical Sciences, University
College Dublin, Dublin 4, Ireland
Full list of author information is available at the end of the article
O O
O
Blackshields et al. Algorithms for Molecular Biology 2010, 5:21
/>Page 2 of 11
rithm was incorporated into the MAFFT suite of multiple
sequence alignment programs [14]. They reported that
this heuristic allowed the rapid clustering and alignment
of approximately 60,000 sequences in only a few minutes.
When used for a progressive alignment this considerable
enhancement in speed came at a cost of several percent in
alignment accuracy, as benchmarked on the Pfam data-
base of aligned protein families [15].
In this study, we look at data embedding methods
[16,17] for rapidly calculating guide trees. Our goal is to
associate the sequences with a set of vectors in some t-
dimensional embedding space. Embedding is done in such
a way that the positioning of the vectors in the space
reflects the relationships between the original sequences
as best as possible. Having embedded a set of sequences,
the distances between the vectors will be much faster and
cheaper to calculate than distances computed using typi-
cal sequence alignment methods which require (L
2
) to
(L
3
) time, L being the sequence length [18].
Several methods for embedding biological sequences
have already been applied to protein sequences. For
example, the Linial-London-Rabinovich (LLR) algorithm
[16] takes a number of subsets of sequences randomly
from the input dataset. Each individual sequence in the
dataset is then associated with a vector whose elements
are the distances between that sequence and the refer-
ence subsets (here, 'distance' is defined to be the mini-
mum distance between sequence and subset). The
number and size of the reference subsets only depends on
N, the number of sequences, such that each embedded
vector will be of dimensionality t = (log
2
N)
2
. This algo-
rithm was reported to offer close distance preservation in
the embedded space, and was successfully applied to
38,000 sequences from the Swiss-Prot database [19],
revealing many natural biological groupings. However,
the original implementation meant that (N
2
) pair-wise
distances had to be computed. SparseMap [17] was pro-
posed as a heuristic LLR variant which was applied in
much the same way as the original, but contains some
heuristics to speed up the embedding process, reducing
the number of pair-wise distances that had to be com-
puted from (N
2
) to (Nt).
The reference groups in both LLR and SparseMap are
generated randomly, meaning that a different embedding
is found after each run. For testing purposes, this means
the average result from several runs should therefore be
considered when comparing methods. When applying
UPGMA to the outputs from SparseMap embeddings
and using these clusterings as guide trees for multiple
alignments we found (results not shown) considerable
differences between runs, and these differences increase
as more divergent sequences are included. For these rea-
sons we introduced SeedMap [20] which is a simplifica-
tion of SparseMap which uses the same reference
sequences in every run and some heuristics to make fur-
ther increases in speed. SeedMap was found to be capable
of producing very fast embeddings of datasets numbering
in the 10s of thousands of sequences.
In this paper we look at the use of variations on Seed-
Map specifically for making guide trees for multiple
alignment. We name the resulting method mBed and
make it available with routines for sequence input and
options for the output of embedded vectors or guide
trees. This area of application requires high speed and
moderate memory requirements for routine use by biolo-
gists. Thus, we have tried to find a method that is as sim-
ple and fast as possible while losing as little accuracy as
possible compared to the use of a full distance matrix. We
test accuracy using standard multiple alignment bench-
marking methods [21,22]. We demonstrate the accuracy
of mBed guide trees by comparing these to randomised
guide trees and to guide trees directly calculated by
ClustalW [5]. We also compared the accuracy of the
guide trees to those from MAFFT and PartTree [7,13].
We demonstrate the scalability of the method by applying
it to a set of 380,000 tRNA sequences. Finally, we show a
useful by-product of the embedding process where we
can easily generate ordinations of large numbers of
sequences using Principal Coordinates Analysis (PCoA/
PCOORD) or Multi-Dimensional Scaling (MDS) [23].
Proposed method: mBed
Let X be our input dataset containing N sequences. We
need to consider two distance metrics associated with
these sequences. First we need a sequence distance [24]
to establish dis-similarities between any pair of sequences
x and y, denoted as d(x, y). In this paper we used the fast
k-tuple distance measure of Wilbur and Lipman [25], as
implemented in ClustalW [5], using the maximum possi-
ble k-tuple size of 2 (for protein), to make the distance
calculation as fast as possible. Each sequence x will even-
tually be associated with a vector F(x) in some t-dimen-
sional space, so we also need a metric to calculate the
distance between pairs of vectors. For this we simply use
the Euclidean distance metric which we denote as δ (F(x);
F(y)). The embedding is considered successful then if, for
all pairs of sequences, the embedded distances closely
approximate the sequence distances.
In SparseMap [17] and SeedMap [20], the t dimensions
above are distances from t subsets of the sequences. We
refer to these subsets as references. In Seed Map, we
aimed to improve the choice of reference groups by
attempting to identify natural clusters within the dataset
prior to embedding. This was found to be useful both for
increasing accuracy of the embedding but also for
increasing speed. In this paper, we try to gain further
O
O
O
O O
Blackshields et al. Algorithms for Molecular Biology 2010, 5:21
/>Page 3 of 11
increases in speed by identifying single sequences from
our input data X to act as references. Ideally these
sequences, which shall be referred to here as "seeds",
should characterise the dataset as a whole, and should
therefore include representatives of natural groups/clus-
ters within the dataset, and also include outliers.
The number of references chosen by the LLR method
and SparseMap is a simple function of the number of
sequences. In our method, however, the number of seeds
chosen also depends to an extent on the nature of the
data. The aim is that when the input data contains very
homogeneous and similar sequences, very few seeds will
be required for the embedding, and the dimensionality t
will be small. Conversely, when more divergent sequences
are considered, the number of required seeds will natu-
rally increase. The proposed algorithm, which we name
mBed, is described next.
1. Initial seed selection
A number of t sequences are initially sampled from the
input dataset X. Following the LLR algorithm, this value
is set by default to t = (log
2
N)
2
. This sampling is referred
to as R. Here, we chose to sample t sequences with con-
stant stride from a length-sorted X.
The seeds that have been chosen are then compared to
each other. If any two seeds are highly similar to each
other (below a certain distance threshold) the shorter one
is considered redundant, and is discarded. This threshold
is, by default, set to zero (so that only identical sequences
are excluded)
2. Analysis of potential seed sequences
The set of reference points R can now be used directly to
embed the input sequences (see step 3). Alternatively,
each seed sequence can be used to find extra seeds that
help better characterise the dataset. This can be done in
one of two ways.
'usePivotObjects' heuristic
Each seed sequence is used to find potential outliers.
First, the sequence that is furthest away from the seed is
identified. The sequence that is furthest away from that
sequence is then returned as a new seed.
For each seed sequence s in R:
1. Let l be the sequence in X that maximises d(l, s).
2. Let m be the sequence in X that maximises d(m, l).
3. Return m as a new seed.
'usePivotGroups' heuristic
This works in a similar way to the 'usePivotObjects' heu-
ristic, but finds groups rather than single sequences. It
first finds the sequence that is furthest away from the
seed, and then iteratively finds the sequence that is fur-
thest away from the group of those already chosen, i.e.:
For each seed sequence s in R:
1. Let l be the sequence in X that maximises d(l, s).
2. Let m be the sequence in X that maximises d(m, s)
+ d(m, l).
3. Let n be the sequence in X that maximises d(n, s) +
d(n, l) + d(n, m) etc.
The loop terminates if the same sequence is identified
more than once, or if the group reaches a set maximum
size. Each member of the group is then returned as a new
seed. As in step 1, before any sequences are accepted as
seeds, they are first compared to those already chosen,
and if they are found to be highly similar, they are
rejected as seeds.
3. Embedding of input sequences
After the seed sequences in R have been chosen, all
sequences in the input data are associated with a t-
dimensional vector. This is done simply by computing the
distances from all sequences to each of the t seeds. The
distances become the coordinate values of the embedded
vector, i.e. for each sequence s in X, let F(s) be the corre-
sponding embedded vector, such that F(s) = [d(s, R
1
), d(s,
R
2
) d(s, R
t
)].
Results
The embedding process entails the construction of vec-
tors representing biological sequences in such a way that
the distances between those vectors approximate the dis-
similarities between the sequences themselves. These
vector distances are orders of magnitude faster to calcu-
late than sequence distances, and this allows us to rapidly
generate a distance matrix δ (F(x), F(y)) from a set of
embedded sequences. For very large numbers of
sequences, perhaps numbering in the hundreds of thou-
sands, such distance matrices can become unmanageable,
due to sheer size. In these cases, the sequence vectors can
be clustered using an alternative clustering method such
as k-means. For this paper, our main aim is to be able to
rapidly generate guide trees which can be used to make
multiple alignments of the input sequences. Here, this is
done by applying the UPGMA clustering algorithm to the
embedded distance matrix. We then try to measure the
success of the overall procedure by (i) tree comparison
and (ii) comparing the multiple sequence alignments that
are generated using guide trees from embedded distance
matrices with those generated from full sequence dis-
tance matrices. This comparison is achieved using stan-
dard multiple alignment benchmarking procedures.
Attempts at directly comparing the distance matrices
using standard matrix comparison methods, such as
Stress [26], proved inconclusive, and results are not
shown here.
Quality assessment by direct tree comparison
As the mBed procedure progresses from distance matrix,
via guide tree to alignment, it should prove informative to
Blackshields et al. Algorithms for Molecular Biology 2010, 5:21
/>Page 4 of 11
assess the quality of the intermediate step, the guide tree.
For this we used the guide trees derived from (i) the full
distance matrix, (ii) the SparseMap method and (iii)
mBed. The full matrix guide trees were taken as the base-
line. We used the Robinson-Foulds (RF) metric [27], as
implemented by the treedist program of the PHYLIP
suite [28], to measure the distance of the SparseMap and
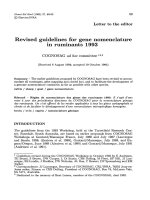
the mBed guide trees from the baseline. In Figure 1 we
plotted the RF distance of the SparseMap guide tree from
the full matrix guide tree versus the RF distance of the
mBed guide tree from the full matrix guide tree for the
BAliBase benchmark set of 386 test cases. As the RF mea-
sure has no immediate statistical interpretation, we sim-
ply make the qualitative observation that more points
(260 out of 386) lie above the bisectrix than on it (78) or
below it (48), suggesting that the SparseMap guide trees
are on average 'further away' from the full matrix guide
trees than the mBed guide trees.
Initial application to multiple sequence alignment
Typically, the quality of a multiple sequence alignment is
measured by comparison of the alignment to one from an
independently verified reference alignment. Initially, we
tested mBed on a small number of such test cases to
establish the approximate speed and accuracy of mBed
and its variations. The level of agreement between two
alignments can be assessed using the Column Score [29],
which measures the percentage of the columns of resi-
dues in the test alignment which agree with the columns
in the reference alignment. We use the qscore alignment
evaluation program to calculate the Column Score [6].
BAliBase [22,29] was the first large scale benchmark
dataset against which alignment programs were routinely
assessed. Test cases from this dataset are designed to
expose new methods to many different types of align-
ment problems. However, the test cases are relatively
small, and cannot show how alignment methods deal
with very large numbers of sequences. A collection of
larger test cases was therefore derived from Pfam [15,30]
so that accuracy when dealing with thousands of
sequences could be assessed. Each Pfam entry containing
up to 10,000 sequences and which had a corresponding
structural alignment for two or more of the sequences in
HOMSTRAD [21] was retrieved from the database. The
upper limit of 10,000 was set so that results derived from
using a full distance matrix could be included for com-
parison.
In each test case, assessment of the overall test align-
ment was made by using the sequences in common
between the Pfam and HOMSTRAD entry. This was usu-
ally just a relatively small number of sequences and
includes those with known 3D structures. The alignment
of these common sequences was then compared, using
qscore. This compares the alignment generated using the
guide tree, calculated using the embedded distances
against the corresponding HOMSTRAD structural align-
ment. We show the details of the timings and qscore
results for the ten largest of these test cases in Table 1.
Each entry contains 9,000-10,000 protein sequences. In
the same table, we also give the qscore results from using
a guide tree based on a full distance matrix from
sequence edit distances.
As can be seen in Table 1, the default mBed approach
(labelled (2)) requires an average of 53 seconds to embed
each entry, with a further 49 seconds to generate a dis-
tance matrix from the vectors. In total, this amounts to
less than 7% of the time required for computation of a full
pair-wise distance matrix (1533 seconds). This saving is
due to the considerable reduction in required distance
evaluations, and the increased speed at which distance
evaluations between the vectors can be made. The value
of t (the number of reference or seed sequences) ranged
from 143 to 169.
A UPGMA guide tree built from either distance matrix
then takes an average of 5 seconds to construct (data not
shown). This guide tree is passed to ClustalW to guide
the alignment of the input sequences. Assessment of the
alignment quality (and by association, of the embedding)
is made by comparison to the corresponding HOM-
STRAD entry using the Column Score (see last four col-
umns in Table 1). On average, there is 1.9% difference in
alignment quality between the mBed approach and the
Figure 1 Tree Distances. Tree distances of SparseMap and mBed
guide trees from full matrix guide trees for the BAliBase benchmark set
(386 families), using the Robinson-Foulds metric. Data points above
the bisectrix (red) indicate instances where the SparseMap tree is infe-
rior to the mBed tree, and vice versa. Multiple data points may lie on
top of each other.
Blackshields et al. Algorithms for Molecular Biology 2010, 5:21
/>Page 5 of 11
full distance matrix computation. There is of course a big
stochastic error because we only used 10 examples, but
the overall trend is clear: mBed reduces the time for guide
tree computation drastically, while the alignment quality
remains almost unchanged, on average.
Table 1 also shows the effect of different approaches for
the selection of seeds. The variation called 'usePivotOb-
jects' (labelled (3) in the table) brings no increase in align-
ment accuracy whereas 'usePivotGroups" (labelled (4))
increases the accuracy, but also almost triples the embed-
ding time. We therefore ignore these options in the rest of
this paper. The second option is of interest as it has an
obvious effect on accuracy, but is not used in mBed by
default. These two heuristics were just two among a long
series of heuristics that were examined during the devel-
opment of mBed and our earlier method, SeedMap. We
include these preliminary results as it shows that there is
more accuracy to be gained by careful consideration of
seed/reference selection. Nonetheless, the extra compu-
tational overhead and the complicated hand optimisation
that was needed to run these heuristics made us choose
to drop these as default options.
Embedding sequences scales well for large numbers of
sequences
The main advantage in using a data embedding approach
is the reduction in the number of pair-wise expensive dis-
tance evaluations that need to be calculated. The scatter
plot in Figure 2 shows the times required to calculate a
full pair-wise distance matrix directly from the sequence
data (red) for each entry in the HOMSTRAD/Pfam data-
set. As expected, these times scale quadratically, thus
appearing linear with a slope of two on a double-log plot.
However, due to the heterogeneity of the different test
cases used (for example, in terms of sequence lengths),
the data points do not fall neatly on to a well defined line,
but within a particular region. For comparison, the total
time required to (1) create a set of embedded vectors
from the sequence data and (2) create a distance matrix
from the vectors is plotted in blue. This plot shows a sav-
ing of an order of magnitude compared to the traditional
approach, as well as a more favourable scalability (that is
to say, a lesser slope).
To further illustrate this scalability we use RF00005, the
largest entry in the Rfam database [31]. RF00005 contains
381,601 tRNA sequences, ranging between 74-95 nucle-
otides in length. The similarity in length among all these
sequences means that the main deciding factor in compu-
tation time, for the alignment of any subset of this data-
set, is the number of sequences to be aligned. A series of
subsets of different sizes were extracted from this entry
and embedded. By default, the embedding process simply
selects t sequences to act as reference points, and calcu-
lates the distances from these references to all other
Table 1: mBed performance on the ten biggest Pfam/HOMSTRAD families.
Name Size Len %ID Embedding Time (s) Distance Matrix Calculation
Time (s)
Alignment Column Score (%)
(1) (2) (3) (4) (1) (2) (3) (4) (1) (2) (3) (4)
PF01381 9993 53 23 - 25 55 136 764 57 55 175 13.3 26.7 25.3 34.7
PF00006 9796 209 43 - 134 248 280 4364 48 49 88 42.8 36.6 36.6 38.0
PF00989 9681 95 17 - 43 88 197 1281 50 51 159 46.5 33.3 31.8 34.1
PF00486 9615 75 30 - 34 69 107 950 55 52 104 63.9 92.8 64.9 89.7
PF00571 9551 119 19 - 73 143 268 1993 54 50 152 6.15 3.08 1.54 1.54
PF00097 9423 41 33 - 18 38 94 517 44 43 115 53.2 54.8 61.3 54.8
PF01479 9352 47 32 - 17 40 90 496 45 46 124 58.3 91.7 89.6 79.2
PF00046 9305 54 35 - 20 43 85 651 41 42 77 59.4 44.9 46.4 60.9
PF00550 9249 63 25 - 28 59 136 794 47 47 141 51.3 32.9 55.3 59.2
PF00149 9072 198 14 - 133 256 552 3515 47 46 172 75.4 71.9 72.3 76.1
Average 9503 95 27 0 53 104 195 1533 49 48 131 47.0 48.9 48.5 52.8
The ten biggest Pfam entries containing 9,000-10,000 sequences, which have a corresponding HOMSTRAD alignment are used here. Four
different methods were applied to each entry to calculate a distance matrix. These methods are: (1) the traditional process of calculating a full
distance matrix from the sequence data using an alignment distance measure; (2) mBed default; (3) mBed followed by the 'usePivotObjects'
method; (4) mBed followed by the 'usePivotGroups' method. A UPGMA guide tree is constructed from each matrix and used as a guide tree for
progressive alignment of the sequences. The alignment is then scored against the corresponding HOMSTRAD structural alignment using
Column Score.
(1) Full d(x, y) distance matrix; (2) mBed; (3) mBed + usePivotObjects; (4) mBed + usePivotGroups
Blackshields et al. Algorithms for Molecular Biology 2010, 5:21
/>Page 6 of 11
sequences. Essentially, this is the same as calculating t
rows of a distance matrix. For 300,000 sequences the
method selected t = 303 seeds. Figure 3 shows that this
approach scales practically linearly with increasing values
of N. All 381,601 tRNA sequences can be embedded in
under 40 minutes, using 1 core of a 3.33 GHz Intel Xeon
with 6 MB cache.
Having embedded such large numbers of sequences, it
is not straightforward to use UPGMA to cluster these
without taking special steps [32]. The distance matrix
alone, becomes huge and difficult to generate or store in
memory. Nonetheless, there are alternative, efficient clus-
tering methods that can be used directly on the embed-
ded vectors. For example, k-means clustering, can cluster
300,000 of these sequences, in 6 minutes (using a k of
300) on a single processor, after embedding.
Choice of guide tree affects alignment quality
To demonstrate the precise effects of guide tree quality
on alignments of different degrees of difficulty, five test
cases of 1000 sequences each, were taken from Pfam.
Figure 2 Complexity of Embedding. Total time required to compute a full pair-wise distance matrix (red) is plotted against time taken to embed
sequences (blue) for each entry in the HOMSTRAD/Pfam dataset (containing up to 10,000 sequences per entry).
Blackshields et al. Algorithms for Molecular Biology 2010, 5:21
/>Page 7 of 11
These had between 17% and 61% pair-wise identity, on
average. In each case, a guide tree was constructed using
Clustal and the quality of the alignment was assessed by
comparing the alignment of the included HOMSTRAD
sequences against the HOMSTRAD reference alignment.
Five alignments were also generated using mBed guide
trees and scored. These scores are shown plotted in Fig-
ure 4.
For each test case, 1000 randomised guide trees were
generated by taking the Clustal default guide tree and
randomly shuffling the labels (the sequence names) on
each one. This generated a distribution of scores from
randomised trees of identical structure (topology and
branch lengths) to the test tree. These are shown as the
dark blue histograms in Figure 4. mBed is a simplification
over our earlier SeedMap method [20] which is in turn
related to the earlier SparseMap [17]. SparseMap, uses
random seed selection and thus gives a different guide
tree, each time it is run. This is an inconvenience for nor-
mal alignment purposes but in this case, it can be used to
generate a range of guide trees for each of these test cases.
Thus, we have also plotted the results from 1000
SparseMap runs on each part of Figure 4, using a pale
blue histogram.
The first thing that can be seen is that for the most diffi-
cult of the five test cases (in panel (a) of Figure 4), it
makes little difference which guide tree is used. Here, all
sequences are very dissimilar and the usual beneficial
effects of using a good guide tree, make little difference to
the final alignment quality. This is good news and bad
news. The good news is that, therefore, mBed will be no
worse that using the default guide trees. The bad news is
that all guide trees are ineffective anyway. For the remain-
ing four test cases, the randomised Clustal guide trees are
clearly inferior to both the default Clustal and mBed
guide trees. This says that the details of the guide tree do
matter a great deal, and is a very simple and direct mea-
sure of the effectiveness of progressive alignment itself.
This is true, even for the easiest test cases, where the use
of a good guide tree gives almost 100% correct align-
ments. The spread of scores from SparseMap is very
noticeable in the medium difficulty test cases in panels
(b) and (c). This is one reason for wanting to replace
SparseMap with a method that gives the same result on
every run. With very similar sequences (panels (d) and
(e)), the runs are fairly uniform but with the intermediate
difficulty alignments, the variation between runs is very
high.
Large-scale assessment of alignment quality
We carried out a broad assessment of alignment quality
using two complete sets of test sequences. We used BAli-
Base because it allows comparison with other work but
the numbers of test cases per reference alignment are rel-
atively small. We therefore, also used the HOMSTRAD/
Pfam test arrangement that we used earlier but now
report the average accuracies across all 646 test cases.
mBed, was applied to each dataset and the results are
listed in Table 2. The main mBed result is given in the last
line of the table which shows results for default mBed
guide trees and using ClustalW for making the align-
ments. Performance is also shown for alignments built
using guide trees generated using our earlier SeedMap
program. For comparison, at the top of the table, we give
results for alignments made using default ClustalW and
also with the -quicktree and -ktuple = 2 flags i.e. the
mBed equivalent. We also give results for MUSCLE and
MAFFT (with and without the -parttree heuristic), and
also from using the PartTree output as a guide tree for
ClustalW, and vice versa, using the mBed generated tree
as a guide tree for MAFFT and MUSCLE.
The left hand column of results in Table 2 gives the
results for the BAliBase test cases. The figures are aver-
ages across all test cases and all the numbers lie in a very
narrow range with default MUSCLE performing best
(35.80%), closely followed by MUSCLE using the mBed
tree (35.38%). This is encouraging in that it shows that
mBed does not incur any major loss in accuracy. For the
HOMSTRAD/Pfam data (right hand column), we were
unable to compute results for default MUSCLE due to
very long running time, which is mainly caused by Mus-
cle's iteration steps. The default version of MAFFT is the
most accurate (66.51%), followed by MUSCLE with itera-
tion switched off (60,45%). If the PartTree option is used
without refinement then MAFFT's accuracy drops mark-
Figure 3 Times for embedding up to 300,000 tRNA sequences.
Number of calls to the d(x, y) distance function made during computa-
tion of a full pair-wise distance matrix (red), plotted against number of
sequences for random subsets of Rfam entry RF00005 which contains
381,602 tRNA sequences. We only show the number of calls up to
40,000 sequences. In blue we show the times for embedding subsets
up to 300,000 sequences in size. The full data set takes 40 minutes to
embed.
1e+09
8e+08
6e+08
4e+08
2e+08
300,000200,000100,000
5.00
4.00
3.00
2.00
1.00
0.00
Distance Calls [N]
Time [h]
Number of Sequences [N]
embedded
Full Matrix
Blackshields et al. Algorithms for Molecular Biology 2010, 5:21
/>Page 8 of 11
edly (59.27%). On the other hand, default ClustalW starts
off from a lower baseline (60.12%) but does not incur
such a large drop (59.24%) if mBed is used to make the
guide tree. This is the main focus of this paper. Our older
SeedMap method gives slightly lower performance
(58.85%).
A PartTree guide tree appears to be incompatible with
the ClustalW aligner (54.75%), while an mBed tree seems
to fare only slightly better as a guide tree for MAFFT
(57.57%). This appears to be due to differences in how the
two packages use guide trees. For example, ClustalW uses
branch length information for sequence weighting. It also
uses branch lengths to delay the alignment of very diver-
gent sequences until all other sequences have been
aligned. We used the -retree 0 option to generate the
PartTree guide tree so as to avoid the iterative refinement
step of MAFFT (Katoh, private communication). With
MUSCLE, initial guide trees are generated rapidly using
k-tuple counts and then refined by iteration. The initial
trees are fast and simple and the alignment quality is con-
siderable improved by the later iteration steps. We com-
pared MUSCLE without iteration, using mBed guide
trees and using the internal MUSCLE k-tuple based trees.
Use of the mBed tree improves on the MUSCLE result
(from 60.45% to 64.18%; iteration turned off ).
Visualisation of embedded sequences
Data embedding methods give the user great flexibility
when visualising the relationships between sequences of
interest, without the specific need to cluster or align. To
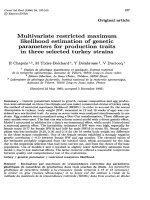
give a simple example, mBed was used to generate 121
dimensional vectors for 3994 H3N2 influenza virus hae-
maglutinin sequences from GenBank i.
nlm.nih.gov/genomes/FLU, selecting 'any region' and 'any
species'. These vectors were subjected to Principle Com-
ponents Analysis (PCA), and the first three axes of this
analysis were then used to directly visualise the virus
sequences in 3D space (Figure 5). The vectors were
coloured using a time-based colour scheme, representing
the year of isolation for each sequence. The oldest
sequences (from 1967) are coloured in blue, changing to
red as time progressed (up to 2008). Such a time series is
hard to visualise using simple hierarchical clustering but
the almost linear progression through time is very clear
using the PCA of the embedded sequences.
Figure 4 Variation in alignment score induced by choice of guide tree. Alignment quality scores for a collection of five test cases (a-e) taken from
the HOMSTRAD/Pfam dataset, and aligned with ClustalW using guide trees generated from a variety of sources. Quality scores using guide trees from
ClustalW -quicktree and from mBed are shown as arrows. Scores from 1000 randomised guide trees are shown in dark blue. Scores from 1000
SparseMap guide trees are shown in light blue.
Blackshields et al. Algorithms for Molecular Biology 2010, 5:21
/>Page 9 of 11
Conclusions
The method that we describe here (mBed) is fast and
simple but highly effective. It can be used to make guide
trees of the order of 10,000 sequences using modest
amounts of memory, in minutes. For very short
sequences, the times can be as little as 20 seconds or so to
embed the sequences. A further 5 to 10 seconds are
needed to cluster the sequences using UPGMA. This is
an enormous speed up over the traditional method which
requires every sequence to be aligned with every
sequence to generate a full distance matrix. The method
also scales well and can be used to embed datasets of the
size of 100s of thousands of sequences. In terms of being
useful for making guide trees, the method is equivalent to
the PartTree algorithm [13] which also generates guide
trees, very rapidly. The two algorithms are quite different
however, in detail, and mBed does have some features, for
example support for branch-lengths, which make the
method interesting as an alternative.
The most important criterion, ultimately, in judging an
embedding of a set of sequences, is quality of the results.
In earlier tests, we experimented with comparing the dis-
tance matrices from embedded sequences against full dis-
tance matrices from all-against-all comparisons using
standard matrix comparison measures such as Stress
[26]. The motivation was to use such comparisons to
compare different seed selection methods but the results
were very dataset dependant and therefore inconclusive
(results not shown). As an intermediate step we com-
pared guide trees produced by mBed and SparseMap to
guide trees derived from full distance matrices. For this
we used the Robinson-Foulds (RF) metric. We can see on
the comparison plot that mBed guide trees are on average
'closer' to full distance matrix tree guide trees than
SparseMap guide trees. In the end we chose to measure
quality of the final results, using alignment benchmarking
because this directly measures how well a guide tree
works. This is good because it measures quality of the
Table 2: Comparison of alignment accuracy between ClustalW, MAFFT, SparseMap and mBed.
Method Alignment Column Score (%)
BAliBase HOMSTRAD/Pfam
Guide Trees constructed internal to method
ClustalW 32.66 60.12
ClustalW -quicktree -ktuple=2 32.84 59.92
MAFFT 31.97 66.51
MAFFT -retree 1 31.24 60.09
MAFFT -retree 1 -parttree 30.04 59.27
MUSCLE 35.80 NA
MUSCLE -maxiters 1 32.04 60.45
Guide Trees constructed external to method
MUSCLE+mBed 35.38 NA
MUSCLE -maxiters 1+ mBed 32.86 64.18
MAFFT + mBed 29.79 57.57
ClustalW + "MAFFT -retree 0 -parttree" 31.64 54.75
ClustalW + SeedMap 29.82 58.85
ClustalW + mBed 30.20 59.24
# of alignments 386 646
Average Column scores (%) are given for each method. Accuracies are measured on two datasets. The HOMSTRAD-Pfam dataset comprises
646 test cases. Each test consists of a Pfam alignment containing between 3-10,000 sequences, which has been paired with a corresponding
structural alignment from HOMSTRAD.
Blackshields et al. Algorithms for Molecular Biology 2010, 5:21
/>Page 10 of 11
end product. It does not, however, say how well an
embedding of a set of sequences will work for other pur-
poses such as determining the main groups of homolo-
gous sequences in an entire database.
For our purposes, we were mainly interested in a fast
way of generating guide trees for multiple alignment,
especially for future versions of the ClustalW package.
For this purpose, mBed works extremely well. There is a
modest loss in accuracy compared to using a full distance
matrix. Further, we found the guide trees worked better
with ClustalW than those from PartTree although that
may be due to differences between the packages and how
they use guide trees. PartTree works fine when used
directly with the MAFFT package.
The trees from mBed are generated strictly by grouping
similar sequences rather than by attempting to accurately
reconstruct phylogenetic branching orders. This would
make us advise against using mBed directly for large scale
phylogeny. The sequence alignments, however, may actu-
ally be improved by using guide trees that are based on
similarity rather than phylogeny [6,8]. Progressive align-
ment works by using the guide tree to align the next most
closely related sequences to each other. The most similar
sequences will be the easiest to align most accurately and
this delays the more difficult alignments until last. The
method we have described uses a very crude method for
selecting seed sequences. Ideally, we would like a much
more rigorous approach that would chose seed sequences
as being as representative as possible of the full diversity
of sequences in a dataset. In this paper we tried a couple
of modifications of the basic method and found some
useful increases in accuracy but at the expense of speed.
Nonetheless, the results are good, as measured by the
benchmarking.
Finally, by embedding a set of sequences, we get an
alternative representation of the sequences that is very
flexible with regards to how the sequences can be viewed.
By using the embedded sequence vectors as input to
PCA, we get very elegant and clear visualisations of large
numbers of sequences. For a fixed number of seed
sequences one can, in principle, visualise any number of
sequences, once they have been embedded. This could be
used to carry out PCA on entire databases of sequences
or entire outputs from high throughput sequencing runs.
Methods
Program Versions and Command-line Arguments
We used MAFFT version 6.705b [14], Clustal version
2.0.11 [33] and MUSCLE version 3.7 [6]. Non-default
command-line arguments are given in Table 2. For evalu-
ation of alignment quality we used qscore version 1.1
/> with default arguments
[6]. The Robinson-Foulds metric was computed with
PHYLIP's treedist, version 3.68 etics.
washington.edu/phylip/general.html. The mBed source
code is available on />.
Benchmark
For benchmarking of alignment quality we used Pfam
version 22.0 [15], BAliBase Version 3 [22] and HOM-
STRAD, downloaded on 2009-06-09 [21]. The HOM-
STRAD/Pfam benchmark comprises of Pfam entries
containing up to 10,000 sequences, which had a corre-
sponding structural alignment for two or more of the
sequences in HOMSTRAD. Alignment quality was then
measured on the corresponding HOMSTRAD sequences
only.
Competing interests
The authors declare that they have no competing interests.
Authors' contributions
This project was conceived by DH and initiated and developed by GB with
advice from AW and FS. The benchmarking was done by GB and FS. The soft-
ware was developed by GB and FS. The influenza virus example came from WS.
The final manuscript was written and approved by all authors.
Acknowledgements
The authors wish to thank Kazutaka Katoh for useful discussions and help with
the use of MAFFT/PartTree. This work was supported by funding from the Sci-
ence Foundation Ireland (PI grant 07/IN.1/B1783).
Author Details
UCD Conway Institute of Biomolecular and Biomedical Sciences, University
College Dublin, Dublin 4, Ireland
Figure 5 PCA visualisation of embedded H3 Influenza virus se-
quences. An embedding of 3994 GenBank haemaglutinin sequences
from H3N2 influenza viruses, generated using mBed, and visualised us-
ing the first three axes of a PCA of the embedded vectors. Each se-
quence has been coloured by year of isolation to show the progression
of sequence change between the years 1967 (blue) and 2008 (red).
Blackshields et al. Algorithms for Molecular Biology 2010, 5:21
/>Page 11 of 11
References
1. Hogeweg P, Hesper B: The alignment of sets of sequences and the
construction of phyletic trees: an integrated method. J Mol Evol 1984,
20(2):175-86.
2. Taylor WR: Multiple sequence alignment by a pairwise algorithm.
Comput Appl Biosci 1987, 3(2):81-7.
3. Feng DF, Doolittle RF: Progressive sequence alignment as a prerequisite
to correct phylogenetic trees. J Mol Evol 1987, 25(4):351-60.
4. Notredame C, Higgins DG, Heringa J: T-Coffee: a novel method for fast
and accurate multiple sequence alignment. J Mol Biol 2000,
302:205-217.
5. Thompson JD, Higgins DG, Gibson TJ: CLUSTAL W: improving the
sensitivity of progressive multiple sequence alignment through
sequence weighting, position-specific gap penalties and weight
matrix choice. Nucleic Acids Res 1994, 22(22):4673-80.
6. Edgar RC: MUSCLE: multiple sequence alignment with high accuracy
and high throughput. Nucleic Acids Res 2004, 32(5):1792-7.
7. Katoh K, Misawa K, Kuma K, Miyata T: MAFFT: a novel method for rapid
multiple sequence alignment based on fast Fourier transform. Nucleic
Acids Res 2002, 30(14):3059-66.
8. Do CB, Mahabhashyam MS, Brudno M, Batzoglou S: ProbCons:
Probabilistic consistency-based multiple sequence alignment.
Genome Res 2005, 15(2):330-40.
9. Pei J, Grishin NV: PROMALS: towards accurate multiple sequence
alignments of distantly related proteins. Bioinformatics 2007,
23(7):802-8.
10. Cole JR, Wang Q, Cardenas E, Fish J, Chai B, Farris RJ, Kulam-Syed-
Mohideen AS, McGarrell DM, Marsh T, Garrity GM, Tiedje JM: The
Ribosomal Database Project: improved alignments and new tools for
rRNA analysis. Nucl Acids Res 2009, 37(suppl_1):D141-145.
11. Saitou N, Nei M: The neighbor-joining method: a new method for
reconstructing phylogenetic trees. Mol Biol Evol 1987, 4(4):406-25.
12. Sneath P, Sokal R: Numerical Taxonomy. San Francisco, CA: WH Freeman;
1973.
13. Katoh K, Toh H: PartTree: an algorithm to build an approximate tree
from a large number of unaligned sequences. Bioinformatics 2007,
23(3):372-4.
14. Katoh K, Toh H: Recent developments in the MAFFT multiple sequence
alignment program. Brief Bioinform 2008, 9(4):286-98.
15. Finn RD, Mistry J, Schuster-Bockler B, Griffiths-Jones S, Hollich V, Lassmann
T, Moxon S, Marshall M, Khanna A, Durbin R, Eddy SR, Sonnhammer EL,
Bateman A: Pfam: clans, web tools and services. Nucleic Acids Res
2006:D247-51.
16. Linial N, London E, Rabinovich Y: The Geometry of Graphs and Some of
Its Algorithmic Applications. Combinatorica 1995, 15:215-245.
17. Hristescu G, Farach-Colton M: Cluster-Preserving Embedding of
Proteins. In Tech rep Rutgers University, New Jersey; 1999. [Technical
report]
18. Needleman SB, Wunsch CD: A general method applicable to the search
for similarities in the amino acid sequence of two proteins. J Mol Biol
1970, 48(3):443-53.
19. Linial M, Linial N, Tishby N, Yona G: Global self-organization of all known
protein sequences reveals inherent biological signatures. J Mol Biol
1997, 268(2):539-56.
20. Blackshields G, Larkin M, Wallace IM, Wilm A, Higgins DG: Fast embedding
methods for clustering tens of thousands of sequences. Computational
Biology and Chemistry 2008, 32(4):282-286.
21. Mizuguchi K, Deane CM, Blundell TL, Overington JP: HOMSTRAD: a
database of protein structure alignments for homologous families.
Protein Sci 1998, 7(11):2469-71.
22. Thompson JD, Koehl P, Ripp R, Poch O: BAliBASE 3.0: latest
developments of the multiple sequence alignment benchmark.
Proteins 2005, 61:127-36.
23. Gower JC: Some Distance Properties of Latent Root and Vector
Methods Used in Multivariate Analysis. Biometrika 1966, 53:325.
24. Levenshtein V: Binary Codes Capable of Correcting Deletions,
Inserstions and Reversals. Soviet Physics Doklady 1966, 10:707-710.
25. Wilbur WJ, Lipman DJ: Rapid similarity searches of nucleic acid and
protein data banks. Proc Natl Acad Sci USA 1983, 80(3):726-30.
26. Kruskal J: Multidimensional Scaling by Optimizing Goodness of Fit to a
Nonmetric Hypothesis. Psychometrika 1964, 29:1-27.
27. Robinson D, Foulds L: Comparison of phylogenetic trees. Mathematical
Biosciences 1981, 53(1-2):131-147.
28. Felsenstein J: PHYLIP - Phylogeny Inference Package (Version 3.2).
Cladistics 1989, 5:164-166.
29. Thompson JD, Plewniak F, Poch O: BAliBASE: a benchmark alignment
database for the evaluation of multiple alignment programs. Nucleic
Acids Res 1999, 15:87-8.
30. Sonnhammer EL, Eddy SR, Durbin R: Pfam: a comprehensive database of
protein domain families based on seed alignments. Proteins 1997,
28(3):405-20.
31. Griffiths-Jones S, Moxon S, Marshall M, Khanna A, Eddy SR, Bateman A:
Rfam: annotating non-coding RNAs in complete genomes. Nucleic
Acids Res 2005:D121-4.
32. Loewenstein Y, Portugaly E, Fromer M, Linial M: Efficient algorithms for
accurate hierarchical clustering of huge datasets: tackling the entire
protein space. Bioinformatics 2008, 24(13):i41-i49.
33. Larkin MA, Blackshields G, Brown NP, Chenna R, McGettigan PA, McWilliam
H, Valentin F, Wallace IM, Wilm A, Lopez R, Thompson JD, Gibson TJ,
Higgins DG: Clustal W and Clustal X version 2.0. Bioinformatics (Oxford,
England) 2007, 23(21):2947-2948.
doi: 10.1186/1748-7188-5-21
Cite this article as: Blackshields et al., Sequence embedding for fast con-
struction of guide trees for multiple sequence alignment Algorithms for
Molecular Biology 2010, 5:21
Received: 12 February 2010 Accepted: 14 May 2010
Published: 14 May 2010
This article is available from : http://www.a lmob.org/conten t/5/1/21© 2010 Blackshields et al; licensee BioMed Central Ltd. This is an Open Access article distributed under the terms of the Creative Commons Attribution License ( ), which permits unrestricted use, distribution, and reproduction in any medium, provided the original work is properly cited.Algorithms for Molecular Biology 2010, 5:21