Báo cáo sinh học: "A new, fast algorithm for detecting protein coevolution using maximum compatible cliques" pptx
Bạn đang xem bản rút gọn của tài liệu. Xem và tải ngay bản đầy đủ của tài liệu tại đây (671.74 KB, 9 trang )
RESEARC H Open Access
A new, fast algorithm for detecting protein
coevolution using maximum compatible cliques
Alex Rodionov
1*
, Alexandr Bezginov
2
, Jonathan Rose
1
and Elisabeth RM Tillier
2,3*
Abstract
Background: The MatrixMatchMaker algorithm was recently introduced to detect the similarity between
phylogenetic trees and thus the coevolution between proteins. MMM finds the largest common submatrices
between pairs of phylogenetic distance matrices, and has numerous advantages over existing methods of
coevolution detection. However, these advantages came at the cost of a very long execution time.
Results: In this paper, we show that the problem of finding the maxim um submatrix reduces to a multiple
maximum clique subproblem on a graph of protein pairs. This allowed us to develop a new algorithm and
program implementation, MMMvII, which achieved more than 600× spee dup with comparable accuracy to the
original MMM.
Conclusions: MMMvII will thus allow for more more extensive and intricate analyses of coevolution.
Availability: An implementation of the MMMvII algorithm is available at: />MMMWEBvII/MMMWEBvII.php
Background
An important problem in evolutionary biology is the
comparison of phylogenetic trees [1]. Tree comparisons
have been performed to establi sh the accuracy of phylo-
geny building methods [2-4], to determine inconsisten-
cies between the phylogenetic history of different genes
and thus determine horizontal transfer of genes between
species [5,6] , to find orthologo us genes [4] and to iden-
tify genes that coevolve [7,8]. Some classical methods
only comp are tree topologies and the problem has been
to identify an appropriate distance measure which
describes the branch rearrangements to transform one
tree into another. However most applications, which
aim to find correlated rates of evolution, require the
comparison measure to also consider differences in
branch lengths between the trees compared.
In the case of determining co evolution, where it is
required that two independent genes have correlated
rates of evolution, the con sideration of branch lengths is
critical. Proteins that interact with one another affect
each others’ rate of evolution such that these are more
likely to evolve with correlated rates – a process known
as coevolution. Proteins that coevolve have similar evolu-
tionary histories, in terms of both the tree topology and
correlated branch lengths, and this can be leveraged to
predict which proteins interact.
The detection of coevolution thus requires gauging
the similarity of two phylogenetic histories. A number
of methods h ave been developed to detect coevolution,
such as the mirror tree [7,9-12] approach. This techni-
que compares the evolutionary histories of two families
of homologous proteins. However, the phylogenetic
trees are not directly compared. Rather, the evolutionary
history of each family is quantified by calculating a phy-
logenetic distance matrix, which determines the genetic
distance between every pair of proteins in the family.
The distances are deter mined from the multiple
sequence alignment (MSA) of the sequences . Interacting
protein partners between the two families are identified
by maximizing the statistical correlation between their
distance matrices.
A distance matrix is an indirect representation of a
family’s phylogenetic tree. Other approaches compare
these trees directly [8] and our own earlier program
* Correspondence: ;
1
The Edward S. Rogers Sr. Department of Electrical and Computer
Engineering, University of Toronto, Toronto, Canada
2
Department of Medical Biophysics, University of Toronto, Toronto, Canada
Full list of author information is available at the end of the article
Rodionov et al. Algorithms for Molecular Biology 2011, 6:17
/>© 2011 Rodionov et al; licensee BioMed Central Ltd. This is an Open Acce ss article distributed under the te rms of the Creative
Commons Attribution License ( which permits unrestricted use, distribution, and
reprodu ction in any medium, provided the original work is properly cited.
Codep [13] compares the multiple sequence alignments
to measure the coevolution signal.
The drawbacks of these previous approaches include
the requirement that the two protein families be the
same size, such that the composition of the protein
families must be pre-processed beforehand either by
careful screening [7] or by random sampling [9,13]. This
means that the inclusion of paralogs (which lead to mul-
tiple possibilities for interaction partners) is not handled
well. The methods also make the assumption that the
protein families have coevolved throughout the entire
evolutionary history of the sequences considered.
We recently proposed MatrixMatchMaker (MMM)
[14,15], an alternative algorithm that addresses these
issues. As in the m irror tree approaches, MMM uses the
distance matrices of the protein families as input. Instead
of using statistical correlation to detect coevolution,
MMM searches for pairs of submatrices that are similar
(one being a scaled version of the other) within a toler-
ance. These similar submatrices represent similar phyloge-
netic subtrees, and identify the proteins involved in similar
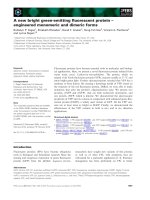
parts of the two families’ evolutionary histories (Figure 1).
The advantages of the MMM approach are that:
1. The initial distance matrices can be of different
sizes, allowing protein families with unequal num-
bers of homologues t o be interrogated for
coevolution.
2. The algorithm is able to discover coevolution in
any subset of the evolutionary history of the
proteins.
3. All possible solutions are returned, allowing coe-
volution between specific or multiple paralogues to
be discovered.
The approach was shown to increase the acc uracy
over mirror tree approaches. This is partly due to the
reduced sensiti vity of MMM to artifacts stemming from
the assembly of protein families which can strongly
affect the Pearson correlation score [14] that mirror tree
methods use to correlate two distance matrices. MMM
is also less sensitive to false positive determination of
coevolution due to long internal branches shared
between two trees with highly divergent species. This
strong phylogenetic signal will result in a large Pearson
correlation of the distance matrices, but is not strong
evidence for functional coevolution. Our approach
requires all distances to match in the solution which
results in higher accuracy.
MMM thus is a better method for predicti ng coevolu-
tion than the mirror tree approach, however this comes
at the cost of having to solve a much more computa-
tionally demanding combinatorial problem; because all
submatrices of each family must be considered, the
search space is exponential in size.
In this paper we present a no vel approach for finding
the set of largest similar submatrices. This new algo-
rithm (MMMvII) solves the problem of finding the max-
imum submatrices exactly, and is rendered much faster
than MMM by expressing the problem as a series of
maxim um clique pro blems, and leveraging existing effi-
cient techniques to solve them.
Methods
To compare the accuracy and performance of MMMvII
to those of the original MMM an evaluation data set
comprised of pairs of distance matrices was compiled
using the OMA d atabase [16]browser.
com.
We obtained all eukaryotic clusters from the OMA
version dated October 2010 and re-clustered them via
CD-HIT [17] at an
80% sequence identity threshold in order to merge the
paralogous clusters, possibly resulting in species being
represented multiple times. The biological reasonable-
ness of this clustering approach for predicting protein-
protein interactions has not yet been validated and will
be investigated elsewhere. Our purpose here was to cre-
ate a large dataset of difficult problems on which we
could compare the performance of the algorithms.
Multiple sequence alignments (MSA) were obtained
on each resulting cluster using MAFFT 6.716b [18]
Next, the dis-
tance matrices for each alignment were created w ith
Protdist 3.69 [19]hington.
Figure 1 Example of coevolution of two protein families.
Although MMM makes use of distance matrices, we can illustrate
the solution sought by considering the phylogenetic trees of two
protein families A and B. The sequences from a3, a4 and a5 would
match with the corresponding proteins b3, b4 and b5 by the MMM
algorithm because the subtree of those sequences in A is only
different from the corresponding subtree in B by a scaling factor in
the branch lengths. With a strict tolerance, sequences from species
1 and 2 would not contribute to the match, as the relative branch
lengths to the other sequences are very different.
Rodionov et al. Algorithms for Molecular Biology 2011, 6:17
/>Page 2 of 9
edu/phylip/progs.data.prot.html modified to allow sele-
nocysteine and pyrolysine amino acids and for identical
sequences to have a distance of 0.0 (Protdist originally
sets these to 0.00001).
Finally, we compiled a set including all-by-all pairwise
combinations of matrices that shared at least 30 species
in common (17,969,452 pairs).
All MMM experiments described here were conducted
on a cluster of 72 Intel Xeon processors at 3.06 GHz
with 2 GB of RAM available to each.
Initially, the entire data set was processed using the
original MMM with the threshold parameter a set to
0.1. However, during the allotted time (2 months) it was
able to complete the analysis of only 819,014 pairs. As a
result, all ensuing comparisons with MMMvII were per-
formed only on these pairs.
Due to the increasing relative error for shorter times,
only the 26368 pairs for which the time of MMM runs
was at least 5 seconds were considered (for the excluded
pairs the MMMvII time never exceeded 0.15 seconds).
The accuracy of prediction of known protein-protein
interactions was compared for the two algorithms as in
[14]. Instead of using multiple individual databases of
protein interactions, we used the iRefIndex database
[20], since it comprehensively
compiles protein interaction data from multiple public
databases in a non-redundant manner.
Results and Discussion
Problem Formulation
Given two families of homologous proteins A and B,we
would like to predict the likelihood of interaction
between them by detecting the number of coevolving A-
to-B protein pairs. Let A ={a
1
, a
2
, ,a
n
}andB ={b
1
,
b
2
, , b
m
} be the two protein families in question, which
can, in general, be of unequal size.
Consider a set M of k protein pairs
{(a
i
1
, b
j
1
), (a
i
2
, b
j
2
), , (a
i
k
, b
j
k
)
}
, which pairs up k proteins
from A with k proteins from B in a one-to-one fashion.
If both proteins in every pair in M have similar evolu-
tionary histories, then we say that M forms a match of
size k. The size of the largest possible match given A
and B indicates the amount of coevolution between the
families.
The set of pairwise phylogenetic distances between all
the A proteins in M ca n be thought of as representing
the evolutionary history of those proteins, via sum s of
branch lengths in an implied phylogenetic tree. A set of
A-to-B protein pairings also implicitly pairs up the asso-
ciated distances between the A prot eins with the dis-
tances between the B proteins. If the distances between
all the B proteins in M are equal to that of their paired
A distances multiplied by a common scale factor, then
the two histories are considered similar and M will be a
match. This condition will now be further defined with
more notational precision.
Let d(p, q) be the phylogenetic distance between any
two proteins p and q from the same family. Given two
A-to-B protein pairs (a
u
, b
x
)and(a
v
, b
y
), define the
ratio of p aired distances (RPD) fo r those two pairs as R
(a
u
, b
x
)(a
v
, b
y
)=d(a
u
, a
v
)/d(b
x
, b
y
). In the ideal case, if
M is a match of size k then all k-choose-2 RPDs would
have the same value, indicating that the A distances are
ascaledcopyoftheirpairedB distances. However, we
must add some tolerance in order to accept matches
that deviate slightly from this ideal scaling.
This tolerance is controlled by a parameter a Î [0, 1],
with 0 requir ing all RPDs be exactl y the same value and
1 placing no restrictions on values amongst RPDs. Using
this parameter, we define that two RPDs R
1
and R
2
are
compatible if:
R
1
·
1
δ
≤ R
2
≤ R
1
· δ with δ =
1+α
1 − α
Note that if R
1
is compatible with R
2
then R
2
is also
compatible with R
1
. Using this definition of compatibil-
ity, we can now more precisely state that M forms a
match if every pair of RPDs between its k protein pairs
is compatible. Additionally, when these are specified, we
can only allow proteins from the same species to be
paired within a match. Only nonzero phylogenetic dis-
tances are considered.
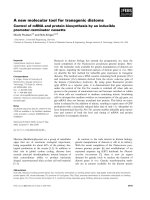
As an example, consider two triplets of proteins: {a
2
,
a
3
, a
5
} ⊆ A and {b
3
, b
7
, b
8
} ⊆ B, w ith corresponding
phylogenetic distances d
1
through d
6
, as depicted in Fig-
ure 2. If d
1
/d
4
≈ d
2
/d
5
≈ d
3
/d
6
, under a given a, then we
consider the set of protein pairs {(a
2
, b
3
), (a
3
, b
7
), (a
5
,
b
8
)} to form a match of size 3, with each pair represent-
ing two coevolving proteins.
The discussion so far has concerned the determination
of whether or not some set of protein pairs forms a
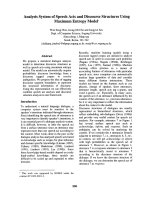
match. We can now use a similar representation as in
Figure 3 to represent the original coevolution problem:
given the input families A and B,findthesizeofthe
largest possible match.
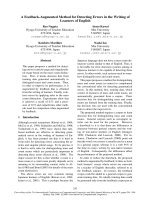
Here, we introduce the concept of a compatibility
graph, an example of which is shown in Figure 4. In this
Figure 2 Example showing two triplets of proteins and the
phylogenetic distances between them.
Rodionov et al. Algorithms for Molecular Biology 2011, 6:17
/>Page 3 of 9
graph, there are up to n × m vertices, representing all
possible A-to-B protein pairs. Edges exist between every
two vertices that could ever appear together in an y
match, and are labeled with the corresponding RPD for
that pair of vertices. This connectivity results in a very
dense graph, with an edge between any two vertices
except when the corresponding RPD has a zero distance
in either its numerator or denominator. As a result, no
edges exist between any two vertices in the same row or
column, because the A or B d istanc es within the corre-
sponding RPD would be zero.
For an edge e connecting two vertices u and v in the
compatibility graph, R(e)andR(u)(v) both equivalently
refer to the RPD between the two protein pairs repre-
sented by u and v. Furthermore, two ed ges are said to
be compatible if their RPDs are compatible.
In graph terminology, a set of vertices forms a clique if
every pair of vertices in the set is connected by an edge.
Under the graph-based representation of the coevolution
problem, matches are cliques in the compatibility graph
whose edges are all pairwise compatible. Therefore the
solution to the problem of finding the largest match size
is to find the size of the maximum cliques of the com-
patibility graph whose edges are also all pairwise compa-
tible. This approach solves the c oevolution problem
exactly.
Algorithm
In this section, we present the MMMvII algorithm that
solves the problem posed above.
The input to the algorithm is the compatibility graph
G =(V,E) constructed from two protein families A and
B, along with a tolerance a Î [0, 1]. The output will be
the set of all the matches of largest size, with each
match representing one possible configuration of coevol-
ving protein pairs.
Before de scribing the algo rithm, we requi re a new
definition. Given the tolerance a,anRPDR
1
is forward-
compatible with R
2
if:
R
2
≤ R
1
≤ R
2
· δ with δ =
1+α
1 − α
This is similar to the definition of compatibility
between two RPDs, except “ one-sided”, such that if R
1
is
forward-com patible with R
2
then R
2
cannot be forward-
compatible with R
1
unless R
1
= R
2
.Twoedgesarefor-
ward-compatible if their RPDs are forward-compatible.
In any given set o f edges, there exists at least one edge
with the smallest RPD value among all of them, called
the edge of minimum RPD forthatset.Aresult,which
can be easily derived, is that if every edge in a set is for-
ward-compatible with the set’sedgeofminimumRPD,
then every pair of edges is mutually compatible (assum-
ing the same value of a).
In the algorithm to be described, we will use t his
result to help find the largest matches. For each edge in
the compatibility graph, we will assume that that edge is
theedgeofminimumRPDofsomesetofedges,and
then “work backwards” to find that set. All the edges in
each set are then guaranteed to be pairwise compatible.
At that point, we find the maximum clique s of each set,
which form matches of maximum size.
The outer loop of the algorithm iterates over all ver-
tices v
i
in G. For each v
i
, we buil d a list of its neighbour
Figure 3 Graph-based representation of the example in Figure
2. Vertices represent protein pairs, and edges are labeled with the
RPD for the pairs they connect. Arrows indicate the pairs of RPDs
that must be compatible in order to satisfy the conditions for
forming a match.
Figure 4 Example compatibility graph. Example compatibility
graph for two protein families A ={a
1
a
6
} and B ={b
1
b
5
}.
Circles are vertices representing an a
i
to b
j
protein pair from
matching species. The grey vertices are pairs that will form a match
of size 5 if all 10 connecting edges (also in grey) are compatible
with each other. Edges between vertices not included in the
maximum clique are omitted for clarity.
Rodionov et al. Algorithms for Molecular Biology 2011, 6:17
/>Page 4 of 9
vertices, which are sorted in ascending order of the
RPDs of their edges to v
i
(Figure 5).
After choosing v
i
, another loop iterate s over all ver-
tices v
j
in the sorted neighbour list. We consider only
those v
j
where j >i, in order to avoid visiting the edges
in G twice. The edge between v
i
and v
j
is denoted e
min
,
which will be the edg e of minimum RPD for the
remainder of this inner v
j
loop. This step of the algo-
rithm is shown in Figure 6.
The next step, shown in Figure 7, builds the vertex set
of a subgraph of G that we call H. It walks through the
sorted neighbour list, considering all vertices v
k
ahead of
v
j
in the list for inclusion in H.Eachv
k
is tested to se e
whether both its edges to v
i
and v
j
are forward-compati-
ble with e
min
. This condition is necessary for v
k
to be
part of the same match as v
i
and v
j
. Note that because
v
i
’s neighbour list is sorted by RPD of the edge to v
i
, the
walking of the neighbour list in this step can be termi-
nated early once one v
k
is found whose edge to v
i
is no
longer forward-compatible with e
min
.Finally,ifR(v
i
)(v
k
)
or R(v
j
)(v
k
) are equal to R(e
min
), then v
k
is only included
in H if k >i. This extra check prevents duplication of
results in later choices of v
i
.
Having crea ted the vertex set of H ,wenextformthe
edge set. An edge in H exists between every pair of distinct
vertices (v
x
, v
y
) where R(v
x
)(v
y
) is forward-compatible with
R(emin). However, if R(v
x
)(v
y
)=R(e
min
), then we also
require that the indices x and y must both be greater than
the index i of v
i
foranedgetoexist.Thispreventsthe
algorithm from duplicating results in future iterations of v
i
.
With H formed, its maximum cliques are found. For
the purposes of our algorithm, any exact (optimal) maxi-
mum clique finding algorithm will suffice. We used
Östergård’s algorithm [21], modified to give all cliques
of maximum size instead of just exiting after one. How-
ever, if one only wishes to find the size of the largest
matches in G along with just one of the matches
(instead of all of them), then this modification is not
necessary and faster performance can be obtained. We
implemented this option as well (’maxtrees = 1’ option).
Each of the maximum cliques returned is a match,
since all the edges in H were made to be mutually com-
patible by construction. Vertices v
i
and v
j
are also added
to every returned match. This is possible because there
exist edges from every clique member to v
i
and v
j
,and
those edges are compatible with the rest of the match’s
edges - again true by construction of H. This concludes
the final series of steps, starting f rom the construction
of H’s edge set, shown in Figure 8.
This set of matches represents the largest matches
possible in G that are constrained to have v
i
and v
j
as
members. The final step is then to continue iterating
over all remaining v
i
and v
j
, collecting the matches from
each iteration and keeping only the globally largest ones,
which yield the solution to the entire problem. If during
anychoiceofv
j
it can be guaranteed that the matches
that will result from this iteration are to be smaller than
the current best match size, then the cur rent v
j
can be
abandoned. For example, one can count the number of
vertices in H after Step 3, and if this number plus two
(for v
i
and v
j
) is smaller than the current best match
size, then it is pointless to proceed further with that H.
Some tighter bounds are described in [22].
Figure 5 St ep 1. After choosing vertex v
i
(white dot), its
neighbours (black dots) are sorted in ascending order of the RPDs
of their edges to v
i
.
Figure 6 Step 2. After choosing a vertex v
j
from the sorted
neighbour list, the edge from v
i
to v
j
is declared to be e
min
- the
current edge of minimum RPD.
Figure 7 Step 3.Verticesaheadofv
j
in the sorted neighbour list
are found whose edges to both v
i
and v
j
are forward-compatible
with e
min
(solid edges). These vertices, shown in grey with a check
beside them, form the vertex set of the subgraph H. Vertices in the
sorted list which fail this test, due to the presence of one or more
non-forward-compatible edges (dashed) are indicated with an X.
Vertices to the right of the sorted list automatically fail the test -
their edges to v
i
have RPDs greater than R (e
min
)·δ and therefore are
not compatible with e
min
due to the sorting of RPDs performed
earlier.
Rodionov et al. Algorithms for Molecular Biology 2011, 6:17
/>Page 5 of 9
As a note on algorithm complexity, there are O(|V|
2
)
edges in G, and each edge creates an instance of a maxi-
mum clique problem, which is a well-studied NP-hard
problem [23]. Since MMMvII requires exact solutions to
these maximum clique subproblems, its worst-case time
complexity is exponential. However, the actual perfor-
mance of an efficient maximum clique algorithm
depends on the structure of the input graph. Pseudo-
code for the algorithms are given in Additional file 1.
MMMvII still solves (with minor differences) the same
problem as MMM in an exact manner, meaning both
algorithms must have NP-hard worst-case characteristics
and could potentially perform equally poorly. Therefore,
MMMvII’s significantly better measured performance
compared to MMM (which we will show) implies that,
in practice, the maximum clique problems generated by
MMMvII do not actually exhibit the worst-case expo-
nential behaviour.
Differences with MMM
The original MMM algorithm iterates through all possi-
ble matches of size 3 in an exhaustive fashion, ordered
by protein indices within A and B, with an early exit if
the number of remaining proteins in the loop cannot
exceed the size of the largest matches found so far. A
recursive subroutine attempts to expand an existing
match by including a new pair of proteins. For each
protein pair, it must be determined whether o r not its
inclusion in the existing match results in a new, larger
match. In this algorithm, this step is done by testing for
all matches of size 3 that are created by the inclusion of
the new protein pair. Each triplet to be checked contains
the new protein pair and two other protein pairs in the
existing match. The mutual compatibility test must pass
for all such triplets. If the addition of a protein pair suc-
cessfully creates a new, larger match, a recursive call is
made to furt her expand the match until all protein pairs
have been iterated through. At each level of recursion,
the list of matches is updated if the current match
matches or exceeds the current record for the largest
match. Only the largest matches are kept, which become
the output of the algorithm.
This triplet-based check is not an exact test of com-
patibility within the new match, and is an approximate
heuristic designed to be fast rather than exact. The
rationale behind designing this algorithm was that a full
compatibility test of the new match would require every
ratio of paired distance to be checked against every
other ratio of paired distances – an operation whose
time complexity scales to the fourt h power of the num-
ber of protein pairs in the match. This approximate tri-
plet-based compatibility check only scales to the second
power. As such, the original approach may give false
positives and not exactly solve the coevolution problem.
While MMM and MMMvII both solve the same funda-
mental coevolution problem, they diverge in their criteria
for deciding whether or not a given set of A-to-B protein
pairs have similar evolutionary histories. Thus, the results
from both algorithms may, in principle, differ when given
thesameinputs.DespiteMMMvII’snewgraph-based
view of the coevolution problem (which MMM lacks),
the different coevolution criteria can still be explained
intuitively using MMMvII terminology. Given a set of 3
protein pairs, both MMM and MMMvII will always agree
on whether or not that set forms a match - their beha-
vior for triplets of pairs is identical. However, for a set of
k > 3 protein pairs, MMM takes every possible triplet of
pairs from that set and tests if it forms a match of size 3.
This is in contrast with MMMvII which provides an ele-
mentary definition for matches of size greater than 3 that
does not recursively depend on the definition of a match
of size 3. The result is that for all k ≥ 3, an MMMvII
match also forms an MMM match. This is because any
subset of protein pairs of an MMMvII match also forms
an MMMvII match. Since subsets of size 3 are treated
identically by MMM and MMMvII, all triplets of an
MMMvII match will be MMM matches, and thus the lar-
ger match will be an MMM match as well. This relation-
ship does not hold in general in the opposite direction -
an MMM match of size k > 3 is not necessarily an
MMMvII match. Hence, we say that MMMvII has a
stricter definition of a match than MMM, and will return
a subset of its results. However, we will present results
that show that, in practice, these different criteria result
in negligible differences in terms of the maximum sub-
matrix size obtained between MMM and MMMvII.
Performance
The implementation of stricter submatrix matching is
the only difference between MMMvII and the original
MMM algorithm which could affect the size of the
resulting submatrices (the MMM score), which we
would expect to be lower at the same tolerance para-
meter a. More dangerously, this effect would be most
Figure 8 Step 4. The edge set of H is constructed, and includes all
possible edges between the vertices of H that are forward-
compatible with the current e
min
. After finding all the maximum
cliques of H, v
i
and v
j
are appended to each maximum clique, and
considered in the set of largest matches for the entire problem.
Rodionov et al. Algorithms for Molecular Biology 2011, 6:17
/>Page 6 of 9
profound in higher scores, which in turn are the most
important for the data analysis. Thus, in order to
account for any effects of this systematic difference on
either accuracy and/or performance, a series of
MMMvII runs were performed to identify the tolerance
parameter a which would make the total sum of
squar ed scores as close as possible to the original distri-
bution of scores. Since an a = 0.1 was previously
empirically determined to work well for the prediction
of protein-protein interactions [14,15], we found the
slightly more relaxed tolerance of a =0.108was
required for MMMvII. Indeed, the absolute differences
of scores produced by MMMvII at a = 0.1 can be as
high as 4, whereas at a = 0. 108 the differences are gen-
erally lower, and never exceed 2 (Figure 9). These differ-
ences in score were too slight to produce any difference
in the overall accuracy of protein interaction predictions.
The recursive nature of the MMM algorithm is such
that solutions with higher score will take more time to
compute than small solutio ns, and MMMvII would be
expected to be faster due to the stricter matching
requirement and smaller scores. We thus compared two
programs at their equivalent tolerance values. T he
speedups (oldtime/newtime) of MMMvII (a =0.108)
againsttheoldMMMalgorithm(a =0.1)rangedfrom
42× to 2, 198, 568× in individual pairs, with a geometric
mean speedup of 639× and total run time for the whole
dataset being reduced by 41, 105×. In comparison, for
MMMvII executed with a=0.1, the geometric mean
speedup was even higher at 710×, and the total total
run speedup at 47, 010×. Therefore, the stricter match-
ing implemented in the MMMvII algorithm does indeed
result in faster running times. However, this effect is
only moderate, and when using the adjusted tolerance
parameter, MMMvII is still much faster than the origi-
nal implementation. Importantly, the higher speedup
values corresponded to the pairs that had required very
long execution times when using the original MMM
program (Figure 10). Thus, the performance improve-
ment of the MMMvII over the original MMM has a
drastic effect on reducing the total running time.
An additional performance gain can be achieved by
allowing the program to avoid returning multiple solutions
and instead return only the MMM score and a single sub-
matrix solution (’maxtrees = 1’ option). This feature is use-
ful for large scale applications, where coevolving pairs with
high scores need to be identified ra pidly, wit hout consid-
eration of all the possible solutions. While keeping the tol-
erance at a = 0.108, this optimization gave an even higher
speedup for both geometric mean: 876×, and the total run-
ning time: 64, 653× (Figure 10).
Conclusion
We have presented an improved algorithm for detecting
coevolution between clusters of homologous protein
sequences. The MMMvII algorithm reformulates
Figure 9 Ac curacy.PlottedisthefrequencyoftheabsolutedifferencebetweenthesizeofthelargestsubmatrixreturnedbyMMMvII(the
MMM score) versus that returned by the original MMM algorithm. The results show that the scores produced by MMMvII do not differ
substantially from those of the original MMM, particularly when the tolerance is slightly increased to compensate for the increased strictness of
the MMMvII algorithm.
Rodionov et al. Algorithms for Molecular Biology 2011, 6:17
/>Page 7 of 9
MMM’s original method of finding maximum common
submatrices into a graph-theoretical problem of finding
maximum similar cliques. While still being a recursive
algorithm, the MMMvII algorithm efficiently culls the
remaining search space at every recursion level, and
thus gave an average speedup of over 600 times for the
dataset we used. MMMvII retains the original intent of
MMM, that is to find the largest submatrix match
within a tolerance but does so more exactly by enforcing
the strict adh erence to this t olerance, removing the
approximations made by the original MMM.
The faster MMMvII algorith m permits the rapid analy-
sis of larger protein families incorporating more informa-
tion from the vast amo unt of sequence data being
generated.Theverylargedataset we assembled was
incompletely run with MMM in over two months. Those
runsitdidcomplete(5.5%oftheentiredataset),were
run in just half an hou r with the new program. MMMvII
also could manage the entire dataset in 67 hours on the
same hardware. MMMvII thus allows the investigation of
much larger d atasets, and those where the analysis
includes paralogous families. Although MMM did allow
for the consideration of paralogous families to dete ct
multiple interactions, the ori ginal approach was too slow
to be practicable. MMM vII will thus allow for more
extensive and intricate analyses of coevolution. As a gen-
eral tool for measuring the similarity b etween phylog e-
netic trees and distance matrices, the MMM algorithm
could also be used in other areas in comparative geno-
mics and computational sequence analysis.
Additional material
Additional file 1: Pseudocode for MMMvII. Pseudocode for the
MMMvII algorithm, including the modified Östergård procedures.
Acknowledgements
We would like to thank Henry Wong for the inspiration behind the ‘edge of
minimum ratio’ concept. This research was funded in part by the Ontario
Ministry of Health and Long Term Care. The views expressed do not
necessarily reflect those of the OMOHLTC. ERMT holds a Canada Research
Chair in Analytical Genomics.
Figure 10 Speedup of MMMvII over original MMM.
Rodionov et al. Algorithms for Molecular Biology 2011, 6:17
/>Page 8 of 9
Author details
1
The Edward S. Rogers Sr. Department of Electrical and Computer
Engineering, University of Toronto, Toronto, Canada.
2
Department of Medical
Biophysics, University of Toronto, Toronto, Canada.
3
Ontario Cancer Institute,
University Health Network, 101 College Street., Toronto, M5G 1L7, Canada.
Authors’ contributions
AR developed, designed and programmed the algorithm under the
supervision of JR and ERMT. AB prepared the sequence data for analysis,
performed the accuracy and speed tests and analyzed the results with ERMT.
All authors contributed to the writing and editing of the manuscript, and all
authors read and approved the final manuscript.
Competing interests
The authors declare that they have no competing interests.
Received: 12 September 2010 Accepted: 14 June 2011
Published: 14 June 2011
References
1. Felsenstein J: Inferring phylogenies Sunderland, Mass.: Sinauer Associates;
2004.
2. Robinson D, Foulds L: Comparison of phylogenetic trees. Mathematical
Biosciences 1981, 53(1-2):131-147.
3. Kuhner MK, Felsenstein J: A simulation comparison of phylogeny
algorithms under equal and unequal evolutionary rates. Mol Biol Evol
1994, 11(3):459-68.
4. Soria-Carrasco V, Talavera G, Igea J, Castresana J: The K tree score:
quantification of differences in the relative branch length and topology
of phylogenetic trees. Bioinformatics 2007, 23(21):2954-6.
5. MacLeod D, Charlebois RL, Doolittle FW, Bapteste E: Deduction of probable
events of lateral gene transfer through comparison of phylogenetic
trees by recursive consolidation and rearrangement. BMC Evol Biol 2005,
5:27.
6. Beiko RG, Hamilton N: Phylogenetic identification of lateral genetic
transfer events. BMC Evol Biol 2006, 6:15.
7. Pazos F, Valencia A: Similarity of phylogenetic trees as indicator of
protein-protein interaction. Protein Eng 2001, 14(9):609-614.
8. Jothi R, Kann MG, Przytycka TM: Predicting protein-protein interaction by
searching evolutionary tree automorphism space. Bioinformatics 2005,
21:241-250.
9. Ramani AK, Marcotte EM: Exploiting the Coevolution of Interacting
Proteins to Discover Interaction Specificity. Journal of Molecular Biology
2003, 327:273-284.
10. Sato T, Yamanishi Y, Horimoto K, Kanehisa M, Toh H: Partial correlation
coefficient between distance matrices as a new indicator of protein-
protein interactions. Bioinformatics 2006, 22(20):2488-2492.
11. Pazos F, Juan D, Izarzugaza JM, Leon E, Valencia A: Prediction of Protein
Interaction Based on Similarity of Phylogenetic Trees. Methods in
Molecular Biology 2008, 484.
12. Valencia A, Pazos F: Prediction of protein-protein interactions from
evolutionary information. Methods Biochem Anal 2003, 44:411-26.
13. Tillier ERM, Biro L, Li G, Tillo D: Codep: Maximizing co-evolutionary
interdependencies to discover interacting proteins. Proteins: Structure,
Function, and Bioinformatics 2006, 63(4):822-831.
14. Tillier ERM, Charlebois RL: The Human Protein Coevolution Network.
Genome Research 2009, 19(10):1861-1871.
15. Clark GW, Dar VN, Bezginov A, Yang JM, Charlebois RL, Tillier ER: Using
Coevolution to predict protein-protein interactions. In Network Biology.
Edited by: Emili A, Cagney G. New York: Humana press; 2011:.
16. Altenhoff AM, Schneider A, Gonnet GH, Dessimoz C: OMA 2011: orthology
inference among 1000 complete genomes. Nucleic Acids Research 2011,
39(suppl 1):D289-D294[].
17. Li W, Godzik A: Cd-hit: a fast program for clustering and comparing large
sets of protein or nucleotide sequences. Bioinformatics 2006,
22(13):1658-1659[ />18. Katoh K, Toh H: Recent developments in the MAFFT multiple sequence
alignment program. Brief Bioinform 2008, 9(4):286-98[ />alignment/software/].
19. Felsenstein J: Phylogeny Inference Package (Version 3.2). Cladistics 1989,
5:164-166[ />html].
20. Razick S, Magklaras G, Donaldson I: iRefIndex: A consolidated protein
interaction database with provenance. BMC Bioinformatics 2008, 9:405
[].
21. Östergård PRJ: A fast algorithm for the maximum clique problem. Discrete
Appl Math 2002, 120(1-3):197-207.
22. Rodionov A: Acceleration of Coevolution Detection for Predicting Protein
Interactions. Master’s thesis University of Toronto; 2011.
23. Karp RM: Reducibility Among Combinatorial Problems. In Complexity of
Computer Computations. Edited by: Miller RE, Thatcher JW. Plenum Press;
1972:85-103.
doi:10.1186/1748-7188-6-17
Cite this article as: Rodionov et al.: A new, fast algorithm for detecting
protein coevolution using maximum compatible cliques. Algorithms for
Molecular Biology 2011 6:17.
Submit your next manuscript to BioMed Central
and take full advantage of:
• Convenient online submission
• Thorough peer review
• No space constraints or color figure charges
• Immediate publication on acceptance
• Inclusion in PubMed, CAS, Scopus and Google Scholar
• Research which is freely available for redistribution
Submit your manuscript at
www.biomedcentral.com/submit
Rodionov et al. Algorithms for Molecular Biology 2011, 6:17
/>Page 9 of 9