Báo cáo y học: " Equipment review: Pulmonary uptake and modes of administration of inhaled nitric oxide in mechanically-ventilated patients" ppt
Bạn đang xem bản rút gọn của tài liệu. Xem và tải ngay bản đầy đủ của tài liệu tại đây (1.54 MB, 11 trang )
REVIEW
Equipment review: Pulmonary uptake and modes
of administration of inhaled nitric oxide in
mechanically-ventilated patients
Louis Puybasset, Jean-Jacques Rouby
17cc-2-1-009
Introduction
Inhaled nitric oxide (NO) is a selective pulmonary
vasodilator which reduces pulmonary artery pressure
and increases arterial oxygenation in patients with
adult respiratory distress syndrome (ARDS). Despite
these beneficial effects, inhaled NO has not yet been
shown to improve outcome. During artificial ventila-
tion, it can be administered in the downstream of the
ventilator into the inspiratory limb of the ventilatory
circuit, or can be mixed with oxygen and nitrogen in
the upstream part of the system. Because of its simpli-
city and low cost, administration into the inspiratory
limb is most commonly used in southern Europe,
whereas in the United States and northern Europe, the
system of administration into the upstream is more
popular. Each of these systems has its own advantages
and disadvantages.
Administration of inhaled NO into the upstream
of the ventilator
Principle
The technique of administration of NO into the
upstream of the ventilator was first developed in Scandi-
navia [1,2]. Mass-flow regulators are used to mix oxy-
gen, air and NO before their entry into the low pressure
inlet of the ventilator (NOMIUS system adapted to the
Siemen’s Servo 900 C ventilator). These flow meters are
precise but expensiv e. They have a variability of < 1%
from the set value. Each mass-flow regulator is con-
trolled by a microprocessor in order to obtain the
desired NO concentration at the point of entry into the
ventilator. Most of ten, a system measuring the delivered
NO concentration is associated.
Advantages
When NO is admi nistered into the upstream, the inter-
ior of the ventilator serves as a mixing chamber. As a
consequence, inspired NO concentration is stable in any
mode of ventilation [2,3]. In this system of administr a-
tion, inspired NO concentration does not depend on the
pattern of the flow of gas delivered by the ventilator, the
tidal volume or the I/E ratio. There is no risk of over-
dose due to momentary interruption of ventilation dur-
ing tracheal suctioning or a cute reduction of minute
ventilation when t he ventilator is in partial-suppo rt
mode [2,3]. Similarly, an accidental interruption of the
power supply to the ventilator does not result in an
overdose after the restoration of power. These are the
principal reasons for which this mode of administration
is recommended in North America an Scandinavia [3,4].
Disadvantages
The main disadvantage of this mode of administration is
the long contact time between NO and oxygen [5],
resulting in the formation of nitrogen dioxide (NO
2
).
Nitrogen dioxide is a toxic product causing bronchocon-
striction at concentrations bet ween 0.6 and 2 ppm, and
alveolo-capillary membrane damage at concentrations >
2ppm.ThequantityofNO
2
formed is proportional to
the contact time between NO and O
2
, the inspired oxy-
genfraction(FiO
2
) and the square o f the concentration
of NO [6]. As high inspired oxygen fractions are used in
acute respiratory distress syndrome (ARDS), administra-
tion of NO into the upstream of the ventilator can gen-
erate high concentrations of NO
2
. For this reason, it is
necessary to incorporate a sodalime canister in the
inspiratory circuit to eliminate NO
2
before the inspired
gas reaches the upper airways. The sodalime absorbs
about 75% of the NO
2
formed but less than 10% of the
NO administered. In cases of prolonged administration
of NO, it is necessary to change the sodalime at regular
intervals. A period of 3 days seems to be the longest
Surgical Intensive Care Unit, Department of Anesthesiology, La Pitié-
Salpêtrière Hospital, 47-89, Boulevard de I’Hôpital, 75013 Paris, France
Puybasset and Rouby Critical Care 1998, 2:9
©1998CurrentScienceLtd
duration of utilization permissible. The different absor-
ber systems commercially available are not equivalent in
their capacity to eliminate NO
2
while allowing the pas-
sage of NO [2,7,8]. It is necessary to evaluate each sys-
tem before its clinical usage and to monitor the actual
concentrations of NO delivered after the absorber [9].
Another potential problem is that the passage of NO
through a humidification chamber results in the dissolu-
tion of the gas in water with the formation of nitric acid
(a phenomenon that does not occur with heat moisture
exchangers) and in a decrease in the NO concentration
actually delivered to the patient [2]. However, in case of
prolonged administration, oxidation of the metallic
internal components of the ventilator by NO and NO
2
does not appear to be a major risk with this kind of
administration. The second disadvantage of this mode of
administration is the fact that mass-flow regulators are
expensive.
Administration of inhaled NO into the
downstream of the ventilator
Administration of NO into the downstream of the venti-
lator is common practice in France and so uthern Eur-
opean countrie s like Spain and Italy. In this case, NO is
administered into the proximal end of the inspiratory
limb o f the ventilator. Delivery directly into the trachea
or at the level of the Y-piece of the ventilatory circuit
should be avoided since high concentrations of NO and
NO
2
are generated at the point of delivery, with poten-
tial toxic effects on the tracheobronchial mucosa [2].
Some plastics absorb NO, therefore, the use of teflon
tubing to deliver NO from the cylinder to the point of
entry into the ventilatory circuit is recommended. Such
a tu be should also be used for the monitoring system. It
is also not advisable to administer NO at a humid site
since it dissolves in water to form nitric acid [2]. This is
the reason why NO should be delivered just after the
humidifier when one is present.
There are two different modalities for the administra-
tion of NO after the ventilator:
1. continuous administration by a calibrated nitrogen
flow meter mounted directly on the outlet of the NO
cylinder, and
2.sequential administration limited to the inspiratory
phase, necessitating the use of specialized equipment
that recognises the different phases.
These two systems are not comparable in their perfor-
mance since only sequential administration coupled
with controlled mechanical ventilation assures stable
inspired NO concentrations [3,10]. Continuous adminis-
tration, though simple and inexpensive, does not allow
homogeneous mixing of NO with the inspired gas [10].
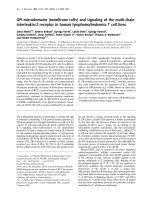
These diffe rences have been well evidenced by Imanaka
et al using a test lung model [3]. As illustrated by Fig 1,
these authors recorded a peak NO concentration which
was 10 times greater than the target concentration when
using continuous administration during volume-con-
trolled ventilation. In contrast, using sequential adminis-
tration, inspired NO was always similar to the target
concentration.
Continuous administration
Principle
This method of administration consists of delivering a
continuous flow of NO (regulated by a nitrogen flow
meter) into the proximal end of the inspiratory limb of
the ventilatory circuit. The flow i s constant, varying
between 50 and 2000 ml/min. The concentration in the
cylinder can vary fr om 225-2000 ppm. Users of this sys-
tem hypothesize that the NO mixes homogeneously
with the inspired gases coming from the ventilator and
apply the following formula to calculate the inspired
concentration of NO:
[NOinsp] = VNO × V
-1
× [NOcyl]
where [NOinsp] = inspired NO concentration; VNO =
flow of NO delivered from the cylinder; V = minute
ventilation coming from t he ventilator, and [NOcyl] =
NO concentration in the cylinder.
In practice, the desired concentration is obtained b y
adjusting the flow of NO as a function of the min ute
ventilation of the patient and the concentration o f the
cylinder.
Experimental evidence for the ‘bolus effect’
During continuous administration of NO in volume-
controlled ventilation, a constant flow of NO mixes with
a discontinuous flow of gas coming from the ventilator.
During the inspiratory phase, mixing of NO, oxygen and
nitrogen is homogeneous since each flow is constant.
During the expiratory phase, however, the flow from the
ventilator stops while the flow of NO persists. As a
result, NO accumulates in the proximal part of the
inspiratory limb. During the inspiratory phase of the fol-
lowing respiratory cycle, this ‘bolus’ is ‘flushed’ towards
the upper airways of the patient without having been
homogeneously mixed with the tidal volume. Using fast-
response chemilum inescence apparatus, this bolus effect
can be detected, and is indicated by a marked fluctua-
tion in NO concentrations within the inspiratory limb.
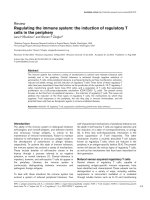
It is possible to demonstrate this phenomenon in a
lung model by using a l ong inspiratory limb and sam-
pling the gas from sites corresponding to differe nt mul-
tiples of tidal volume [10]. As shown in Fig 2,
concentrations of NO measured from sampling sites
corresponding to one and two tidal volumes are higher
than those measured from sampling sites corresponding
to half and one and a half tidal volumes, respectively.
The explanation for this ph enomenon is as follows.
Puybasset and Rouby Critical Care 1998, 2:9
Page 2 of 11
During inspiration, the bolus passes sampling sites at a
high velocity and cannot be measured adequately by the
chemiluminescence apparatus despite its fast response
time. In contrast, during the expiratory phase - with a
duration of 2.1 s - the NO bolus can be accurately
detected by the chemiluminescence apparatus. As a con-
sequence, the fluctuation of NO concentration at sites
corresponding to one and two tidal volumes is much
higher than a sampling sites corresponding to half and
one and a half tidal volumes. In addition, fluctuation of
Figure 1 Nitric oxide (NO) concentrations measuredinalungmodelwithdifferentsystemsofadministration during volume-control and
pressure-control ventilation. The NO concentration is measured at simulated midtrachea during (a) volume-control and (b) pressure-control
ventilation. The target NO concentration was 20 ppm. Thick and thin lines represent NO concentration measured using a fast and slow-response
analyser, respectively. The model simulates 100% NO uptake. Different modes of administration were tested: pre = administration before the
ventilator; ii = sequential administration into the inspiratory limb; iy = sequential administration into the Y-piece; ci = continuous administration
into the inspiratory limb; cy = continuous administration into the Y piece. Published with permission [3].
Puybasset and Rouby Critical Care 1998, 2:9
Page 3 of 11
Figure 2 Evidence for variations in NO concentrations within the inspiratory limb related to the bolus effect during continuous administration in
a lung model. Nitric oxide is administered into a lung model in a continuous mode after the ventilator. The inspiratory limb of the ventilator
consists of a 475 cm-long tube with a provision for sampling the gas at points corresponding to 0.5 (site 1), 1.0 (site 2), 1.5 (site 3) and 2.0 (site
4) tidal volumes. (a) Nitric oxide is administered from a 22.5 ppm cylinder. Concentrations at sampling sites corresponding to 1 and 2 tidal
volumes are higher than those from sites corresponding to 0.5 and 1.5 tidal volumes suggesting the existence of a bolus of NO moving in front
of the tidal volume. (b) Nitric oxide is administered from a 900 ppm cylinder. The bolus effect is less pronounced than with a 22.5 ppm cylinder.
There is no detectable bolus at the site corresponding to 2 tidal volumes, suggesting an early homogenization of the inspired gas. Published
with permission [10].
Puybasset and Rouby Critical Care 1998, 2:9
Page 4 of 11
NO concentration decreases at the most distal sampling
sites suggesting homogenization of the bolus during the
course of its movement down the inspiratory limb. The
magnitude of the bolus effect is also inversely related to
the NO concentration in the cylinder. Changing from a
22.5 ppm cylinder to a 900 ppm cylinder results in a
50-fold reduction in the volume of the bolus. Conse-
quently, fluctuation o f NO concentration is markedly
attenuated in the inspiratory limb probably because the
bolus is more rapidly homogenized in the tidal volume.
One of t he clinical implications of this observation is
that utilization of cylinders with high NO concentrations
minimizes the bolus effect in patients on inhaled NO
therapy.
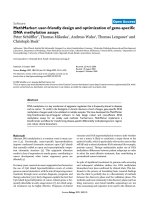
Distribution of NO concentrations
As shown in Fig 3, the concentration of NO fluctuates
in the inspiratory limb. This fluctuation, which can be
detected only by fast-response chemiluminescence appa-
ratus results from the passage of the bolus past the sam-
pling site for the inspired gas. As recently suggested,
even fast-response chemiluminescence may underesti-
mate rapid changes in NO concentrations [11]. If the
NO bolus is small and moves with a high ve locity, che-
miluminescence apparatus with a response time between
0.5 and 1.5 s may be unable to provide accurate mea-
surements of the true peak NO concentratio n. By u sing
CO
2
as a tracer gas and infrared capnography with a
response time of 350 ms, Stenqvist et al demonstrated
that fast-response chemiluminescence (response time of
1.5 s) underestimates true peak NO concentrations
when sampling at the Y piece during the inspiratory
phase [11]. If this fluctuation is measured at different
sites in the inspiratory limb, the peak concentration and
its phase in relation to the respiratory cycle vary
Figure 3 Nitric oxide concentrations recorded from the inspiratory limb and trachea in a lung model and a patient on artificial ventilation
during continuous administration. Panel A represents the variation in NO concentration in the inspiratory limb of the lung model; panel B
shows the variations in NO concentration at simulated tracheal level in the lung model; panel C shows the variations of NO concentration in the
inspiratory limb in the ventilated patient; panel D shows the variations of NO concentration in the trachea of the ventilated patient. In panels A
and B the lower trace represents the respiratory gas flow. In panels C and D the two lower traces represent expired CO
2
curves (end-tidal CO
2
is
equal to 25 mmHg) and respiratory gas flow. Nitric oxide concentrations were measured by fast-response chemiluminescence apparatus (NOX
4000 Sérès, Aix-en-Provence, France). The time delay of the apparatus was 2.4 s. Accordingly, the beginning of inspiration and expiration
(represented by arrows) is shifted 2.4 s to the right compared to the respiratory flow recording. Published with permission [10].
Puybasset and Rouby Critical Care 1998, 2:9
Page 5 of 11
significantly. As previously mentioned, this is because
the phase and the peak of the fluctuation are influenced
by the progressive mixing of the bolus with the inspired
gas, an d depend on the location o f the sampling site in
relation to the position of the bolus at the end of
inspiration. As a result of the bolus, peak concentrations
of NO are created within the inspiratory circuit which
can generate high levels of NO
2
[2]. It is likely that for
the same mean intratracheal NO co ncentration, contin-
uous administration generates higher NO
2
levels than
sequential administration where the inspired NO con-
centrations are stable.
As shown in Fig 4, the classical formula does not
allow a precise prediction of inspired NO concentra-
tions administered to the patient. The formula under-
estimates the inspired concentrations delivered to the
patient, thereby increasing the risk of overdose. This
unpredictability of the dose received by the patient
means that continuous administration can be utilized
only if fast-response chemiluminescence apparatus is
available for monitoring the NO concentrations. If
such equipment is available, it i s possible to measure
the actual tracheal NO concentration during the
inspiratory phase [12]. If slow-response chemilumines-
cence apparatus is used, only mean tracheal concentra-
tion can be measured, which underestimate s the actual
inspired NO concentration delivered to the patient by
about 50%.
Sequential administration
Principle
The objective of sequential administration is to limit the
administration of NO to the inspiratory phase s o that
the bolus effect is avoided. To obtain stable and repro-
ducible co ncentrations of NO in the inspiratory limb, it
is necessary that the gas flows from the ventilator and
the NO cylinder have the same pattern during inspira-
tion. During sequential administration in controlled ven-
tilatory mode with a constant inspiratory flow, a
continuous flow of NO is administered only during
inspiration. As shown in Fig 5, NO concentrations in
the inspiratory limb are fairly stable during seque ntial
administration both in the lung model and in patients.
Since a constant inspiratory flow is delivered from both
the NO cylinder a nd the ventilator, there is a homoge-
nous mixing of NO with the tidal volume.
At the tracheal level, NO concentration remains con-
stant in the lung model, whereas it fluctuates in patients
[13]. Identical ventilatory and NO equipment was used
in the lung model and in the patients, therefore, it can
be assumed that the observed differences in tracheal
NO con centra tions are related to the differences in the
distribution of volume or pulmonary uptake of NO.
The Opti-NO - advantages and disadvantages
The Opti-NO (Taema, Anthony, France) is a system
designed for sequential administration of NO into the
Figure 4 Correlation between measured (NO
MEAS
)andcalculated(NO
CALC
) inspiratory tracheal concentrations of NO during continuous
administration. The x-axis represents the inspiratory tracheal concentrations of NO measured by fast-response chemiluminescence apparatus. The
difference between the measured and calculated inspiratory tracheal concentrations is represented on the y-axis. The dark line in the center
represents the mean error. The dotted lines on either side represent the precision (± 2 SD). Calculated inspiratory tracheal NO concentrations
underestimate the actual inspiratory tracheal NO concentrations delivered to the patient. Published with permission [10].
Puybasset and Rouby Critical Care 1998, 2:9
Page 6 of 11
downstream of the ventilator [13] . It comprises one cir-
cuit for the detection of inspiration and another for the
administration of NO. The detection circuit senses the
pressure increase i n the inspiratory limb during inspira-
tion and opens a solenoid valve, allowing the adminis-
tration of NO more distally into the limb. The flow of
NO delivered is constant throughout the length of the
inspiratory phase. A s shown in Fig 6, the Opti-NO deli-
vers stable and reproducible concentrations as predicted
by the formula since NO and oxygen are mixed at con-
stant flow rates during the same period of time. To
attain a similar concentration, NO flow requirement is
lower during sequential mode compared to continuous
mode. The Opti-NO allows a reduction in the cost of
inhaled NO therapy.
However, this proto type device has some limitations.
Although in sequential mode it is capable of delivering
steady inspired concentrations during controlled
mechanical ventilation with constant ventilatory set-
tings, it i s not capabl e of maintaining a stable inspira-
tory NO concentration in the face of decelerating
inspiratory flow, changing tidal volumes and I/E ratios
such as occurs during pressure support ventilation,
intermittent mandatory ventilation, airway pressure
release ventilation and pressure-controlled ventilation
[3]. Its use in pressure-support ventilation, character-
ized by a decelerating inspiratory flow, results in a
non-homogenous mixing of NO during the inspiratory
phase and a significant fluctuation of inspiratory NO
concentration. As shown in Fig 7, any change in the
patient’ s inspiratory drive resulting in variations in
tidal volume, inspiratory flow and duration induced
fluctuation in inspiratory NO concentrations since the
NO flow delivered by the Opti-NO remained constant.
Therefore, the sequential mode provided by the Opti-
NO can be used only in association with controlled
and assisted-controlled mechanical ventilation with
constant inspiratory flow, but not with pressure-con-
trolled modes of ventilation. Furthermore, in patients
on control led ventilation, any change in ventilatory set-
tings requires a corresponding change in Opti-NO set-
tings in order to maintain a constant inspiratory NO
concentration. This can be achieved using the slide-
rule provided with the Opt i-NO which indicates the
inspiratory NO concentration predicted from the clas-
sical formula.
Figure 5 Nitric oxide concentrations measured from the inspiratory limb of the ventilatory circuit and the endotracheal tube in a lu ng model
and a patient on the artificial ventilation, during sequential administration. Panel A represents the variations in NO concentration in the
inspiratory limb in the lung model; panel B shows the variations in NO concentration at simulated tracheal level in the lung model; panel C
shows the variations in NO concentration in the inspiratory limb in the ventilated patient; panel D shows the variations in NO concentration in
the trachea of the ventilated patient. In panels A and B the lower trace represents the respiratory gas flow. In panels C and D the two lower
traces represent expired CO
2
curves (end-tidal CO
2
= 25 mmHg) and respiratory gas flow. Nitric oxide concentrations were measured by fast-
response chemiluminescence apparatus (NOX 4000 Sérès, Aix-en-Provence, France). The time delay of the apparatus was 2.4 s. Accordingly, the
beginning of inspiration and expiration (represented by arrows) is shifted 2.4 s to the right compared to the respiratory flow recording.
Published with permission [10].
Puybasset and Rouby Critical Care 1998, 2:9
Page 7 of 11
From the above comments, it follows that an ideal sys-
tem for delivering NO into the downstream of the venti-
lator should have the following characteristics:
1. it should be a sequential system delivering NO only
during the inspiratory phase o f the ventilato r with the
flow of NO synchronized with the flow signal of the
ventilator, and
2. the flow of NO should be regulated by a propor-
tional valve with a fast response time which, at any
given setting, maintains a constant ratio between the
flow of NO and ventilatory gas.
Such a set-up, which remains to be manufactured,
wouldensuresteadyandpredictableinspiredNOcon-
centrations and would represent an alternative to the
present systems of administration into the upstream of
the ventilator. It would also offer the advantage of not
generating high concentrations of NO
2
and obviate the
need for sodalime.
Factors influencing the pulmonary uptake of
inhaled NO in ARDS
Experimental data
The diffusion coefficient of NO for the alveolo-capillary
membrane is 3-5 times higher than that of carbon mon-
oxide [14]. Paradoxically, experimental evidence demon-
strates that in isolated animal lungs per fused with
Ringer’ s lactate, the uptake of NO is only 10% [15].
Suchalowpulmonaryuptake,despiteahighdiffusion
coefficient, results from its poor solubility in water.
When the isolated lung is perfused with blood instead
of Ringer’s lactate, more than 90% of the inhaled NO is
taken up [16]. The difference between the two experi-
mental models lies in t he presence of circulating hemo-
globin in the lungs perfused with blood. Because of the
high affini ty of NO for the heme moiety of hemoglo bin,
blood plays a key role in the clearance of NO as it
crosses the alveolo-capillary membrane.
From these experimental data it can be theoretically
assumed that the factors which influence pulmonary
uptake of NO are:
1. alveolar surface available for gas exchange;
2. perfusion of this alveolar surface, and
3. quantity of circulating hemoglobin.
Human data
As show n in Fig 5, when a sequential system of admin-
istration such as the Opti-NO is used in combinatio n
with controlled ventilation at a constant inspiratory
flow, NO concentrations are stable in the inspiratory
limb, whereas they fluctuate in the trachea. This fluctua-
tion, which is not seen in the lung model, reflects the
pulmonary uptake of NO. As shown in Figs 8 and 9, the
percentage fluctuation of tracheal NO concentra tion
(the difference between the inspired and expired NO
concentr ations divided by the inspired concentration) is
inversely proportional to the alveolar dead space a nd
directly proportional to the volume of normally aerated
pulmonary parenchyma in ARDS [13]. This is due to
Figure 6 Correlation between measured (NO
MEAS
)andcalculated(NO
CALC
) inspiratory tracheal concentrations of NO during sequential
administration. The x-axis represents inspiratory tracheal NO concentration measured by fast-response chemiluminescence apparatus. The y-axis
represents the difference between the measured and calculated inspiratory tracheal NO concentrations. The dark horizontal line represent the
mean error and the two dotted lines on either side represent the precision (± 2 SD). Calculated inspiratory tracheal concentrations are very close
to the measured inspiratory tracheal concentrations as indicated by a low bias and high precision. Published with permission [10].
Puybasset and Rouby Critical Care 1998, 2:9
Page 8 of 11
thefactthatonlytheperfused part of the ventilated
lung parenchyma takes part in the pul monary uptake of
NO [13]. It follows that the fluctuation of tracheal NO
concentration can serve as an index of the extent of
alveolar disease as well as the severity of pulmonary
hypoperfusion. Continuous monitoring of the fluctua-
tion of tracheal NO concentrations in a given patient
could thus be a reliable ‘marker’ of pulmonary functio n
during the course of ARDS [13].
Monitoring
Necessity
Nitric oxide is a potentially toxic gas. In humans, the
plateau concentration to o btain maximal effects on pul-
monary circulation and arterial oxygenation rarely
exceeds 5 ppm [12,17-20]. In 90% of adult cases,
maximal effect is obtained with inspired concentrations
between 3 and 5 ppm. Concentratio ns of NO >10 ppm
in 100% oxygen result in toxic levels of NO
2
[12]. Since
peak concentrations well above 10 ppm occur during
continuous administration, it is recommended to use
either sequential administration or to deliver NO before
the ventilator [13,21]. Despite the low risk of overdose
with these systems, an accidental increase in the
inspired NO and NO
2
conc entrations must be detected,
justifying the use of ventilator monitoring as an indis-
pensable complement to the administration of NO.
Which type of monitor?
Slow-response systems
Systems with a response time of >10 s are not suitable
for monitoring ventilatory fluctuations of NO
Figure 7 Variations in NO concentration in the inspiratory limb with a healthy v olunteer on pr essure support v entilat ion receiving NO by
sequential method. The subject breathed from the ventilator through an air-tight mask. Nitric oxide was administered in sequential mode by
the Opti-NO (Taema, Anthony, France). The Opti-NO settings corresponding to 3 ppm in the bellows of the lung model and a pressure support
of 10 cmH
2
O were utilized. Inspiratory NO concentrations were measured by fast-response chemiluminescence apparatus having a time delay of
2.4 s. The scale at the top of the recording indicates time (interval between two consecutive bars represents 1 s). From top to bottom, the traces
correspond to airway pressure, inspired NO concentration, expired tidal volume and respiratory flow. With the level of pressure support and the
settings of the Opti-NO remaining constant, inspired NO concentration varied by more than 200% as a function of varying tidal volume and
inspiratory time. A decrease in the tidal volume or an increase in the inspiratory time was associated with an increase in the inspired NO
concentration. Published with permission [10].
Puybasset and Rouby Critical Care 1998, 2:9
Page 9 of 11
conc entrations [3,12]. Electrochemical monitors and the
first generations [3,12]. Electrochemical monitors and
the first generation chemiluminescence monitors such
as the NOX 2000 (Ecophysics, Aix-en-Provence, France)
are examples of slow-response monitors. They can be
used during sequential administration to monitor NO
concentrations in the inspiratory limb since it is stable
[10]. During continuous administration they do not per-
mit measurement of the fluctuation s in concen tration in
theinspiratorylimborinthetracheaandhenceshould
not be used in this setting. Electrochemical monitors are
less expensive than chemiluminescence systems and
with regular calibration, their precision is good (within 1
ppm) [22].
Fast-response systems
An accurate assessment of the mixing of NO in the dif-
ferent parts of the ventilatory circuit requires fast-
response chemiluminescence apparatus [3,23]. Onl y sec-
ond g eneration chemiluminescence equipment, specifi-
cally designed for medical usage , have a response t ime
sufficiently rapid to permit measurement of inspired and
expired tracheal NO concentrations [12]. It is necessar y
to differentiate the response time of the apparatus from
the transit time for the gas to move from the sampling
site to the measuring chamber. As an example, NOX
4000 (Sérès, Aix-en-Provence, France) has a response
time of 735 ms. When the equipment aspirates the gas
sample at a flow rate of 1 l/min, the transit time is 2.4 s.
The NO signal is then displaced by 2.4 s in relation to
the flow signal (Fig 5). A display of tracheal NO concen-
tration on the monitor screen is available on the latest
chemiluminescence apparatus (EVA 4000, Sérès, Aix-en-
Provence, France) giving the possibility of continuously
monitoring the fluctuations in t racheal NO concen tra-
tion as an index of ‘ pulmonary function ’ during the
course of ARDS [13].
Conclusion
In 1998, inhaled NO should be administered in such a
way that stable and predictable concentrations in the
inspiratory limb are obtained. This can be performed by
administering NO either in the upstream of the ventila-
tor or directly into the proximal e nd of the inspiratory
circuit using a sequential system. In the former case,
NO concentrations will remain constant in any ventila-
tory setting whereas in the latter, any change in ventila-
tory parameter will impose corresponding changes in
Figure 8 Correlation between the alveolar deadspace and the
percentage of fluctuation of tracheal NO concentration (TRACH-NO)
while administering 6 ppm of NO to 11 patients with ARDS. There
is an inverse correlation between the two values suggesting that
the pulmonary uptake of NO decrease with an increase in the
alveolar dead space. Points 1 and 2 relate to one of the patients
who was studied twice: during the acute phase of ARDS (point 2
corresponding to an alveolar dead space of 37%) and during the
phase of recovery from ARDS (point 1 corresponding to an alvealor
dead space of 14%). Published with permission [13].
Figure 9 Correlation between the volume of normally-aerated
pulmonary parenchyma, expressed as a percentage of the total
lung volume and the percentage of fluctuation of tracheal NO
concentration (TRACH-NO) while administering 6 ppm of NO to 11
patients with ARDS. There is a significant correlation between the
two values suggesting that the pulmonary uptake of NO decreases
with a reduction of aerated lung volume. Points 1 and 2 relate to
one of the patients who was studied twice: during the acute phase
of ARDS (point 1 corresponding to a normally aerated lung volume
of 52%) and during the recovery phase of ARDS (point 2
corresponding to a normally aerated lung volume of 82%).
Published with permission [13].
Puybasset and Rouby Critical Care 1998, 2:9
Page 10 of 11
the NO flow. In the future, this drawback will be cor-
rected by the use of fast-responsetimevalves,adminis-
tering NO with a flow perfectly proportional to the one
delivered by the ventilator. Although constant NO con-
centrations are obtained in the inspiratory limb in both
modes of administration, fluctuations in NO concentra-
tion are observed at the tracheal site. This fluctuation is
due to the uptake of NO by the lung and is directly cor-
related to the volume of normally aerated lung and
inversely proportional to the alveolar deadspace. It can,
therefore, be considered as an index of ventilatory perfu-
sion ratio mismatch, and can be continuously monitored
in ARDS. In contrast, the continuous delivery of NO in
the inspiratory limb leads to unpredictable and fluctua t-
ing concentrations o f NO and must be considered as an
unsafe mode of administration, unless fast-response che-
miluminescence apparatus is used for monitoring.
Published: 12 March 1998
References
1. Stenqvist O, Kjelltoft B, Lundin S: Evaluation of a new system for
ventilatory administration of nitric oxide. Acta Anaesthesiol Scand 1993,
37:687-691.
2. Westfelt U, Lundin S, Stenqvist O: Safety aspects of delivery and
monitoring of nitric oxide during mechanical ventilation. Acta
Anaesthesiol Scand 1996, 40:302-310.
3. Imanaka H, Hess D, Kirmse M, et al: Inaccuracies of nitric oxide delivery
systems during adult mechanical ventilation. Anesthesiology 1997,
86:676-688.
4. Wessel DL, Adatia I, Thompson JE, Hickey PR: Delivery and monitoring of
inhaled nitric oxide in patients with pulmonary hypertension. Crit Care
Med 1994, 22:930-938.
5. Nishimura M, Hess D, Kacmarek RM, Ritz R, Hurford WE: Nitrogen dioxide
production during mechanical ventilation with nitric oxide in adults.
Effects of ventilator internal volume, air versus nitrogen dilution, minute
ventilation and inspired oxygen fraction. Anesthesiology 1995,
82:1246-1254.
6. Glasson WA, Tuesday CS: The atmospheric thermal oxidation of nitric
oxide. J Am Chem Soc 1963, 85:2901-2904.
7. Pickett JA, Moors AH, Latimer RD, Mahmood N, Ghosh S: The role of soda
lime during the administration of inhaled nitric oxide. Br J Anaesth 1994,
72:683-685.
8. Gilly H, Krebs C, Nowotny T: Reduction of NO
2
by a NO
2
-selective
scavenger. Acta Anaesthesiol Scand 1996, 40 (suppl 109):83-84.
9. Ishibe T, Sato T, Hayashi T, Kato N, Hata T: Absorption of nitrogen dioxide
and nitric oxide by soda lime. Br J Anaesth 1995, 75:330-333.
10. Mourgeon E, Gallart L, Umamaheswara Rao GS, et al: Distribution of
inhaled nitric oxide during sequential and continuous modes of
administration into the inspiratory limb of the ventilator. Intensive Care
Med 1997, 23:849-858.
11. Stenqvist O, Fredholm M, Mareels K, Foubert L, Lundin S: Mixing
conditions during nitric oxide administration evaluated with fast-
response chemiluminescence and capnography. Br J Anaesth 1996, 76
(suppl 2):A364
12. Lu O, Mourgeon E, Law-Koune JD, et al: Dose-response of inhaled NO
with and without intravenous almitrine in adult respiratory distress
syndrome. Anesthesiology 1995, 83:929-943.
13. Umamaheswara Rao GS, Gallart L, Law-Koune J-D, et al: Factors influencing
the uptake of inhaled nitric oxide in patients on mechanical ventilation.
Anesthesiology 1997, 87:823-834.
14. Borland CDR, Higenbottom TW: A simultaneous single breath
measurement of pulmonary diffusing capacity with nitric oxide and
carbon monoxide. Eur Respir J 1989, 2:56-63.
15. Yoshida K, Kasama K, Kitabatake M, Wakabayashi K, Imai M: Changing of
nitric oxide in the airway: experiment with model-airway and perfused
lung. Rep Environ Sci Mie Univ 1981, 6:57-61.
16. Yoshida K, Kasama K: Biotransformation of nitric oxide. Environ Health
Perspect 1987, 73:201-206.
17. Puybasset L, Rouby JJ, Mourgeon E, et al: Inhaled nitric oxide in acute
respiratory failure: dose-response curves. Intensive Care Med 1994,
20:319-327.
18. Mercer R, Costa D, Crapo J: Effects of prolonged exposure to low doses
of nitric oxide or nitrogen dioxide on the alveolar septa of the adult rat.
Lab Invest 1995, 73:20-28.
19. Lowson SM, Rich G, McArdle PA, Jaidev J, Morris GN: The response to
varying concentrations of inhaled nitric oxide in patients with acute
respiratory distress syndrome. Anesth Analg 1996, 82:574-581.
20. Mourgeon E, Puybasset L, Law-Koune J-D, et al: Inhaled nitric oxide in
acute respiratory distress syndrome with and without septic shock: a
dose-response-study. Critical Care 1997, 1
:25-39.
21. Krebs C, Escuyer M, Urak G, Zimpfer M, Germann P: Technological basis for
NO application and environmental security. Acta Anaesthesiol Scand 1996,
40 (suppl 109):84-87.
22. Moutafis M, Hatahet Z, Castelain MH, Renaudin MH, Monnot A, Fischler M:
Validation of a simple method assessing nitric oxide and nitrogen
dioxide concentrations. Intensive Care Med 1995, 21:537-541.
23. Grove ER, Beale R, Smithies M, Bihari D: Nitric oxide and ARDS. Anaesth
Intensive Care 1994, 22:312-313.
doi:10.1186/cc118
Cite this article as: Puybasset and Rouby: Equipment review: Pulmonary
uptake and modes of administration of inhaled nitric oxide in
mechanically-ventilated patients. Critical Care 1998 2:9.
Submit your next manuscript to BioMed Central
and take full advantage of:
• Convenient online submission
• Thorough peer review
• No space constraints or color figure charges
• Immediate publication on acceptance
• Inclusion in PubMed, CAS, Scopus and Google Scholar
• Research which is freely available for redistribution
Submit your manuscript at
www.biomedcentral.com/submit
Puybasset and Rouby Critical Care 1998, 2:9
Page 11 of 11