Báo cáo y học: " Invasive versus noninvasive measurement of allergic and cholinergic airway responsiveness in mice" doc
Bạn đang xem bản rút gọn của tài liệu. Xem và tải ngay bản đầy đủ của tài liệu tại đây (376.77 KB, 10 trang )
BioMed Central
Page 1 of 10
(page number not for citation purposes)
Respiratory Research
Open Access
Research
Invasive versus noninvasive measurement of allergic and cholinergic
airway responsiveness in mice
Thomas Glaab
1,2
, Michaela Ziegert
1
, Ralf Baelder
1
, Regina Korolewitz
1
,
Armin Braun
1
, Jens M Hohlfeld
1,2
, Wayne Mitzner
3
, Norbert Krug
1
and
Heinz G Hoymann*
1
Address:
1
Fraunhofer Institute of Toxicology and Experimental Medicine (ITEM), Nikolai-Fuchs Str.1, 30625 Hannover, Germany,
2
Hannover
Medical School, Department of Respiratory Medicine, Carl-Neuberg Str.1, 30625 Hannover, Germany and
3
Division of Physiology, Bloomberg
School of Public Health, Johns Hopkins University, Baltimore, Maryland 21205, USA
Email: Thomas Glaab - ; Michaela Ziegert - ; Ralf Baelder - ;
Regina Korolewitz - ; Armin Braun - ;
Jens M Hohlfeld - ; Wayne Mitzner - ; Norbert Krug - ;
Heinz G Hoymann* -
* Corresponding author
Abstract
Background: This study seeks to compare the ability of repeatable invasive and noninvasive lung
function methods to assess allergen-specific and cholinergic airway responsiveness (AR) in intact,
spontaneously breathing BALB/c mice.
Methods: Using noninvasive head-out body plethysmography and the decrease in tidal
midexpiratory flow (EF
50
), we determined early AR (EAR) to inhaled Aspergillus fumigatus antigens
in conscious mice. These measurements were paralleled by invasive determination of pulmonary
conductance (GL), dynamic compliance (Cdyn) and EF
50
in another group of anesthetized,
orotracheally intubated mice.
Results: With both methods, allergic mice, sensitized and boosted with A. fumigatus, elicited
allergen-specific EAR to A. fumigatus (p < 0.05 versus controls). Dose-response studies to
aerosolized methacholine (MCh) were performed in the same animals 48 h later, showing that
allergic mice relative to controls were distinctly more responsive (p < 0.05) and revealed acute
airway inflammation as evidenced from increased eosinophils and lymphocytes in bronchoalveolar
lavage.
Conclusion: We conclude that invasive and noninvasive pulmonary function tests are capable of
detecting both allergen-specific and cholinergic AR in intact, allergic mice. The invasive
determination of GL and Cdyn is superior in sensitivity, whereas the noninvasive EF
50
method is
particularly appropriate for quick and repeatable screening of respiratory function in large numbers
of conscious mice.
Published: 25 November 2005
Respiratory Research 2005, 6:139 doi:10.1186/1465-9921-6-139
Received: 18 January 2005
Accepted: 25 November 2005
This article is available from: />© 2005 Glaab et al; licensee BioMed Central Ltd.
This is an Open Access article distributed under the terms of the Creative Commons Attribution License ( />),
which permits unrestricted use, distribution, and reproduction in any medium, provided the original work is properly cited.
Respiratory Research 2005, 6:139 />Page 2 of 10
(page number not for citation purposes)
Background
Asthma is a complex disease associated with reversible air-
way obstruction of variable degree, airway inflammation,
airway hyperresponsiveness (AHR) and airway remode-
ling. These hallmarks of asthma are being examined in
murine models, with the goal of understanding the basic
cellular and genetic mechanisms of allergic inflammation
that underlie the immunologic basis of the disease [1]. To
investigate the functional consequences of in vitro find-
ings in the lung in vivo, determination of pulmonary
function is an essential tool. Existing methods for measur-
ing respiratory function in mice in vivo include invasive
and noninvasive approaches [2,3]. The invasive recording
of pulmonary resistance (RL) or pulmonary conductance
(1/RL), and dynamic compliance (Cdyn) is the gold
standard for precise and specific determinations of pul-
monary mechanics [2,3]. Limitations of traditional inva-
sive methodologies commonly involve surgical
tracheostomy, anesthesia, and mechanical ventilation, all
of which are procedures that may generate significant arti-
facts [2]. In addition, when tracheostomy is done, this
method is limited to single-point measurements only,
usually precluding the possibility of performing follow-
up studies. A novel modification to this invasive technol-
ogy has enabled repetitive invasive recordings of pulmo-
nary mechanics in conjunction with local aerosol delivery
in anesthetized, orotracheally intubated, spontaneously
breathing mice [4].
Noninvasive determination of respiratory parameters in
conscious mice is a convenient, repeatable approach for
screening respiratory function in large numbers of ani-
mals. Here, the application of the empiric variable
enhanced pause (Penh) has gained widespread popular-
ity. A recent correspondence written by leading experts [5]
has emphasized the danger of the increasing uncritical use
of Penh, with potentially misleading assessment of pul-
monary function in animal models of lung disease.
Although noninvasive measurement of murine respira-
tory function has virtually become synonymous with the
recently questioned Penh method [5-9], a variety of other
noninvasive methods have been established [10-12]. We
and others have described the utility of midexpiratory
flow, as measured by head-out body plethysmography, as
a physiologically meaningful, noninvasive parameter of
bronchoconstriction for mice and rats [13-17]. No report
has as yet directly investigated the ability and utility of
repetitive invasive and noninvasive lung function meth-
ods to assess allergen-specific EAR and cholinergic airway
hyperresponsiveness (AHR) in intact mice. The primary
objective of this study in a mouse model of fungal asthma
was to compare the capability of noninvasive EF
50
meas-
urements to reflect the allergen-specific and cholinergic
AR as observed with invasive determination of pulmonary
mechanics. Moreover, to support the argument that non-
invasive EF
50
measurement is more valid than Penh we
sought to examine whether EF
50
, unlike Penh [18], paral-
lels the actual changes in pulmonary mechanics in
response to hyperoxia in C57BL/6 mice. Our results
showed that, while the noninvasive measurement of EF
50
presented greater variability than the classical invasive
measurements of RL and Cdyn, the correlation was suffi-
ciently strong to support the use of such noninvasive test-
ing in repetitive measurements in invividual mice.
Methods
Animals and sensitization protocol
Pathogen-free, female BALB/c mice, 12–14 weeks of age,
and female C57BL/6 mice (used only for hyperoxia expo-
sures), 7–8 weeks of age (Charles River, Sulzfeld, Ger-
many), were kept in a pathogen-free rodent facility and
were provided food and water ad libitum. All animal
experiments conformed to NIH guidelines and were
approved by the appropriate governmental authority
(Bezirksregierung Niedersachsen, Germany). Allergic
BALB/C mice (n = 8) received an intraperitoneal and sub-
cutaneous injection of soluble A. fumigatus antigens (5 µg
each, Greer Laboratories Inc, Lenoir, NC, USA), dissolved
in incomplete Freund's adjuvant in a volume of 0.1 ml
given on day 0 and were boosted noninvasively by inha-
lation over 10 min in a closed chamber with 1 % of A.
fumigatus aerosol dissolved in saline on day 14 (jet neb-
ulizer, LC Star, 2.8 µm mass median aerodynamic diame-
ter (MMAD), Pari GmbH, Starnberg, Germany).
On day 21, allergic mice were challenged once with aero-
solized A. fumigatus followed by methacholine (MCh,
Sigma, Deisenhofen, Germany) dose-response exposure
48 h later (d 23). The control group (n = 8) received the
same treatment schedule but was boosted and challenged
with saline before MCh exposure. This protocol was cho-
sen to maximize the difference between allergic and con-
trol groups. For the noninvasive measurement of
pulmonary function separate groups of A. fumigatus-sen-
sitized and control mice were used (n = 8 each group).
Noninvasive measurement of pulmonary function in
conscious mice
Noninvasive respiratory function was assessed with a
glass-made head-out body plethysmograph system for
four mice as previously described [14,17,19]. Briefly, mice
were placed in the body plethysmographs while the head
of each animal protruded through a neck collar (9 mm ID,
dental latex dam, Roeko, Langenau, Germany) into a ven-
tilated head exposure chamber. Monitoring of respiratory
function was started when animals and individual meas-
urements settled down to a stable level. For airflow meas-
urement, a calibrated pneumotachograph (capillary tube
PTM 378/1.2, HSE-Harvard, March-Hugstetten, Ger-
many) and a differential pressure transducer (Validyne DP
Respiratory Research 2005, 6:139 />Page 3 of 10
(page number not for citation purposes)
45-14, range ± 2 cm H
2
O, HSE-Harvard) coupled to an
amplifier were attached to the top port of each plethysmo-
graph. For each animal the amplified analog signal from
the pressure transducer was digitized via an analog-to-dig-
ital converter (DT 302, Data Translation, Marlboro, MA).
The pneumotachograph tidal flow signal was integrated
with time to obtain tidal volume (VT). From these signals
the parameters tidal midexpiratory flow (EF
50
), time of
expiration (TE), tidal volume (VT) and respiratory rate (f)
were calculated for each breath and were averaged in 5 s
segments with a commercial software (HEM 3.4, Noto-
cord, Paris, France).
During airway constriction the main changes in the tidal
flow signal occur during the midexpiratory phase. We
defined EF
50
(ml/s) as the tidal flow at the midpoint (50
%) of expiratory tidal volume, and we used this as a meas-
ure of bronchoconstriction [12,14,17]. A reduction in
EF
50
of more than 1.5 Standard deviation (SD) of mean
baseline value (which translates to a reduction of more
than 20% versus baseline) is considered to indicate airway
constriction. The degree of bronchoconstriction to inhala-
tion challenge was determined from minimum values of
EF
50
and was expressed as percent changes from corre-
sponding baseline values.
Invasive measurement of pulmonary function
AR was assessed as an increase in RL or decreases in Cdyn
and EF
50
in response to aerosolized A. fumigatus or MCh
in anesthetized, spontaneously breathing mice as previ-
ously described in detail [4]. Briefly, mice were anesthe-
tized with intraperitoneal injections of metomidate (total
dose: 38–60 mg/kg) and fentanyl (total dose: 0.02 – 0.06
mg/kg) with minimal supplementations as required.
When an appropriate depth of anesthesia was achieved,
mice were suspended by their upper incisors from a rub-
ber band on a Plexiglas support. The trachea was transillu-
minated below the vocal cords by a halogen light source
and a standard 20G × 32 mm Abbocath
®
-T cannula
(Abbott, Sligo, Ireland) was gently inserted into the tra-
cheal opening. The intubated, spontaneously breathing
animal was then placed in supine position in a thermo-
stat-controlled whole-body plethysmograph (type 871,
HSE-Harvard, designed in cooperation with Fraunhofer
ITEM). The orotracheal tube was directly attached to a
pneumotachograph (capillary tube PTM T16375, HSE-
Harvard) installed in the front part of the chamber. Tidal
flow was determined by the pneumotachograph con-
nected to a differential pressure transducer (Validyne DP
45-14, HSE-Harvard). To measure transpulmonary pres-
sure (PTP) a water-filled PE-90 tubing was inserted into
the esophagus to the level of the midthorax and coupled
to a pressure transducer (model P75, HSE-Harvard). The
amplified analog signals from the pressure transducers
were digitized as described above for noninvasive meas-
urements.
Pulmonary resistance (RL) and dynamic compliance
(Cdyn) were calculated over a complete respiratory cycle
using an integration method over flows, volumes and
pressures as previously described [4,20]. The resistance of
the orotracheal tube (0.63 cm H
2
O·s·ml
-1
) was sub-
tracted from all RL measurements. RL, Cdyn, EF
50
together
with other basic respiratory parameters were continuously
recorded with a commercial software (HEM 3.4, Noto-
cord). For easier comparison of trends among all varia-
bles, RL was expressed as pulmonary conductance GL (GL
= 1/RL).
Respiratory parameters were averaged in 5 s segments and
minimum GL, Cdyn and EF
50
values were taken and
expressed as percent changes from corresponding baseline
values. After the measurements on day 21, mice were
removed from the chamber and extubated as soon as they
began recovering from anesthesia.
Administration of aerosols
After recording of baseline values, airway responsiveness
(AR) to A. fumigatus 2 % or saline (control group) was
determined in separate groups of conscious and intubated
mice on day 21. On day 23, dose-response studies to aer-
osolized MCh were performed in the same mice.
For intubated mice, dried aerosols of A. fumigatus 2 %
(inhaled dose: 8 µg) and MCh 5 % (inhaled doses: 0.05–
2.5 µg) were generated by a computer-controlled, jet-
driven aerosol generator system (Bronchy III, particle size
2.5 µm MMAD, Fraunhofer ITEM, licensed by Buxco,
Troy, NY) as previously described (15, 21).
Conscious mice placed in the head-out body plethysmo-
graphs were exposed noninvasively to A. fumigatus (2 %,
inhaled dose 32 µg) and MCh aerosols (0.5–3 %, cumula-
tive inhaled doses: 3–14 µg) delivered by a Pari jet neb-
ulizer as previously described [13,14,22]. In both systems,
aerosol concentrations were determined by a gravimetri-
cally calibrated photometer. The total inhalation doses of
A. fumigatus and MCh were calculated based on the con-
tinuously measured aerosol concentrations and respira-
tory volume per min [4,21]. The results of the
bronchoconstrictor response to MCh were expressed as
PD50 which is the dose of MCh required to reduce either
GL, Cdyn or EF
50
to 50 % of their respective baseline val-
ues and was calculated from the dose-response curves.
Exposure to oxygen
C57BL/6 mice were randomly assigned to two groups: The
mice in the control group (n = 8 each) were kept in room
air whereas the other group of 8 mice was exposed to 100
Respiratory Research 2005, 6:139 />Page 4 of 10
(page number not for citation purposes)
% oxygen for 48 h. Exposure to 100 % oxygen was per-
formed in a sealed (25 L) Plexiglas chamber with a flow of
2 L/min as similarly described earlier [18]. The CO
2
level
in the chamber was maintained at 1 % by using a CO
2
absorber (Drägersorb 800 plus, Dräger, Lübeck, Ger-
many). Food and water were provided ad libitum.
Bronchoalveolar lavage (BAL) cell counts
At the end of this protocol, total and differential cell
counts from BAL samples using 2 × 0.8 ml aliquots of
saline were determined as previously described (14),
except that, recovery of BAL fluids was performed from
the distal trachea in intubated animals.
Statistics
Comparisons of baseline values between groups and
intraindividual comparisons were analyzed by the Stu-
dent's two-sided t-test, allergic responses of the group of
allergic mice versus control mice were analyzed by one-
sided t-test. P values < 0.05 were considered significant.
Descriptive results were expressed as means ± SE unless
indicated otherwise. Comparison of a new measurement
technique with an established one is needed to see
whether they agree sufficiently. A plot of the difference
against the standard measurements will often appear to
show a relation between difference and magnitude when
there is none. A plot of the difference against the average
of the standard and new measurements is unlikely to mis-
lead in this way. Accordingly, the agreement between the
invasive and noninvasive lung function methods was ana-
lyzed by the method of Bland and Altman [23]. Graphi-
cally, the difference of each pair of measurement was
plotted against their mean values. Agreement was
expressed as the mean differences over all measurements
and their corresponding 95% confidence intervals (95%
CI). The limits of agreement were expressed as the mean
differences ± 2 SD of the differences, together with their
95% confidence intervals (95% CI). Statistics was per-
formed with SPSS 11.5.
Results
Baseline values for respiratory parameters in conscious
and anesthetized mice
To illustrate the impact of anesthesia on respiratory func-
tion, baseline respiratory parameters were measured in
anesthetized and conscious mice. Table 1 presents the
baseline values of respiratory parameters obtained from
conscious and anesthetized BALB/c mice. There were sig-
nificant differences in f, TE and EF
50
values between anes-
thetized and conscious animals at baseline. In addition,
no differences in respiratory parameters were observed
between allergic and control mice at baseline when sepa-
rated into conscious and anesthetized groups.
Comparison of invasive and noninvasive lung function
measurements of EAR
The allergen-specific early airway response (EAR) to A.
fumigatus was investigated in allergic mice on day 21 (Fig.
1 and 2). To avoid unbalanced challenges with allergen or
saline, each group was separated into two subgroups for
invasive and noninvasive measurement of pulmonary
function.
Invasive recordings of EAR in allergic mice showed signif-
icant decreases in simultaneously measured GL, Cdyn,
and EF
50
compared with controls thus indicating an aller-
gen-specific EAR to A. fumigatus. As shown in Figure 1,
the most prominent alteration was shown for GL with a
reduction by -62.1 ± 5.1 % (P < 0.001 vs. control) com-
pared with a reduction by -48.8 ± 8.3 % in Cdyn (P <
0.001 vs. control), and a decrease by -34.5 ± 5.1 % in EF
50
(P < 0.001 vs. control). The bronchoconstrictive response
started within 7 ± 4 minutes (mean ± SD) after start of
exposure and reached its maximum within 14 ± 3 min
(mean ± SD). Figure 2 illustrates a characteristic time-
response course of the EAR in an anesthetized, orotrache-
ally intubated allergic mouse.
To determine if decreases in invasively monitored EF
50
,
relate to changes in GL and Cdyn, we analyzed the agree-
ment between these measurements by the method of
Table 1: Baseline values for respiratory parameters from allergic and control BALB/c mice
Respiratory
parameters
Definition Control mice
conscious
Allergic mice
conscious
Control mice
anesthetized
Allergic mice
anesthetized
VT, ml tidal volume 0.21 ± 0.05 0.19 ± 0.04 0.14 ± 0.02 0.13 ± 0.02
f, breaths/min respiratory frequency 198 ± 41 220 ± 23 129 ± 20* 124 ± 29*
TE, s time of expiration 0.17 ± 0.06 0.14 ± 0.02 0.3 ± 0.04* 0.3 ± 0.05*
EF
50
, ml/s tidal midexpiratory flow 2.05 ± 0.89 2.26 ± 0.46 0.93 ± 0.14* 1.12 ± 0.43*
GL, ml·s
-1
·cmH
2
O
-1
pulmonary conductance - - 1.05 ± 0.36 1.29 ± 0.69
Cdyn, ml·cmH
2
O
-1
dynamic compliance - - 0.037 ± .007 0.030 ± .008
Baseline values are means ± SD obtained from 8 animals per group during a 5 min control period from conscious and anesthetized, orotracheally
intubated BALB/c mice. In comparison with conscious mice, EF
50
, TE and f values were significantly altered in anesthetized mice. No difference was
found between allergic animals and control groups when separated into conscious and anesthetized mice. *P < 0.05 versus conscious mice.
Respiratory Research 2005, 6:139 />Page 5 of 10
(page number not for citation purposes)
Bland and Altman. Although all three parameters, Cdyn,
GL and EF
50
, adequately reflected the pronounced EAR in
allergic mice there was enhanced variation between GL vs.
EF
50
, GL vs. Cdyn and EF
50
vs. Cdyn in response to specific
allergen challenge. As shown in Table 2, EF
50
tended to
underestimate the decreases in GL by -27.6 %, and by -
14.3 % for Cdyn in allergic animals. In contrast, a very
good agreement between EF
50
, GL and Cdyn values was
found for control mice, with mean differences ranging
from -2.4 to -6.1 %.
Noninvasive measurements of pulmonary function in
allergic mice also demonstrated a marked allergen-specific
EAR as manifested by a significant decline by -44.6 ± 6.2
% in EF
50
compared with that in control animals (P =
0.002, Fig. 1). The magnitude of the response was similar
to the decline observed with invasively recorded EF
50
.
Reduced EF
50
values were accompanied by decreased VT
values and – in contrast to invasive measurements – by
decreased f and increased TE values.
Invasive vs. noninvasive determination of cholinergic AHR
To further characterize the utility of noninvasive vs. non-
invasive pulmonary function tests, AR to increasing doses
of aerosolized MCh, was investigated 48 h after EAR
recordings in the same animals. Baseline GL, Cdyn and
EF
50
values were not significantly different from initial
baseline values.
MCh exposure elicited a dose-related reduction in GL,
Cdyn, and EF
50
values in the intubated animals that was
significantly enhanced in allergic mice (p < 0.05 vs. con-
trol group). The magnitude of cholinergic AR was signifi-
cantly higher for GL and Cdyn compared with
simultaneously measured EF
50
(P = 0.027). Accordingly,
the mean PD50 causing a decrease in Cdyn, EF
50
and GL
to 50 % baseline was 0.4 ± 0.1 for GL, 0.4 ± 0.1 for Cdyn,
and 1.2 ± 0.4 µg MCh for EF
50
in allergic mice (Fig. 3). The
respective mean PD50 values for control animals were sig-
nificantly higher: 2 ± 0.4 for GL (P = 0.001), 3.4 ± 0.7 for
Cdyn (P = 0.002), and 4.9 ± 1.2 µg MCh for EF
50
(P =
0.008). The dose-related decreases in EF
50
were accompa-
nied by increases in esophageal pressures. At the level of
the 50% decline in EF
50
(PD50), the peak esophageal pres-
sure increased 121 ± 13 % for the allergic mice and 104 ±
16 % for the control group.
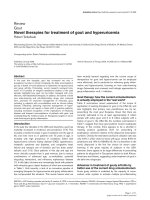
Example of EARFigure 2
Example of EAR. Example of an early airway response
(EAR) to inhaled A. fumigatus 2 % in an orotracheally intu-
bated allergic mouse. Decreases in GL, Cdyn, and EF
50
values
were associated with small declines in VT, f and TE. The ordi-
nate at the bottom indicates the photometric signal of the
allergen aerosol challenge.
Early airway responsivenessFigure 1
Early airway responsiveness. Invasive vs. noninvasive
assessment of early airway responsiveness (EAR) to aero-
solized Aspergillus fumigatus 2 %. Allergic (black columns)
and control mice (white columns) were separated into
groups of invasively and noninvasively monitored animals.
The allergic mice showed significant reductions in simultane-
ously measured GL, Cdyn and EF
50an
(an: anesthetized), com-
pared with control animals. Noninvasive determination of
EF
50con
(con: conscious) elicited significant decreases in EF
50
to inhaled A. fumigatus compared with control animals. EAR
was expressed as % change from corresponding baseline val-
ues, which were taken as 0 %. Values are means ± SE, n = 8
per group, *p < 0.01 vs. control.
Respiratory Research 2005, 6:139 />Page 6 of 10
(page number not for citation purposes)
The peak responses for GL, Cdyn and EF
50
occurred within
1 min after challenge and recovered to within 10–20 % of
the baseline before MCh exposure during 1–3 min. Agree-
ments between Cdyn, EF
50
and GL were excellent, the
mean ranging from 0 to -0.71 µg MCh for the allergic
group and from -2.9 to 1.38 µg MCh for the control group
(Table 2). Figure 4 shows the corresponding Bland-Alt-
man plots of the differences between EF
50
vs. GL and
between EF
50
vs. Cdyn against the mean of both values in
allergic animals.
Noninvasive determination of EF
50
also showed that aller-
gic mice were significantly more responsive to MCh, as
indicated by significantly lower PD50 values for EF
50
when compared with controls (P = 0.032) (Fig. 3).
Allergic airway inflammation
The A. fumigatus-sensitized and boosted animals showed
significant increases in eosinophils and lymphocytes in
BAL fluid (Table 3) compared with control mice. This
indicates the presence of an inflammatory response in the
lungs of allergic mice. The intubated animals receiving
aerosols directly via the orotracheal tube had slightly
higher numbers of leukocyte populations compared with
conscious mice (statistically not significant).
Impact of hyperoxia on EF
50
measurements in C57BL/6
mice
To examine how EF
50
correlates with direct lung resistance
measurements, C57BL/6 mice were exposed to 100% oxy-
gen for 48 h. Table 4 lists the hyperoxia-induced changes
detected by invasive and noninvasive lung function meas-
urements compared with control animals. Noninvasive
recordings revealed no significant differences in breathing
rate, TE, VT, and EF
50
between control and hyperoxia mice
after 48 h of hyperoxia. Likewise, direct measurements of
pulmonary mechanics in the same animals did not show
any differences in EF
50
, Cdyn and RL values, thus confirm-
ing the absence of airway constriction in both groups.
Discussion
In the present study we have evaluated the sensitivity and
reliability of repeatable noninvasive versus invasive pul-
monary function tests to sequentially measure AR in
response to specific allergen and cholinergic challenge in
spontaneously breathing mice. Our results demonstrate
that both systems reflect the allergen-specific early AR and
cholinergic AHR of allergic compared with control mice.
The ability to manipulate the mouse genome has opened
up new opportunities to develop mouse models of aller-
gic asthma that demonstrate spontaneous or chronic dis-
ease [24]. For a proper phenotyping of AR in experimental
models it is crucial to monitor pulmonary function as reli-
ably as possible. One way to achieve this is a novel in-vivo
method that combines repetitive recordings of classical
pulmonary mechanics with cholinergic aerosol challenges
in orotracheally intubated mice [4]. Despite being an
accurate measurement of classical pulmonary function on
multiple occasions, this invasive method does not readily
Table 2: Bland-Altman analysis of the differences in GL, EF
50
and Cdyn.
Early AR Cholinergic AR
Group Parameters Mean ± SD
(95% CI)
Upper limit (95% CI)
Lower limit (95% CI)
Mean ± SD
(95% CI)
Upper limit (95% CI)
Lower limit (95% CI)
Allergic EF
50
vs. GL -27.6 ± 17.8
(-42.6/-12.7)
8.0 (-17.8/33.9)
-63.3 (-89.2/-37.5)
-0.7 ± 0.7
(-1.3/0.1)
0.7 (-0.3/1.8)
-2.1 (-3.2/-1.1)
GL vs. Cdyn 13.3 ± 21.9
(-5/31.7)
57.1 (25.4/88.8)
-30.5 (-62.2/1.2)
0 ± 0.2
(-0.2/0.2)
0.4 (0.1/0.7)
-0.4 (-0.7/-0.1)
EF
50
vs. Cdyn -14.3 ± 29.5
(-39/10.3)
44.7 (2/87.4)
-73.3 (-116/-30.6)
-0.7 ± 0.9
(-1.4/0)
1 (-0.2/2.3)
-2.5 (-3.7/-1.2)
Control EF
50
vs. GL -2.4 ± 9.5
(-10.4/5.5)
16.6 (2.8/30.5)
-21.5 (-35.3/-7.7)
-2.9 ± 3.3
(-5.7/-0.2)
3.7 (-1.1/8.5)
-9.5 (-14.3/-4.7)
GL vs. Cdyn -3.7 ± 10.4
(-12.2/5.1)
17.2 (2.1 to 32.3)
-24.6 (-39.7/-9.4)
1.4 ± 1.8
(-0.2/2.9)
5 (2.4/7.7)
-2.3 (-4.9/0.4)
EF
50
vs. Cdyn -6.1 ± 9.1
(-13.8/-1.5)
12.2 (-1.1/25.4)
-24.4 (-37.6/-11.2)
-1.5 ± 3.5
(-4.5/1.4)
5.5 (0.4/10.7)
-8.6 (-13.8/-3.5)
Differences in simultaneous invasive measurements of GL, EF
50
and Cdyn for allergic and control mice during EAR and cholinergic AR. Values are
means ± SD (95 % confidence intervals (CI) in brackets) for 8 animals per group. The upper and lower limits of agreement (means ± 2 SD) as well
as the corresponding 95 % CI intervals (in brackets) are shown. Values for the EAR represent the % change from baseline, whereas the values for
cholinergic AR show the absolute PD50 values in µg MCh.
Respiratory Research 2005, 6:139 />Page 7 of 10
(page number not for citation purposes)
allow for rapid screening of pulmonary function in large
numbers of animals.
In contrast, noninvasive head-out body plethysmography
has been shown to yield stable and reliable on-line meas-
urements of AR in several conscious mice at a time and
serves as a suitable and valid tool to complement the tra-
ditional measures of pulmonary mechanics
[13,14,16,22,25]. Limitations of previous EF
50
validation
studies in mice particularly have included pleural cathe-
terization with the inability to conduct reproducible
measurements, the contribution of upper airway resist-
ance and intravenous rather than aerosol challenge
[14,17]. These methodological shortcomings introduced
variability into the results which made them difficult to
compare with other invasive techniques [10].
The current report intended to overcome such problems
in that GL, Cdyn and EF
50
were measured simultaneously
in intact mice including local aerosol challenges via an
orotracheal tube. In parallel, noninvasive determinations
of EF
50
were performed in allergic and control mice. The
noninvasive experiments relied on methodologies identi-
cal to those used in our previous mice studies to facilitate
comparisons [14,17,22].
The values for respiratory parameters measured from both
conscious and anesthetized BALB/c mice were reproduci-
ble and comparable with those reported previously for
this strain (Table 1) [4,14,26]. The changes in respiratory
patterns observed in anesthetized mice were associated
with increased expiratory time, decreased f, and decreased
EF
50
values, events likely related to anesthetic effects on
neural respiratory control. The independence of EF
50
recordings from changes in frequency has been demon-
strated in previous investigations [14,15].
To examine the sensitivity of noninvasive and invasive
indices of bronchoconstriction, we monitored allergen-
specific EAR and, 48 h later, performed MCh dose-
response studies in the same allergic animals compared
with controls. Challenge with aerosolized A. fumigatus
resulted in significant reductions in Cdyn, GL and in EF
50
values in allergic mice compared with (sham-exposed)
control animals. Demonstration of allergen-specific EAR
in allergic mice was followed by cholinergic AHR that was
linked with a pronounced influx of neutrophils and eosi-
nophils in BAL fluid. Consistent with previous results,
invasively recorded EF
50
was slightly less sensitive in
detecting the maximum degree of bronchoconstriction to
A. fumigatus and MCh compared with GL and Cdyn
recordings [15].
Agreement between invasively measured EF
50
, GL and
Cdyn during EAR and cholinergic AHR was good,
although there was increased variability at the time of EAR
in allergic mice (Table 2). This variability may reflect dif-
ferent sensitivities of GL, EF
50
and Cdyn to the airway and
tissue components of total pulmonary resistance [3,16].
Related to this issue, is a previous study indicating that
mice with airway inflammation experience quite hetero-
geneous airway narrowing and airway closure during air-
way smooth muscle contraction [27].
Nevertheless, despite this variability, it is important to
emphasize that the noninvasive measurement of EF
50
still
reflected the enhanced AR to A. fumigatus and MCh in
allergic relative to control mice (Figs. 1, 3). Thus, although
the calculated inhalation doses for A. fumigatus and MCh
in conscious mice may be not as accurate as in intubated
mice, the observed EF
50
responses still reflect airway con-
striction. These findings indicate that EF
50
can distinguish
between different magnitudes of AR and reflects the
changes with GL and Cdyn during bronchoconstriction at
least under the conditions of this study. Moreover, the
relation of the cholinergic EF
50
response between allergic
and control animals was similar for invasive and noninva-
sive measurements (Figure 3). The higher PD50 values for
EF
50
in conscious compared with intubated animals to
MCh challenge can be explained by methodological
issues. Administration of aerosols directly into the lungs
via an orotracheal tube results in aerosol deposition
mainly in the parenchyma. In conscious animals there
will be substantial deposition in the nasal passages and
upper airway, which should lead to the higher PD50 val-
ues observed. The AR, as measured noninvasively by EF
50
,
may also be partly affected by altered upper airway resist-
ance. However, because of the rapid onset and resolution
Table 3: Cellular composition of BAL fluid
Control mice conscious Allergic mice conscious Control mice anesthetized Allergic mice anesthetized
Eosinophils, × 10
4
< 1 7.9 ± 5.6* < 1 13.4 ± 9.3*
Lymphocytes, × 10
4
< 1 3.2 ± 2.2* 0.5 ± 0.4 1.8 ± 1.6*
Neutrophils, × 10
4
< 1 1.3 ± 1 1.9 ± 1.3 2.7 ± 4.1
Macrophages, × 10
4
12.3 ± 3.3 13.7 ± 3.1 22 ± 9.2 16.7 ± 6.1
Values are means ± SD from 8 animals per group. Eosinophils and lymphocytes recovered from bronchoalveolar lavage (BAL) fluid 48 hours after
allergen challenge were increased in both conscious and intubated allergic mice. *P < 0.05 vs. control mice.
Respiratory Research 2005, 6:139 />Page 8 of 10
(page number not for citation purposes)
of the response, it seems unlikely that edema or mucus
hypersecretion in these upper airways was responsible for
the increased AR.
In agreement with other investigations, decreases in EF
50
,
as measured by noninvasive head-out body plethysmog-
raphy, were linked with decreased frequency and VT val-
ues and increasing values for TE [12,14,15]. In contrast,
no relevant impact on frequency and TE was found in
anesthetized, intubated mice during bronchoconstriction.
Concerns with noninvasive EF
50
recordings include the
uncertainty about the exact degree and localization of
bronchoconstriction as well as the potential contribution
of upper airway resistance. Due to methodological differ-
ences, comparisons between invasive and noninvasive
measures are of indirect, qualitative nature. A quantitative
comparison, however, is directly available from the
intraindividual differences between simultaneously meas-
ured EF
50
and GL in unconscious mice. Because EF
50
tends
to underestimate the magnitude of bronchoconstriction
(discussed below) it is still unclear whether this limits its
use in detecting less marked changes in airway hyperre-
sponsiveness than those induced in high-reponder mod-
els. As a result, EF
50
measures should be confirmed with
direct assessments of pulmonary resistance under these
circumstances. Despite these methodological restrictions,
the observed EF
50
responses still reflected the enhanced
AR to ACh and allergen under the conditions of this study.
In comparison with the widely used Penh method, EF
50
differs substantially in several important ways: EF
50
decreases with bronchoconstriction and in line with inva-
sively measured lung resistance or conductance is linked
with a decline in VT during bronchoconstriction [7,28].
Even more importantly, EF
50
has a physical meaning (ml/
s), allows direct comparison from one animal to another
and is closely related to airway resistance. Indeed, if it
were possible to know the esophageal pressure in the con-
scious animals, one could calculate a precise lung resist-
ance. If we assume that esophageal pressure does not
change, then changes in the EF
50
would be directly pro-
portional to the lung resistance. However, in the anesthe-
tized animals, we found that the esophageal pressure
actually increased as the airways constricted, perhaps in
response to the increased resistance and lower air flow.
This suggests that the EF
50
in conscious animals may
underestimate the actual changes in lung resistance.
Despite this quantitative limitation, the method seems far
more representative of changes in resistance than other
noninvasive methods, and the approach allows for direct
quantitative comparisons from animal to animal. The
commonly measured Penh has no theoretical linkage to
lung resistance, and its usefulness was further weakened
by recent reports, one of which showed that changes in
Penh were no better than simply measuring TE to assess
AR in common strains of laboratory mice [6]. It is also
known that a decline in noninvasively measured EF
50
is
associated with an increase in TE [12,14]. However, it is
important to note that conditions entirely unrelated to
Cholinergic ARFigure 3
Cholinergic AR. Magnitudes of cholinergic AHR, 48 h after
EAR, expressed as PD50 values, which is the dose of MCh
required to reduce either GL, Cdyn or EF
50
to 50 % of their
respective baseline values) of invasively measured GL, Cdyn
and EF
50
(A) as well as of noninvasively recorded EF
50
(B).
Allergic mice (black columns) showed significantly lower
PD50 values compared with controls (white columns). Base-
line values were not significantly different from initial baseline
values 48 h before and were within the means ± SD as listed
in Table 1. Values are means ± SE, n = 8 per group, *p < 0.05
vs. control.
Table 4: Impact of hyperoxia over 48 h on invasively and noninvasively measured respiratory parameters
Noninvasive measurement Invasive measurement
EF
50
TE VT f RL Cdyn GL EF
50
TE VT* f
Control 2.36 ±
0.12
0.13 ±
0.01
0.20 ±
0.01
251 ± 14 1.44 ±
0.27
0.017 ±
0.004
0.72 ±
0.15
1.01 ±
0.13
0.3 ±
0.03
0.11 ±
0.02
106 ± 9
Hyperoxia 2.30 ±
0.41
0.14 ±
0.02
0.20 ±
0.02
245 ± 41 1.27 ±
0.29
0.018 ±
0.007
0.85 ±
0.18
0.93 ±
0.15
0.32 ±
0.04
0.14 ±
0.02
99 ± 15
Values are means ± SD from 8 C57BL/6 mice per group. *P < 0.05 vs. control mice. VT: tidal volume, EF
50
: tidal midexpiratory flow, TE: time of
expiration, f: respiratory rate, RL: pulmonary resistance, Cdyn: dynamic compliance, GL: pulmonary conductance (GL = 1/RL).
Respiratory Research 2005, 6:139 />Page 9 of 10
(page number not for citation purposes)
bronchoconstriction, such as sensory irritation, will also
result in increasing TE values [12,29].
Another report demonstrated that Penh was inadequate
for characterization of pulmonary mechanics in the con-
text of hyperoxia-induced changes in C57BL/6 mice [18].
These authors pointed out that Penh may significantly
overestimate the actual changes in lung resistance after 24
and 48 h of hyperoxia. Interestingly, increases in Penh
were accompanied by decreased TE and rising VT and f.
This contrasts with the above-mentioned observation of
decreased VT during bronchoconstriction as observed
with EF
50
and invasive pulmonary function methods
[4,28]. Our study in C57BL/6 mice showed a consistent
relationship between EF
50
and lung resistance measure-
ments in reponse to 48 h hyperoxia, thus indicating non-
constricted airways. These data support the concept that
EF
50
more reliably reflects airway resistance than Penh,
which is largely a function of respiratory timing.
Conclusion
In conclusion, this study investigated the utility of repeti-
tive invasive vs. noninvasive techniques to determine AR
to allergen and cholinergic challenge in intact, spontane-
ously breathing mice. We demonstrated allergen-specific
EAR to A. fumigatus followed by cholinergic AHR in aller-
gic mice compared with controls. Our results show that
the noninvasive EF
50
method is directly related to lung
resistance, and is thus particularly appropriate for quick
and repeatable phenotyping of airway function in large
numbers of conscious mice.
Competing interests
The author(s) declare that they have no competing inter-
ests.
Authors' contributions
TG participated in the design and coordination of the
study and drafted the manuscript. MZ and RB carried out
the lung function experiments. RK participated in the data
analysis of all experiments, AB carried out the cytological
and ELISA tests. WM helped to draft the manuscript. JMH
and NK participated in the coordination and analysis of
the study. HGH conceived of the study, and participated
in its design and analysis. All authors read and approved
the final manuscript
Acknowledgements
We greatly thank Prof. H. Hecker, Biometrics of Hannover Medical School,
for statistical support and Dr. C. Nassenstein, Fraunhofer ITEM, for excel-
lent technical support.
References
1. Epstein MM: Do mouse models of allergic asthma mimic clinical dis-
ease? Int Arch Allergy Immunol 2004, 133:84-100.
2. Drazen JM, Finn PW, De Sanctis GT: Mouse models of airway
responsiveness: physiological basis of observed outcomes
and analysis of selected examples using these outcome indi-
cators. Annu Rev Physiol 1999, 61:593-625.
3. Irvin CG, Bates JH: Measuring the lung function in the mouse:
the challenge of size. Respir Res 2003, 4:4.
4. Glaab T, Mitzner W, Braun A, Ernst H, Korolewitz R, Hohlfeld JM,
Krug N, Hoymann HG: Repetitive measurements of pulmonary
mechanics to inhaled cholinergic challenge in spontaneously
breathing mice. J Appl Physiol 2004, 97:1104-1111.
5. Bates J, Irvin C, Brusasco V, Drazen J, Fredberg J, Loring S, Eidelman
D, Ludwig M, Macklem P, Martin J, Milic-Emili J, Hantos Z, Hyatt R,
Lai-Fook S, Leff A, Solway J, Lutchen K, Suki B, Mitzner W, Paré P,
Pride N, Sly P: The use and misuse of Penh in animal models of
lung disease. Am J Respir Cell Mol Biol 2004, 31:373-374.
6. Adler A, Cieslewicz G, Irvin CG: Unrestrained plethysmography
is an unreliable measure of airway responsiveness in BALB/c
and C57BL/6 mice. J Appl Physiol 2004, 97:286-292.
7. Hamelmann E, Schwarze J, Takeda K, Oshiba A, Larsen GL, Irvin CG,
Gelfand EW: Noninvasive measurement of airway responsive-
Bland-Altman plotsFigure 4
Bland-Altman plots. Individual differences in the degree of
MCh-induced bronchoconstriction between invasively meas-
ured EF
50
and GL and between EF
50
and Cdyn, are plotted
against the average corresponding values (expressed as
PD50, µg MCh). The solid line represents the mean of the
differences, the dashed lines show the upper and lower limits
of agreement.
Publish with BioMed Central and every
scientist can read your work free of charge
"BioMed Central will be the most significant development for
disseminating the results of biomedical researc h in our lifetime."
Sir Paul Nurse, Cancer Research UK
Your research papers will be:
available free of charge to the entire biomedical community
peer reviewed and published immediately upon acceptance
cited in PubMed and archived on PubMed Central
yours — you keep the copyright
Submit your manuscript here:
/>BioMedcentral
Respiratory Research 2005, 6:139 />Page 10 of 10
(page number not for citation purposes)
ness in allergic mice using barometric plethysmography. Am
J Respir Crit Care Med 1997, 156:766-775.
8. Lundblad LK, Irvin CG, Adler A, Bates JH: A reevaluation of the
validity of unrestrained plethysmography in mice. J Appl Phys-
iol 2002, 93:1198-1207.
9. Mitzner W, Tankersley C: Interpreting Penh in mice. J Appl Phys-
iol 2003, 94:828-831.
10. Flandre TD, Leroy PL, Desmecht DJ: Effect of somatic growth,
strain, and sex on double-chamber plethysmographic respi-
ratory function values in healthy mice. J Appl Physiol 2003,
94:1129-1136.
11. Hessel EM, Zwart A, Oostveen E, Van Oosterhout AJ, Blyth DI,
Nijkamp FP: Repeated measurement of respiratory function
and bronchoconstriction in unanesthetized mice. J Appl Physiol
1995, 79:1711-1716.
12. Vijayaraghavan R, Schaper M, Thompson R, Stock MF, Alarie Y: Char-
acteristic modifications of the breathing pattern of mice to
evaluate the effects of airborne chemicals on the respiratory
tract. Arch Toxicol 1993, 68:478-499.
13. Finotto S, De Sanctis GT, Lehr HA, Herz U, Buerke M, Schipp M, Bar-
tsch B, Atreya R, Schmitt E, Galle PR, Renz H, Neurath MF: Treat-
ment of allergic airway inflammation and
hyperresponsiveness by antisense-induced local blockade of
GATA-3 expression. J Exp Med 2001, 193:1247-1260.
14. Glaab T, Daser A, Braun A, Neuhaus-Steinmetz U, Fabel H, Alarie Y,
Renz H: Tidal midexpiratory flow as a measure of airway
hyperresponsiveness in allergic mice. Am J Physiol Lung Cell Mol
Physiol 2001, 280:L565-L573.
15. Glaab T, Hoymann HG, Hohlfeld JM, Korolewitz R, Hecht M, Alarie
Y, Tschernig T, Braun A, Krug N, Fabel H: Noninvasive measure-
ment of midexpiratory flow indicates bronchoconstriction in
allergic rats. J Appl Physiol 2002, 93:1208-1214.
16. Hantos Z, Brusasco V: Assessment of respiratory mechanics in
small animals: the simpler the better? J Appl Physiol 2002,
93:1196-1197.
17. Neuhaus-Steinmetz U, Glaab T, Daser A, Braun A, Lommatzsch M,
Herz U, Kips J, Alarie Y, Renz H: Sequential development of air-
way hyperresponsiveness and acute airway obstruction in a
mouse model of allergic inflammation. Int Arch Allergy Immunol
2000, 121:57-67.
18. Peták F, Habre W, Donati YR, Hantos Z, Barazzone-Argiroffo C:
Hyperoxia-induced changes in mouse lung mechanics:
forced oscillations vs. barometric plethysmography. J Appl
Physiol 2001, 90:2221-2230.
19. Vijayaraghavan R, Schaper M, Thompson R, Stock MF, Boylstein LA,
Luo JE, Alarie Y: Computer assisted recognition and quantita-
tion of the effects of airborne chemicals acting at different
areas of the respiratory tract in mice. Arch Toxicol 1994,
68:490-499.
20. Roy R, Powers SR Jr, Kimball WR: Estimation of respiratory
parameters by the method of covariance ratios. Comput
Biomed Res 1974, 7:21-39.
21. Hoymann HG, Heinrich U: Measurement of lung function in
rodents in vivo. In Methods in Pulmonary Research Edited by: Uhlig
S, Taylor AE. Basel, Birkhäuser Verlag; 1998:1-28.
22. Path G, Braun A, Meents N, Kerzel S, Quarcoo D, Raap U, Hoyle
GW, Nockher WA, Renz H: Augmentation of allergic early-
phase reaction by nerve growth factor. Am J Respir Crit Care Med
2002, 166:818-826.
23. Bland JM, Altman DG: Statistical methods for assessing agree-
ment between two methods of clinical measurement. Lancet
1986, 1:307-310.
24. Kumar RK, Foster PS: Modeling allergic asthma in mice: pitfalls
and opportunities. Am J Respir Cell Mol Biol 2002, 27:267-272.
25. Braun A, Lommatzsch M, Neuhaus-Steinmetz U, Quarcoo D, Glaab
T, McGregor GP, Fischer A, Renz H: Brain-derived neurotrophic
factor (BDNF) contributes to neuronal dysfunction in a
model of allergic airway inflammation. Br J Pharmacol 2004,
141:431-440.
26. Tomioka S, Bates JH, Irvin CG: Airway and tissue mechanics in a
murine model of asthma: alveolar capsule vs. forced oscilla-
tions. J Appl Physiol 2002, 93:263-270.
27. Evans KL, Bond RA, Corry DB, Shardonofsky FR: Frequency
dependence of respiratory system mechanics during induced
constriction in a murine model of asthma. J Appl Physiol 2003,
94:245-252.
28. Lai YL, Chou H: Respiratory mechanics and maximal expira-
tory flow in the anesthetized mouse. J Appl Physiol 2000,
88:939-943.
29. Alarie Y: Computer-based bioassay for evaluation of sensory
irritation of airborne chemicals and its limit of detection.
Arch Toxicol 1998, 72:277-282.