Báo cáo y học: " tatistics review 3: Hypothesis testing and P values." pdf
Bạn đang xem bản rút gọn của tài liệu. Xem và tải ngay bản đầy đủ của tài liệu tại đây (42.74 KB, 4 trang )
AMI=acute myocardial infarction.
Critical Care June Vol 6 No 3 Whitley and Ball
The previous review in this series described how to use confi-
dence intervals to draw inferences about a population from a
representative sample. A common next step in data analysis
is calculation of P values, also known as hypothesis testing.
Hypothesis testing is generally used when some comparison
is to be made. This comparison may be a single observed
value versus some hypothesized quantity (e.g. the number of
babies born in a single delivery to mothers undergoing fertility
treatment as compared with typical singleton birth), or it may
be a comparison of two or more groups (e.g. mortality rates in
intensive care unit patients who require renal replacement
therapy versus those who do not). The choice of which statis-
tical test to use depends on the format of the data and the
study design. Examples of some of the more common tech-
niques will be covered in subsequent reviews. However, the
philosophy behind these statistical tests and the interpreta-
tion of the resulting P values are always the same, and it is
these ideas that are covered in the present review.
The null hypothesis
A typical research question is most easily expressed in terms
of there being some difference between groups. For example,
‘In patients with acute myocardial infarction (AMI), does the
administration of intravenous nitrate (as compared with none)
reduce mortality?’ To answer this question, the most appro-
priate study design would be a randomized controlled trial
comparing AMI patients who receive intravenous nitrate with
control patients. The challenge then is to interpret the results
of that study. Even if there is no real effect of intravenous
nitrate on mortality, sampling variation means that it is
extremely unlikely that exactly the same proportion of patients
in each group will die. Thus, any observed difference
between the two groups may be due to the treatment or it
may simply be a coincidence, in other words due to chance.
The aim of hypothesis testing is to establish which of these
explanations is most likely. Note that statistical analyses can
never prove the truth of a hypothesis, but rather merely
provide evidence to support or refute it.
To do this, the research question is more formally expressed
in terms of there being no difference. This is known as the null
hypothesis. In the current example the null hypothesis would
be expressed as, ‘The administration of intravenous nitrate
has no effect on mortality in AMI patients.’
In hypothesis testing any observed differences between two
(or more) groups are interpreted within the context of this null
hypothesis. More formally, hypothesis testing explores how
likely it is that the observed difference would be seen by
chance alone if the null hypothesis were true.
What is a
P
value?
There is a wide range of statistical tests available, depending
on the nature of the investigation. However, the end result of
any statistical test is a P value. The ‘P ’ stands for probability,
and measures how likely it is that any observed difference
between groups is due to chance. In other words, the P value
is the probability of seeing the observed difference, or
Review
Statistics review 3: Hypothesis testing and
P
values
Elise Whitley
1
and Jonathan Ball
2
1
Lecturer in Medical Statistics, University of Bristol, Bristol, UK
2
Lecturer in Intensive Care Medicine, St George’s Hospital Medical School, London, UK
Correspondence: Editorial Office, Critical Care,
Published online: 18 March 2002 Critical Care 2002, 6:222-225
© 2002 BioMed Central Ltd (Print ISSN 1364-8535; Online ISSN 1466-609X)
Abstract
The present review introduces the general philosophy behind hypothesis (significance) testing and
calculation of P values. Guidelines for the interpretation of P values are also provided in the context of
a published example, along with some of the common pitfalls. Examples of specific statistical tests will
be covered in future reviews.
Keywords hypothesis testing, null hypothesis, P value
Available online />greater, just by chance if the null hypothesis is true. Being a
probability, P can take any value between 0 and 1. Values
close to 0 indicate that the observed difference is unlikely to be
due to chance, whereas a P value close to 1 suggests there is
no difference between groups other than that due to random
variation. The interpretation of a P value is not always straight-
forward and several important factors must be taken into
account, as outlined below. Put simply, however, the P value
measures the strength of evidence against the null hypothesis.
Note that the aim of hypothesis testing is not to ‘accept’ or
‘reject’ the null hypothesis. Rather, it is simply to gauge how
likely it is that the observed difference is genuine if the null
hypothesis is true.
Interpreting
P
values
Continuing with the previous example, a number of trials of
intravenous nitrates in patients with AMI have been carried
out. In 1988 an overview of those that had been conducted
at that time was performed in order to synthesize all the avail-
able evidence [1]. The results from six trials of intravenous
nitrate are given in Table 1.
In the first trial (Chiche), 50 patients were randomly assigned
to receive intravenous nitrate and 45 were randomly assigned
to the control group. At the end of follow up, three of the 50
patients given intravenous nitrate had died versus eight in the
control group. The calculation and interpretation of odds
ratios will be covered in a future review. However, the inter-
pretation in this context is that the odds ratio approximately
represents the risk of dying in the nitrate group as compared
with that in the control group. The odds ratio can take any
positive value (above 0); in this context, values less than 1
indicate a protective effect of intravenous nitrate (a reduction
in risk of death in patients administered intravenous nitrate),
whereas an odds ratio greater than 1 points to a harmful
effect (i.e. an increase in risk of death in patients administered
intravenous nitrate). An odds ratio close to 1 is consistent
with no effect of intravenous nitrate (i.e. no difference
between the two groups). Interpretation of the confidence
intervals is just as described in Statistics review 2, with the
first confidence interval (Chiche) indicating that the true odds
ratio in the population from which the trial subjects were
drawn is likely to be between 0.09 and 1.13.
Initially ignoring the confidence intervals, five of the six trials
summarized in Table 1 have odds ratios that are consistent
with a protective effect of intravenous nitrate (odds ratio <1).
These range from a risk reduction of 17% (Flaherty) to one of
76% (Bussman). In other words, in the Bussman trial the risk
of dying in the nitrate group is about one-quarter of that in the
control group. The remaining trial (Jaffe) has an odds ratio of
2.04, suggesting that the effect of intravenous nitrate might
be harmful, with a doubling of risk in patients given this treat-
ment as compared with those in the control group.
The P values shown in the final column of Table 1 give an indi-
cation of how likely it is that these differences are simply due
to chance. The P value for the first trial (Chiche) indicates that
the probability of observing an odds ratio of 0.33 or more
extreme, if the null hypothesis is true, is 0.08. In other words, if
there is genuinely no effect of intravenous nitrate on the mor-
tality of patients with AMI, then 8 out of 100 such trials would
show a risk reduction of 66% or more just by chance. Equiva-
lently, 2 out of 25 would show such a chance effect. The
question of whether this is sufficiently unlikely to suggest that
there is a real effect is highly subjective. However, it is unlikely
that the management of critically ill patients would be altered
on the basis of this evidence alone, and an isolated result such
as this would probably be interpreted as being consistent with
no effect. Similarly the P value for the Bussman trial indicates
that 1 in 100 trials would have an odds ratio of 0.24 or more
extreme by chance alone; this is a smaller probability than in
the previous trial but, in isolation, perhaps still not sufficiently
unlikely to alter clinical care in practice. The P value of 0.70 in
the Flaherty trial suggests that the observed odds ratio of 0.83
is very likely to be a chance finding.
Comparing the P values across different trials there are two
main features of interest. The first is that the size of the P value
Table 1
Results from six trials of intravenous nitrates in acute myocardial infarction patients
Number dead/randomized
Trial Intravenous nitrate Control Odds ratio 95% confidence interval P value
Chiche 3/50 8/45 0.33 (0.09, 1.13) 0.08
Bussman 4/31 12/29 0.24 (0.08, 0.74) 0.01
Flaherty 11/56 11/48 0.83 (0.33, 2.12) 0.70
Jaffe 4/57 2/57 2.04 (0.39, 10.71) 0.40
Lis 5/64 10/76 0.56 (0.19, 1.65) 0.29
Jugdutt 24/154 44/156 0.48 (0.28, 0.82) 0.007
Critical Care June Vol 6 No 3 Whitley and Ball
is related, to some extent, to the size of the trial (and, in this
context, the proportion of deaths). For example, the odds ratios
in the Lis and Jugdutt trials are reasonably similar, both of which
are consistent with an approximate halving of risk in patients
given intravenous nitrate, but the P value for the larger Jugdutt
trial is substantially smaller than that for the Lis trial. This pattern
tends to be apparent in general, with larger studies giving rise to
smaller P values. The second feature relates to how the P
values change with the size of the observed effect. The Chiche
and Flaherty trials have broadly similar numbers of patients (in
fact, the numbers are somewhat higher in the Flaherty trial) but
the smaller P value occurs in the Chiche study, which suggests
that the effect of intravenous nitrate is much larger than that in
the Flaherty study (67% versus 17% reduction in mortality).
Again, this pattern will tend to hold in general, with more
extreme effects corresponding to smaller P values. Both of
these properties are discussed in considerably more detail in
the next review, on sample size/power calculations.
There are two additional points to note when interpreting P
values. It was common in the past for researchers to classify
results as statistically ‘significant’ or ‘non-significant’, based
on whether the P value was smaller than some prespecified
cut point, commonly 0.05. This practice is now becoming
increasingly obsolete, and the use of exact P values is much
preferred. This is partly for practical reasons, because the
increasing use of statistical software renders calculation of
exact P values increasingly simple as compared with the past
when tabulated values were used. However, there is also a
more pragmatic reason for this shift. The use of a cut-off for
statistical significance based on a purely arbitrary value such
as 0.05 tends to lead to a misleading conclusion of accepting
or rejecting the null hypothesis, in other words of concluding
that a ‘statistically significant’ result is real in some sense.
Recall that a P value of 0.05 means that one out of 20
studies would result in a difference at least as big as that
observed just by chance. Thus, a researcher who accepts a
‘significant’ result as real will be wrong 5% of the time (this is
sometimes known as a type I error). Similarly, dismissing an
apparently ‘non-significant’ finding as a null result may also be
incorrect (sometimes known as a type II error), particularly in
a small study, in which the lack of statistical significance may
simply be due to the small sample size rather than to any real
lack of clinical effect (see the next review for details). Both of
these scenarios have serious implications in terms of practi-
cal identification of risk factors and treatment of disease. The
presentation of exact P values allows the researcher to make
an educated judgement as to whether the observed effect is
likely to be due to chance and this, taken in the context of
other available evidence, will result in a far more informed
conclusion being reached.
Finally, P values give no indication as to the clinical impor-
tance of an observed effect. For example, suppose a new
drug for lowering blood pressure is tested against standard
treatment, and the resulting P value is extremely small. This
indicates that the difference is unlikely to be due to chance,
but decisions on whether to prescribe the new drug will
depend on many other factors, including the cost of the new
treatment, any potential contraindications or side effects, and
so on. In particular, just as a small study may fail to detect a
genuine effect, a very large study may result in a very small P
value based on a small difference of effect that is unlikely to
be important when translated into clinical practice.
P
values and confidence intervals
Although P values provide a measure of the strength of an
association, there is a great deal of additional information to be
obtained from confidence intervals. Recall that a confidence
interval gives a range of values within which it is likely that the
true population value lies. Consider the confidence intervals
shown in Table 1. The odds ratio for the Chiche study is 0.33,
suggesting that the effect of intravenous nitrate is to reduce
mortality by two thirds. However, the confidence interval indi-
cates that the true effect is likely to be somewhere between a
reduction of 91% and an increase of 13%. The results from
that study show that there may be a substantial reduction in
mortality due to intravenous nitrate, but equally it is not possible
to rule out an important increase in mortality. Clearly, if the latter
were the case then it would be extremely dangerous to admin-
ister intravenous nitrate to patients with AMI.
The confidence interval for the Bussman study (0.08, 0.74)
provides a rather more positive picture. It indicates that,
although the reduction in mortality may be as little as 26%,
there is little evidence to suggest that the effect of intravenous
nitrate may be harmful. Administration of intravenous nitrate
therefore appears more reasonable based on the results of that
study, although the P value indicates a 1 in 100 probability that
this may be a chance finding and so the result in isolation might
not be sufficient evidence to change clinical practice.
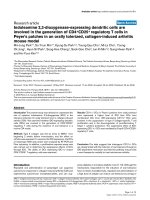
The overview of those trials was carried out because the
results did not appear to be consistent, largely because the
individual trials were generally too small to provide reliable
estimates of effect. A pooled analysis of the data from all of
the nitrate trials shown in Table 1 (and including one other
trial with no deaths) was therefore conducted to obtain a
more robust estimate of effect (for details of the methods
used, see Yusuf et al. [1]). The odds ratios and 95% confi-
dence intervals for the individual trials in Table 1 are shown in
Fig. 1. The odds ratio for each trial is represented by a box,
the size of which is proportional to the amount of statistical
information available for that estimate, and the 95% confi-
dence interval is indicated by a horizontal line. The solid verti-
cal line indicates an odds ratio of 1.0; in other words it shows
the line of ‘no effect’. The combined odds ratio from all six
trials is indicated by the dashed vertical line, and its associ-
ated 95% confidence interval by the diamond at the bottom.
This pooled analysis resulted in an estimated overall odds ratio
of 0.53 with a 95% confidence interval of (0.36, 0.75),
suggesting a true reduction in mortality of somewhere
between one-quarter and two-thirds. Examination of the confi-
dence intervals from individual studies shows a high degree of
overlap with the pooled confidence interval, and so all of the
evidence appears to be consistent with this pooled estimate;
this includes the evidence from the Jaffe study, which, at first
glance, appears to suggest a harmful effect. The P value for
the pooled analysis was 0.0002, which indicates that the
result is extremely unlikely to have been due to chance.
Note that, since that meta-analysis was reported, treatment of
AMI patients has changed dramatically with the introduction of
thrombolysis. In addition, the Fourth International Study of
Infarct Survival (ISIS-4) [2], which randomized over 58,000
patients with suspected AMI, found no evidence to suggest
that mortality was reduced in those given oral nitrates. Thus, in
practice the indications for intravenous nitrates in patients with
AMI are restricted to symptom and blood pressure control.
Specific methods for comparing two or more means or pro-
portions will be introduced in subsequent reviews. In general,
these will tend to focus on the calculation of P values.
However, there is still much to be learned from examination of
confidence intervals in this context. For example, when com-
paring the risk for developing secondary infection following
trauma in patients with or without a history of chronic alcohol
abuse, it may be enlightening to compare the confidence
intervals for the two groups and to examine the extent to
which they do or do not overlap. Alternatively, it is possible to
calculate a confidence interval for the difference in two
means or the difference or ratio of proportions directly. This
can also give a useful indication of the likely effect of chronic
alcohol abuse, in particular by exploring the extent to which
the range of likely values includes or excludes 0 or 1, the
respective expected values of a difference or ratio if there is
no effect of chronic alcohol abuse, or in other words under
the null hypothesis.
Although P values provide a measure of the strength of an
association, an estimate of the size of any effect along with an
associated confidence interval is always required for mean-
ingful interpretation of results. P values and confidence inter-
vals are frequently calculated using similar quantities (see
subsequent reviews for details), and so it is not surprising
that the two are closely related. In particular, larger studies
will in general result in narrower confidence intervals and
smaller P values, and this should be taken into account when
interpreting the results from statistical analyses. Both P
values and confidence intervals have an important role to play
in understanding data analyses, and both should be pre-
sented wherever possible.
Key messages
A P value is the probability that an observed effect is simply
due to chance; it therefore provides a measure of the
strength of an association. A P value does not provide any
measure of the size of an effect, and cannot be used in isola-
tion to inform clinical judgement.
P values are affected both by the magnitude of the effect and
by the size of the study from which they are derived, and
should therefore be interpreted with caution. In particular, a
large P value does not always indicate that there is no associ-
ation and, similarly, a small P value does not necessarily
signify an important clinical effect.
Subdividing P values into ‘significant’ and ‘non-significant’ is
poor statistical practice and should be avoided. Exact P
values should always be presented, along with estimates of
effect and associated confidence intervals.
Competing interests
None declared.
References
1. Yusuf S, Collins R, MacMahon S, Peto R: Effect of intravenous
nitrates on mortality in acute myocardial infarction: an
overview of the randomised trials. Lancet 1988, 1:1088-1092.
2. Anonymous: ISIS-4: a randomised factorial trial assessing
early oral captopril, oral mononitrate, and intravenous magne-
sium sulphate in 58,050 patients with suspected acute
myocardial infarction. Lancet 1995, 345:669-685.
3. Whitley E, Ball J: Statistics review 1: Presenting and sum-
marising data. Crit Care 202, 6:66-71.
4. Whitley E, Ball J: Statistics review 2: Samples and populations.
Crit Care 202, 6:143-148.
Available online />Figure 1
Individual and combined odds ratios and 95% confidence intervals for
six intravenous nitrate trials.
Odds ratio (95% confidence interval)
0.1 0.5
1 2 10
Combined
Jugdutt
Lis
Jaffe
Flaherty
Bussman
Chiche
This article is the third in an ongoing, educational review
series on medical statistics in critical care. Previous articles
have covered ‘presenting and summarising data’ [3] and
‘samples and populations’ [4]. Future topics to be covered
include power calculations, comparison of means,
comparison of proportions, and analysis of survival data to
name but a few. If there is a medical statistics topic you
would like explained, contact us on