Báo cáo y học: " Estimation of airway obstruction using oximeter plethysmograph waveform data" ppsx
Bạn đang xem bản rút gọn của tài liệu. Xem và tải ngay bản đầy đủ của tài liệu tại đây (279.89 KB, 8 trang )
BioMed Central
Page 1 of 8
(page number not for citation purposes)
Respiratory Research
Open Access
Research
Estimation of airway obstruction using oximeter plethysmograph
waveform data
Donald H Arnold*
1
, David M Spiro
†2
, Renee' A Desmond
†3
and
James S Hagood
†4
Address:
1
Departments of Emergency Medicine and Pediatrics, Vanderbilt University School of Medicine, Nashville, Tennessee, USA,
2
Department
of Pediatrics, Section of Emergency Medicine, Yale University School of Medicine, New Haven, Connecticut, USA,
3
Department of Medicine, The
University of Alabama at Birmingham School of Medicine, Birmingham, Alabama, USA and
4
Department of Pediatrics, Division of Pulmonary
Medicine, The University of Alabama at Birmingham School of Medicine, Birmingham, Alabama, USA
Email: Donald H Arnold* - ; David M Spiro - ; Renee' A Desmond - ;
James S Hagood -
* Corresponding author †Equal contributors
Abstract
Background: Validated measures to assess the severity of airway obstruction in patients with
obstructive airway disease are limited. Changes in the pulse oximeter plethysmograph waveform
represent fluctuations in arterial flow. Analysis of these fluctuations might be useful clinically if they
represent physiologic perturbations resulting from airway obstruction. We tested the hypothesis
that the severity of airway obstruction could be estimated using plethysmograph waveform data.
Methods: Using a closed airway circuit with adjustable inspiratory and expiratory pressure relief
valves, airway obstruction was induced in a prospective convenience sample of 31 healthy adult
subjects. Maximal change in airway pressure at the mouthpiece was used as a surrogate measure
of the degree of obstruction applied. Plethysmograph waveform data and mouthpiece airway
pressure were acquired for 60 seconds at increasing levels of inspiratory and expiratory
obstruction. At each level of applied obstruction, mean values for maximal change in waveform area
under the curve and height as well as maximal change in mouth pressure were calculated for
sequential 7.5 second intervals. Correlations of these waveform variables with mouth pressure
values were then performed to determine if the magnitude of changes in these variables indicates
the severity of airway obstruction.
Results: There were significant relationships between maximal change in area under the curve (P
< .0001) or height (P < 0.0001) and mouth pressure.
Conclusion: The findings suggest that mathematic interpretation of plethysmograph waveform
data may estimate the severity of airway obstruction and be of clinical utility in objective assessment
of patients with obstructive airway diseases.
Published: 28 June 2005
Respiratory Research 2005, 6:65 doi:10.1186/1465-9921-6-65
Received: 18 April 2005
Accepted: 28 June 2005
This article is available from: />© 2005 Arnold et al; licensee BioMed Central Ltd.
This is an Open Access article distributed under the terms of the Creative Commons Attribution License ( />),
which permits unrestricted use, distribution, and reproduction in any medium, provided the original work is properly cited.
Respiratory Research 2005, 6:65 />Page 2 of 8
(page number not for citation purposes)
Background
Obstructive airway diseases, including asthma, bronchi-
olitis, obstructive sleep apnea, and chronic obstructive
pulmonary disease (COPD), are common in children and
adults [1-7]. Early recognition and accurate assessment of
the severity of airway obstruction and the response to
therapy are fundamental to the improvement of health for
patients with these disorders. However, objective meas-
ures of airway obstruction currently available in the Emer-
gency Department (ED) and other acute care settings have
significant limitations. Spirometry is frequently not avail-
able in acute clinical settings, including the ED. Peak
expiratory flow rate (PEFR) has been demonstrated to pro-
gressively underestimate airway obstruction with increas-
ing air trapping, making it less reliable as airway
obstruction worsens [8]. As well, the ability of a patient
with moderate to severe airway obstruction to generate an
erroneously normal PEFR and the inability to measure
PEFR in young children render this test less useful in the
setting of an acute asthma exacerbation [8]. Further, both
spirometry and PEFR require patient coordination and
cooperation. Validated, objective measures to determine
severity of airway obstruction in bronchiolitis are nonex-
istent [9].
The pulse oximeter plethysmograph waveform reflects
dynamic net changes in arteriolar inflow and venous out-
flow of tissue bed capillaries interrogated by the oximeter
light emitting diodes [10-12]. Indeed, the oxygen satura-
tion output of the device (Sp0
2
) depends upon isolation
of the oxygenated, arterialized light signal from those
light signals representing tissue, venous blood and other
chromophobes [13]. At levels of arterial oxygen saturation
(Sa0
2
) approaching 100%, the waveform is derived
almost entirely from the infrared (940 nm) signal deter-
mined by oxyhemoglobin concentration and arterialized
flow. Because oxyhemoglobin concentration is constant,
dynamic changes in the waveform are a result of arterial-
ized flow change [13]. Under these conditions the wave-
form represents a plethysmograph, a device measuring
change in volume, in this case change in volume of arteri-
alized blood [11,12,14]. As such, the plethysmograph
waveform has been demonstrated to correlate with radial
artery Doppler waveforms [12].
Changes in the plethysmograph waveform might be use-
ful clinically to estimate the severity of perturbations in
physiologic events influencing arterial flow [10]. Certain
pathologic conditions, most notably airway obstruction,
influence these physiologic events and result in the phe-
nomenon known as pulsus paradoxus [15]. Although pul-
sus paradoxus cannot be readily measured directly from
the plethysmograph waveform, changes in plethysmo-
graph waveform variables might nonetheless correlate
with the physiologic perturbations characteristic of pulsus
paradoxus and be useful in assessing the severity of phys-
iologic alterations resulting from airway obstruction.
Changes in waveform curve or baseline height, one-
dimensional parameters, have been used to estimate pul-
sus paradoxus [16-18]. Pulsus paradoxus represents
change in left ventricular stroke volume, a three-dimen-
sional parameter. As a two-dimensional parameter, area
under the curve may more accurately reflect the physio-
logic events resulting in pulsus paradoxus. Additionally,
the contribution of diastolic blood pressure changes to
pulsus paradoxus have been noted, and AUC measure-
ment might more completely and accurately incorporate
these events [17,19]. Finally, a general principle of signal
analysis maintains that the signal-to-noise ratio improves
at a rate proportionate to the square root of the number of
data points obtained [20]. Area under the curve data may
therefore be less prone to noise artifact than height data,
and might provide a more optimal signal to noise ratio.
With this in mind, changes in area under the waveform
curve might represent a more accurate measure of wave-
form variability than changes in waveform height. Indeed,
Hartert and colleagues have suggested evaluation of area
under the waveform baseline during the respiratory cycle,
rather than baseline height change, as a more accurate
measurement of waveform variation[18].
There are limited data on the levels of intrapleural pres-
sure generated in the presence of most obstructive airway
diseases. However, levels of intrapleural pressure gener-
ated in adults in severe status asthmaticus have been dem-
onstrated to be (-)24.4 ± 6.5 cmH
2
0 on inspiration and
(+)7.6 ± 6.0 cmH
2
0 on expiration [15]. Mouth pressure
reflects intrapleural pressure within 4 cmH
2
0 [21].
In this study our primary objective was to determine
whether maximal change in area under the pulse oximeter
plethysmograph waveform curve correlates with the
degree of experimentally applied airway obstruction
across a range of mouth pressures up to these levels of
obstruction. A secondary objective was to determine
whether maximal changes in height of the plethysmo-
graph waveform curve similarly correlate with the degree
of airway obstruction.
Methods
Study Setting and Population
The study was approved by the University of Alabama at
Birmingham Institutional Review Board as an expedited
study. Informed written consent was obtained from each
subject prior to enrollment. This study was conducted in
the Pulmonary Function Laboratory of an urban chil-
dren's hospital.
Respiratory Research 2005, 6:65 />Page 3 of 8
(page number not for citation purposes)
A prospective convenience sample of healthy young adult
subjects, twenty years of age and above, were recruited.
Subjects with doctor-diagnosed asthma, a history consist-
ent with asthma, or either FEV
1
or FEV
1
/FVC less than 80%
predicted, were excluded from this study. The subjects
underwent spirometry, performed by certified pulmonary
function technicians according to American Thoracic Soci-
ety protocol [22,23].
Study Design and Protocol
We utilized a closed airway circuit to generate airway
obstruction, consisting of a Hans Rudolph 2600 two-way
non-rebreather valve assembly with adjustable spring-
loaded inspiratory and expiratory pressure relief valves
and a mouthpiece pressure transducer port (Hans
Rudolph, Kansas City, MO).
Our experimental method was to allow each subject to
experience increasing levels of inspiratory and expiratory
airway obstruction corresponding to the levels of mouth
pressure and to the estimated levels of intrapleural pres-
sure noted previously [15,21]. The pressure relief valves
were adjusted accordingly at a minimum of five intervals
and a maximum of ten intervals, to provide progressively
increasing levels of mouth pressure from approximately (-
)15 to (-)26 cmH
2
0 on inspiration and (+)2 to (+)9
cmH
2
0 on expiration. Each subject was allowed to rest for
a minimum of one minute before testing at the subse-
quent, increased level of applied resistance in order to
allow the plethysmograph waveform to return to baseline.
Pulse oximeter plethysmograph waveform data was
acquired for 60 seconds at each level of applied
obstruction.
Plethysmographic waveforms were acquired with a Bio-
Pac MP150 data acquisition system using a TSD123A
transducer and an OXY100C pulse oximeter module (Bio-
Pac Systems, Santa Barbara, CA). This apparatus utilizes
optical transmission at red (660 nm) and infrared (940
nm) wavelengths and employs Novametrix Medical Sys-
tems, Inc. artifact rejection and averaging algorithms that
use an eight second pulse history signal to output Sp0
2.
The algorithm averages signal only for Sp0
2
calculation
[24]. Plethysmograph waveform signal was acquired,
processed and analyzed without averaging, smoothing or
filtering. Mouth pressure waveforms were acquired with a
BioPac TSD160C transducer. Transducers were calibrated
according to manufacturer protocol. Waveform data were
analyzed with BioPac Acknowledge software (version
3.7.2). The software algorithm calculates area under the
curve (AUC) as the area encompassed by a waveform from
the point of deflection from baseline to the point of return
to baseline, and calculates height (HT) as height from the
point of deflection from baseline to the waveform peak.
Each subject was studied in the sitting position. A nose
clip was applied, and the subject was instructed to exclu-
sively mouth breathe through the airway circuit at a respi-
ratory rate of approximately 10–16/min and at normal to
slightly increased inspiratory and expiratory effort. Data
were acquired at progressively increasing levels of applied
inspiratory and expiratory obstruction for approximately
60 seconds at each level.
Data collection and processing
Physiologic perturbations occurring during the respiratory
cycle, such as airway obstruction, result in alterations of
arterial flow and the phenomenon known as pulsus para-
doxus [15]. It is these dynamic changes in arterial flow
that we hypothesize might allow estimation of airway
obstruction from oximeter plethysmograph waveform
changes. Timing the measurement of these changes with
the respiratory cycle is difficult in the clinical environment
because patients with these disorders often have rapid res-
piratory rates. For this reason we chose to analyze data
during specified time intervals. In order that at least one
complete respiratory cycle and the corresponding maxi-
mum and minimum mouth pressure be included in each
interval, the interval so chosen was 7.5 seconds.
Data extracted for each 7.5 second interval consisted of
maximum and minimum waveform area under the curve,
maximum and minimum waveform height, and maxi-
mum and minimum mouth pressure. Maximum change
in area under the curve and height were calculated as the
difference between the maximum and minimum values of
each parameter divided by the maximum value of the
respective parameter during the specified 7.5 second inter-
val. Maximum change in mouth pressure was calculated
for the corresponding interval as the absolute difference
between the maximum and minimum mouth pressure in
cmH
2
0. These data were acquired using the Acknowledge
software and entered into a spreadsheet program (Excel,
Microsoft, Redmond, WA). Using the Excel formula func-
tion, mean values for maximal change in area under the
curve, height, and mouth pressure for each level of
applied obstruction were calculated from the multiple
sequential 7.5-second intervals at the corresponding level
of obstruction. This data was then entered into a statistical
analysis program (SAS
®
v9.0, Cary, NC.) for analysis [25].
Outcome Measures
The primary outcome measure was the correlation of
mean maximum change in area under the plethysmo-
graph waveform curve with mean maximum change in
mouth pressure at each successive level of applied
obstruction. The secondary outcome measure was the cor-
responding correlation using mean maximum change in
height.
Respiratory Research 2005, 6:65 />Page 4 of 8
(page number not for citation purposes)
Data Analysis
Subjects in this study contributed multiple observations
to the dataset. Because of this the fundamental assump-
tion of independence across observations was violated.
Performing a separate analysis for each subject would
reduce the number of observations in each analysis and
increase the potential for Type II errors. On the other
hand, if all of the observations were analyzed as inde-
pendent, ignoring the inherent clustering within subjects,
then the potential for Type 1 errors would increase. We
utilized a repeated measures model that takes into
account the clustering and correlation between subjects.
In this analysis, the PROC MIXED procedure in SAS
®
was
used to model the relationship between maximum
change in area under the curve and maximum change in
mouth pressure as well as the relationship between maxi-
mum change in height and maximum change in mouth
pressure. Each subject contributed a single data point for
each level of applied obstruction, representing the average
of the 7.5-second intervals for that level of applied
obstruction. Akaike's Information Criteria was used to
compare the fit of the area under the curve vs. height mod-
els for mouth pressure [25]. An alpha level of p < .05 was
considered statistically significant. A total sample size of
30 subjects would allow us to construct a 95% CI for cor-
relation and achieve a power of 0.8 and a two-tailed alpha
of 0.05.
Results
Forty-eight subjects were enrolled in the study; no subject
experienced any known adverse event during or as a result
of this study. Two subjects were found after enrollment to
have asthma and were excluded from data analysis. Eight
subjects experienced an uncomfortable sensation of dysp-
nea and could not use the closed airway circuit in accord-
ance with study protocol. Data from these subjects was
excluded from analysis. Seven subjects had recurrent elec-
trical interference of the waveform baseline, the source of
which could not be determined after consultation with
software and hardware engineers (BioPac Systems, Santa
Barbara, CA). Data from these seven subjects was
excluded from analysis. Overall thirty-one subjects met
inclusion criteria and had data included for analysis.
Of these thirty-one subjects, eleven were male and twenty
were female. The mean age was 29.9 years with a median
of 28 years and range of 23 to 48 years. One subject had a
prior history of cigarette smoking. No subject had heart or
lung disease. One subject performed breathing maneuvers
at five levels of applied obstruction, one subject at eight
levels, six subjects at nine levels, and twenty-three subjects
at ten levels. A total of 297 data points were available for
analysis. Plethysmograph waveforms were noted to return
to baseline during the period of rest (at least 1 minute)
between sequentially increasing levels of applied
resistance.
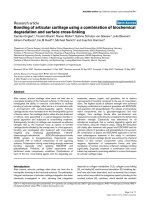
Subjects were noted to generate plethysmograph wave-
forms visually significant for periodic changes with the
respiratory cycle, similar to changes characteristic of pul-
sus paradoxus, when utilizing this apparatus (Figure 1).
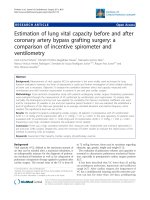
There was a significant relationship between plethysmo-
graph waveform maximum change in area under the curve
and maximum change in mouth pressure (P < 0.0001)
(Figure 2). The prediction equation for each cmH
2
0 max-
imum change in mouth pressure was 12.01 + 37.21 ×
(maximum change in area under the curve), 95% CI for
coefficient = 30.56 to 43.87. Similarly, there was a signifi-
cant relationship between maximum change in height
and maximum change in mouth pressure (P <0.0001).
The prediction equation for each cmH
2
0 maximum
change in mouth pressure was 16.10 + 35.94 × (maxi-
mum change in height), 95% CI for coefficient = 27.57 to
43.30. A comparison of Akaike's Information Criteria
(AIC) between the models showed that the AIC statistic
was smaller for the area under the curve model than the
height model, indicating a better model fit for the area
under the curve model.
Discussion
Pulse oximetry is widely available and applied in acute
care settings. The device outputs a continuous plethysmo-
graphic waveform corresponding to flow of arterialized
blood in the tissue bed to which the transducer is applied
[10,12-14]. It is plausible that, in the setting of airway
obstruction, such changes in arteriolar flow might reflect
alterations in left ventricular stroke volume resulting from
the same physiologic perturbations that abnormally
increase pulsus paradoxus. It is thus of interest whether
the severity of airway obstruction might be estimated
from changes in mathematic plethysmograph waveform
variables. The study results indicate a correlation between
maximum changes in area under the curve or in height of
the plethysmograph waveform and the severity of airway
obstruction.
Analysis of both direct arterial waveform and oximeter
plethysmograph waveform data for calculation of arterial
flow have previously been explored in the laboratory set-
ting. Cerutti and colleagues provide compelling data from
conscious, freely moving Sprague-Dawley rats [26]. These
investigators compared different models of central arterial
line waveform analysis with simultaneously recorded car-
diac output. A model using different waveform parame-
ters identified by multiple linear regression analysis
provided a reliable and precise estimation of cardiac out-
put. Although these investigators did not use oximeter
plethysmograph waveforms, their findings nonetheless
support the principal of waveform analysis. Steele and
Respiratory Research 2005, 6:65 />Page 5 of 8
(page number not for citation purposes)
colleagues performed an unblinded study on one healthy
adult, breathing through a valve to which airway resist-
ance was applied to artificially induce pulsus paradoxus.
For this subject, the percent decrease in plethysmograph
waveform height during the respiratory cycle correlated
modestly with pulsus paradoxus calculated similarly from
intra-arterial waveform (r = 0.59, 95% CI 0.32 to 0.78).
This study was limited by the small subject size (n = 1)
and did not measure the degree of airway obstruction gen-
erated by the resistance valves in use. The technique relied
upon determination of phases of the respiratory cycle and
capture of waveform indices in accordance with estimated
peak inspiration and expiration [16].
In the clinical setting, variation of the oximeter plethys-
mograph waveform baseline has been noted to occur dur-
ing the respiratory cycle and to represent fluctuations in
local venous pressure [14,18]. Hartert and colleagues
hypothesized that this respiratory waveform variation
might occur in response to pleural pressure changes and
thus reflect changes in left ventricular stroke volume and
pulsus paradoxus. This was studied in adult patients
admitted to an ICU with obstructive airway disease, 46%
of whom were receiving mechanical ventilation. Respira-
tory waveform variation was significantly correlated with
manually measured pulsus paradoxus (R
2
= 0.88) as well
as with auto-PEEP (R
2
= 0.96) [18]. Frey and Butt com-
pared simultaneous 1 minute paper recordings of intra-
arterial pressure and plethysmograph waveforms in 62
non-intubated children with and without respiratory dis-
ease. Correlation was noted (r = 0.85) between changes in
plethysmograph waveform height and pulsus paradoxus
determined from intra-arterial waveform height change
[17]. Our study demonstrates that maximal change in
height and in area under the plethysmograph waveform
curve might provide a non-invasive, clinically relevant
estimate of the severity of airway obstruction.
A possible limitation to our study was the method of arti-
ficially inducing airway obstruction. The dynamic biome-
chanical changes occurring during an asthma
exacerbation are not ideally simulated by externally
applied resistance [27]. Also, in lieu of invasive, intra-arte-
rial waveform analysis as the dependent variable and
Oximeter plethysmographic waveform (Pleth) generated with inspiratory and expiratory pressure relief valve apparatusFigure 1
Oximeter plethysmographic waveform (Pleth) generated with inspiratory and expiratory pressure relief valve apparatus. Cor-
responding mouth pressure indicates pressure at airway circuit mouthpiece.
Respiratory Research 2005, 6:65 />Page 6 of 8
(page number not for citation purposes)
reference standard, the study protocol utilized change in
mouth pressure as a surrogate measure of obstruction
induced. The levels of progressive obstruction were not
standardized, except insofar as the mouth pressure gener-
ated reflects intrapleural pressure [21]. As well, subjects
were exposed to both inspiratory and expiratory obstruc-
tion during the test period. It is of interest whether corre-
lations of waveform parameters may differ during isolated
inspiratory or expiratory obstruction. Other variables that
may influence the plethysmograph waveform, including
hydration status, hyperinflation, and tidal volume, were
likewise not controlled for in this study.
Our method of using time intervals to measure changes in
plethysmograph waveform AUC, HT and mouth pressure
is unique. Pulsus paradoxus has traditionally been deter-
mined by noting the difference between the systolic pres-
sure at which heart sounds are heard only during
expiration and the point at which they are heard continu-
ously [28-30]. However, in the tachypneic patient it is
often difficult to correlate auscultation of heart sounds
with the corresponding phase of the respiratory cycle.
With this in mind, we chose to analyze data during speci-
fied time intervals that would encompass at least one res-
piratory cycle. The chosen interval, 7.5 seconds, was based
upon the expected duration of the respiratory cycle in our
subjects.
We additionally chose to utilize the average values of data
extracted from sequential intervals at each level of applied
obstruction. Frey and Freezer demonstrated significant
intrasubject variation of breath-to-breath measurement of
pulsus paradoxus utilizing arterial waveform tracings, and
averaging of pulsus paradoxus determined from multiple
consecutive respiratory cycles was reported to be more
accurate [19]. Pulse oximeters have incorporated an anal-
ogous technology for calculation of Sp0
2
, running
weighted signal averaging, to minimize the effect of signal
artifact and to thus enhance the reliability and validity of
the calculated Sp0
2
[13]. Oxygen saturation is calculated
Relationship between maximum changes in mouth pressure and area under the plethysmograph waveform curveFigure 2
Relationship between maximum changes in mouth pressure and area under the plethysmograph waveform curve.
0
5
10
15
20
25
30
35
40
45
0 0.1 0.2 0.3 0.4 0.5 0.6 0.7 0.8
M aximum Change in Waveform Area Under the Cur ve
Maximum Change in Mouth Pressure (cmH20)
y= 12.01 + 37.21 (change AUC)
Respiratory Research 2005, 6:65 />Page 7 of 8
(page number not for citation purposes)
30 times per second with values averaged over a mini-
mum of several seconds. Each instantaneous value is first
compared with this moving average and assigned a
weighted value based upon variation from the moving
average. This weighted value then contributes to the mov-
ing average that in turn is displayed as the Sp0
2
value [13].
Our analysis may minimize the influence of individual
waveform and respiratory cycle artifact and thus enhance
the internal validity of the estimated airway obstruction.
With these elements of waveform analysis in mind, our
method of measuring waveform parameters may repre-
sent a strength of study design rather than a limitation.
Conclusion
There is accumulating evidence that the plethysmograph
waveform might provide clinically useful information.
Our results suggest that analysis of oximeter plethysmo-
graph waveform data may be feasible for real-time estima-
tion of airway obstruction. To our knowledge this is the
first investigation of area under the curve as a waveform
parameter of potential value, and our results indicate that
this parameter may achieve better correlation with airway
obstruction than analyses based on waveform height. A
non-invasive, real-time method to estimate the severity of
airway obstruction, as well as other disorders involving
pulsus paradoxus physiology, might enhance the ability
of clinicians to identify and quantify the severity of such
disorders [31]. An essential step in the development of
such technology is to validate the physiologic relevance of
estimating the severity of these pathophysiologic events
from the oximeter plethysmograph waveform. Future
study of patients with obstructive airway disease in the
clinical environment, using a quantifiable, objective crite-
rion standard such as FEV
1
will enable further assessment
of oximeter plethysmograph waveform parameters to pre-
dict severity of airway obstruction. Should the accuracy
and feasibility of such a tool be demonstrated in the clin-
ical environment, development of this technology for rou-
tine clinical practice may be justified.
Competing interests
Don Arnold has applied for patent protection for methods
of waveform analysis discussed in this manuscript.
Authors' contributions
DA was the principal investigator and participated in
study concept and design, acquisition of the data, drafting
of the manuscript and obtained institutional funding for
this study to be conducted.
DS was a co-investigator and participated in study concept
and design, acquisition of the data, drafting of the manu-
script and critical revision of the manuscript for important
intellectual content.
RD assisted in the statistical design and analysis and inter-
pretation of the data, and provided critical revision of the
manuscript for important intellectual content.
JH participated in study concept and design, acquisition
of the data, drafting of the manuscript, critical revision of
the manuscript for important intellectual content, and
supervised the study.
Grants
This study was funded by a grant from The Research Insti-
tute at The Children's Hospital of Alabama.
Acknowledgements
The authors are gratified for the assistance of Sheila S. Gibson, R.R.T.,
R.P.F.T. Johanna Kimbrough, R.P.T., and Bettye Mitchell, R.P.T. in the con-
duct of this study.
References
1. Mannino DM, Homa DM, Akinbami LJ, Moorman JE, Gwynn C, Redd
SC: Surveillance for asthma United States, 1980-1999.
MMWR Surveill Summ 2002, 51:1-13.
2. Asthma prevalence and control characteristics by race/eth-
nicity United States, 2002. MMWR Morb Mortal Wkly Rep 2004,
53:145-148.
3. Akinbami LJ, Schoendorf KC: Trends in childhood asthma: prev-
alence, health care utilization, and mortality. Pediatrics 2002,
110:315-322.
4. Asthma mortality and hospitalization among children and
young adults United States, 1980-1993. MMWR Morb Mortal
Wkly Rep 1996, 45:350-353.
5. Denny FW, Clyde WAJ: Acute lower respiratory tract infec-
tions in nonhospitalized children. J Pediatr 1986, 108:635-646.
6. Shay DK, Holman RC, Newman RD, Liu LL, Stout JW, Anderson LJ:
Bronchiolitis-associated hospitalizations among US children,
1980-1996. JAMA 1999, 282:1440-1446.
7. Pauwels RA, Buist AS, Calverley PM, Jenkins CR, Hurd SS: Global
strategy for the diagnosis, management, and prevention of
chronic obstructive pulmonary disease. NHLBI/WHO Glo-
bal Initiative for Chronic Obstructive Lung Disease (GOLD)
Workshop summary. Am J Respir Crit Care Med 2001,
163:1256-1276.
8. Eid N, Yandell B, Howell L, Eddy M, Sheikh S: Can peak expiratory
flow predict airflow obstruction in children with asthma?
Pediatrics 2000, 105:354-358.
9. Mallory MD, Shay DK, Garrett J, Bordley WC: Bronchiolitis Man-
agement Preferences and the Influence of Pulse Oximetry
and Respiratory Rate on the Decision to Admit. Pediatrics
2003, 111:e45-e51.
10. Cook LB: Extracting arterial flow waveforms from pulse oxi-
meter waveforms apparatus. Anaesthesia 2001, 56:551-555.
11. Kim JM, Arakawa K, Benson KT, Fox DK: Pulse oximetry and cir-
culatory kinetics associated with pulse volume amplitude
measured by photoelectric plethysmography. Anesth Analg
1986, 65:1333-1339.
12. Wisely NA, Cook LB: Arterial flow waveforms from pulse oxi-
metry compared with measured Doppler flow waveforms
apparatus. Anaesthesia 2001, 56:556-561.
13. Wukitsch MW, Petterson MT, Tobler DR, Pologe JA: Pulse oxime-
try: analysis of theory, technology, and practice. J Clin Monit
1988, 4:290-301.
14. Murray WB, Foster PA: The peripheral pulse wave: information
overlooked. J Clin Monit 1996, 12:365-377.
15. Jardin F, Farcot JC, Boisante L, Prost JF, Gueret P, Bourdarias JP:
Mechanism of paradoxic pulse in bronchial asthma. Circulation
1982, 66:887-894.
16. Steele DW, Wright RO, Lee CM, Jay GD: Continuous noninvasive
determination of pulsus paradoxus: a pilot study. Acad Emerg
Med 1995, 2:894-900.
Publish with BioMed Central and every
scientist can read your work free of charge
"BioMed Central will be the most significant development for
disseminating the results of biomedical research in our lifetime."
Sir Paul Nurse, Cancer Research UK
Your research papers will be:
available free of charge to the entire biomedical community
peer reviewed and published immediately upon acceptance
cited in PubMed and archived on PubMed Central
yours — you keep the copyright
Submit your manuscript here:
/>BioMedcentral
Respiratory Research 2005, 6:65 />Page 8 of 8
(page number not for citation purposes)
17. Frey B, Butt W: Pulse oximetry for assessment of pulsus para-
doxus: a clinical study in children. Intensive Care Med 1998,
24:242-246.
18. Hartert TV, Wheeler AP, Sheller JR: Use of pulse oximetry to rec-
ognize severity of airflow obstruction in obstructive airway
disease: correlation with pulsus paradoxus. Chest 1999,
115:475-481.
19. Frey B, Freezer N: Diagnostic value and pathophysiologic basis
of pulsus paradoxus in infants and children with respiratory
disease. Pediatr Pulmonol 2001, 31:138-143.
20. Sijbers J, Scheunders P, Bonnet N, Van Dyck D, Raman E: Quantifi-
cation and improvement of the signal-to-noise ratio in a
magnetic resonance image acquisition procedure. Magn
Reson Imaging 1996, 14:1157-1163.
21. Karam M, Wise RA, Natarajan TK, Permutt S, Wagner HN: Mecha-
nism of decreased left ventricular stroke volume during
inspiration in man. Circulation 1984, 69:866-873.
22. Lung function testing: selection of reference values and
interpretative strategies. American Thoracic Society. Am
Rev Respir Dis 1991, 144:1202-1218.
23. Standardization of Spirometry, 1994 Update. American
Thoracic Society. Am J Respir Crit Care Med 1995, 152:1107-1136.
24. Biopac Systems I: Research catalog for the life sciences. 2003
[ />]. Santa Barbara, CA, Biopac Sys-
tems, Inc.
25. Littell RC, Milliken GASWW, Wolfinger RD: SAS System for Mixed
Models North Carolina, SAS Institute, Inc; 2004.
26. Cerutti C, Gustin MP, Molino P, Paultre CZ: Beat-to-beat stroke
volume estimation from aortic pressure waveform in con-
scious rats: comparison of models. Am J Physiol Heart Circ Physiol
2001, 281:H1148-H1155.
27. Kelsen SG, Prestel TF, Cherniack NS, Chester EH, Deal ECJ: Com-
parison of the respiratory responses to external resistive
loading and bronchoconstriction. J Clin Invest 1981,
67:1761-1768.
28. Blood vessels examination and findings. In Mosby's guide to phys-
ical examination Volume 14. 5th edition. Edited by: HM S. St. Louis,
Mosby; 2003:481.
29. The cardiovascular system. In Bates' guide to physical examination
and history taking Edited by: LS B and PG S. Philadelphia, Lippincott
Williams & Wilkins; 2003:285.
30. e B, JK P: Physical examination of the heart and circulation. In
Heart Disease, A textbook of Cardiovascular Medicine Volume 4. 6th edi-
tion. Edited by: e B, PZ Z and P L. Philadelphia, WB Saunders;
2001:45-81.
31. Tamburro RF, Ring JC, Womback K: Detection of pulsus para-
doxus associated with large pericardial effusions in pediatric
patients by analysis of the pulse-oximetry waveform. Pediat-
rics 2002, 109:673-677.