Báo cáo khoa học: "Metabolic profiles in five high-producing Swedish dairy herds with a history of abomasal displacement and ketosis" ppsx
Bạn đang xem bản rút gọn của tài liệu. Xem và tải ngay bản đầy đủ của tài liệu tại đây (326.44 KB, 11 trang )
BioMed Central
Page 1 of 11
(page number not for citation purposes)
Acta Veterinaria Scandinavica
Open Access
Research
Metabolic profiles in five high-producing Swedish dairy herds with a
history of abomasal displacement and ketosis
Lena Stengärde*
1
, Madeleine Tråvén
1
, Ulf Emanuelson
1
, Kjell Holtenius
2
,
Jan Hultgren
3
and Rauni Niskanen
4
Address:
1
Division of Ruminant Medicine and Epidemiology, Department of Clinical Sciences, Swedish University of Agricultural Sciences, P.O.
Box 7054, SE-75007, Uppsala, Sweden,
2
Department of Animal Nutrition and Management, Swedish University of Agricultural Sciences,
Kungsängen Research Centre, SE-75323, Uppsala, Sweden,
3
Department of Animal Environment and Health, Swedish University of Agricultural
Sciences, P.O. Box 234, SE-53223, Skara, Sweden and
4
Meat Control Division, National Food Administration, P.O. Box 622, SE-75126, Uppsala,
Sweden
Email: Lena Stengärde* - ; Madeleine Tråvén - ;
Ulf Emanuelson - ; Kjell Holtenius - ; Jan Hultgren - ;
Rauni Niskanen -
* Corresponding author
Abstract
Background: Body condition score and blood profiles have been used to monitor management
and herd health in dairy cows. The aim of this study was to examine BCS and extended metabolic
profiles, reflecting both energy metabolism and liver status around calving in high-producing herds
with a high incidence of abomasal displacement and ketosis and to evaluate if such profiles can be
used at herd level to pinpoint specific herd problems.
Methods: Body condition score and metabolic profiles around calving in five high-producing herds
with high incidences of abomasal displacement and ketosis were assessed using linear mixed models
(94 cows, 326 examinations). Cows were examined and blood sampled every three weeks from
four weeks ante partum (ap) to nine weeks postpartum (pp). Blood parameters studied were
glucose, fructosamine, non-esterified fatty acids (NEFA), insulin, β-hydroxybutyrate, aspartate
aminotransferase, glutamate dehydrogenase, haptoglobin and cholesterol.
Results: All herds had overconditioned dry cows that lost body condition substantially the first 4–
6 weeks pp. Two herds had elevated levels of NEFA ap and three herds had elevated levels pp. One
herd had low levels of insulin ap and low levels of cholesterol pp. Haptoglobin was detected pp in
all herds and its usefulness is discussed.
Conclusion: NEFA was the parameter that most closely reflected the body condition losses while
these losses were not seen in glucose and fructosamine levels. Insulin and cholesterol were
potentially useful in herd profiles but need further investigation. Increased glutamate
dehydrogenase suggested liver cell damage in all herds.
Published: 7 August 2008
Acta Veterinaria Scandinavica 2008, 50:31 doi:10.1186/1751-0147-50-31
Received: 17 March 2008
Accepted: 7 August 2008
This article is available from: />© 2008 Stengärde et al; licensee BioMed Central Ltd.
This is an Open Access article distributed under the terms of the Creative Commons Attribution License ( />),
which permits unrestricted use, distribution, and reproduction in any medium, provided the original work is properly cited.
Acta Veterinaria Scandinavica 2008, 50:31 />Page 2 of 11
(page number not for citation purposes)
Background
At the onset of lactation the nutrient demand increases
dramatically and faster than the increase in feed intake.
Thus most dairy cows face negative energy balance (NEB)
in early lactation. Postpartum (pp) feed intake is lower in
cows with higher body condition scores (BCS) ante par-
tum (ap), leaving them in NEB for a longer period than
cows with normal or low BCS [1,2]. Most diseases in dairy
cows occur during the first two weeks pp [3]. Metabolic
disorders are highly multi-factorial and a wide range of
animal, management and feed factors may lead to such
problems. Fatty liver may occur around calving when the
cow is in NEB and blood levels of non-esterified fatty
acids (NEFA) increase as the cow mobilizes adipose tissue.
Fatty liver has been shown to be associated with other dis-
eases in the periparturient period [4].
Blood profiles have frequently been used to assess nutri-
ent status of cows in the transition period [5-9]. Also the
BCS is used in the management of dairy herds [10]. Early
blood profiles included packed cell volume and haemo-
globin [6] along with glucose, proteins and minerals.
More recently, metabolites such as NEFA and β-hydroxy-
butyrate (BHB) have been added to the profiles to moni-
tor energy balance. Blood profiles are considered useful to
identify nutritional shortcomings even before the produc-
tivity is impaired [11]. Such profiles have also been used
to monitor herd health and to find subclinical disease, to
predict risk of ketosis or abomasal displacement as well as
investigate herd problems with metabolic disorders [12-
15].
Blood parameters that may reflect nutrient status of the
cow, such as glucose, fructosamine, insulin, NEFA, BHB
and cholesterol, also enzymes and proteins that reveal
liver status are of interest to include in transition period
profiles. Fructosamines are complexes produced by an
irreversible, nonenzymatic glycosylation of proteins and
serum concentrations depend on glucose and protein
concentrations and provide a retrospective record of
blood glucose levels during the previous one to three
weeks. Fructosamine has been suggested as a parameter to
monitor glucose levels over longer periods in an attempt
to avoid the variability in glucose associated with diurnal
fluctuations [16-18]. In accordance with observations in
companion animals and humans where fructosamine is
used to monitor blood glucose levels in diabetic patients
[19,20], cows with markedly elevated levels of glucose
have been observed to have elevated levels of fructos-
amine [Tråvén and Holtenius, unpublished data].
Part of the variation in cholesterol may be explained by
dry matter intake [21], where a lower feed intake leads to
lower cholesterol levels. Low cholesterol levels the first
weeks after calving have also been associated with fatty
liver pp [22-24]. The liver cell enzymes aspartate ami-
notransferase (AST) and glutamate dehydrogenase (GD)
may leak into the blood stream when liver cell damage
occurs in dairy cattle [25]. The acute phase protein hap-
toglobin rises in response to inflammation [26]. It has
also been associated with fatty liver in dairy cows [27,28].
It is therefore of interest to study an extended palette of
blood parameters where new candidates such as fructos-
amine, haptoglobin, GD and cholesterol may be intro-
duced in herd health management.
The aim of this study was to examine BCS and extended
metabolic profiles, reflecting both energy metabolism and
liver status around calving in high-producing herds with a
high incidence of abomasal displacement and ketosis and
to evaluate if such profiles can be used at herd level to pin-
point specific herd problems.
Methods
Dairy herds enrolled in the Swedish official milk record-
ing scheme (SOMRS) with more than 100 cows and a pro-
duction of at least 9 500 kg energy-corrected milk (ECM)
per cow annually (representing 85%, 7.8% and 38% of
Swedish dairy herds, respectively) were eligible for inclu-
sion in this study. Abomasal displacement and ketosis
were chosen as indicators of metabolic imbalances in the
transition period. To find long-term problem herds, prac-
ticing veterinarians in two regions, around the Skara and
Uppsala areas, were asked for eligible herds where aboma-
sal displacement and ketosis had been a problem for sev-
eral years. The herds had to have a minimum of 6 cases of
abomasal displacement or ketosis or both per 100 lactat-
ing cows within the last year to be identified as herds with
a high disease frequency compared to the Swedish average
herd. The average incidence of abomasal displacement
and ketosis in 2005/2006 was 1.0 and 1.3 cases per 100
cows, respectively [29]. The sample size was set to five and
the first five herds that were asked to participate accepted
(herds A-E).
Herds A, B, C and E were visited during the period of Jan-
uary-June and herd D and E were visited during Septem-
ber-December 2005. All herd visits were carried out by
one veterinarian (LS), except for three consecutive visits in
herd E that were carried out by another veterinarian. At
each visit, dry cows and heifers within four weeks of
expected calving were clinically examined and blood was
sampled. The cows were re-examined and re-sampled
every three weeks until nine weeks pp and until at least 15
cows had been examined in each herd. The clinical exam-
ination included general condition and BCS. BCS was
assessed on a five-point scale with half-point increments,
where one represents an emaciated cow and five a severely
overconditioned cow [30]. BCS ap was defined as BCS
four weeks to one day ap. If cows were scored twice ap, the
Acta Veterinaria Scandinavica 2008, 50:31 />Page 3 of 11
(page number not for citation purposes)
averages of the scorings were used. BCS loss was defined
as the difference between BCS ap and BCS at week 4–6 pp.
In each herd, information about management, housing,
feed and herd health was gathered through standardized
questions by the visiting veterinarian. Herd data on milk
yield, herd size and disease incidence, as well as individ-
ual data for cows, such as breed, date of calving, parity and
diseases during the study period, were retrieved from the
SOMRS. The study, including the handling of animals,
was approved by the local ethics committee in Göteborg,
Sweden (reference number 269–2004).
Feed hygiene samples
Samples of silage and grain produced on-farm were taken
at storage in silos or in the grain roller. The samples were
analysed for hygiene parameters with commercial meth-
ods at the laboratory of the Department of Animal Feed,
National Veterinary Institute, Uppsala, Sweden. Silage
samples were analysed for pH and microbial growth and
grain samples were analysed for water activity, microbial
growth, and per cent endogenously infected kernels. The
microbiological quality of the feed samples was assessed
by the analysing laboratory.
Blood samples
Blood from the coccygeal vein or artery of each cow was
collected in evacuated test tubes without additives and
tubes with FluoridHeparin (CAT/FH, BD Vacutainer Sys-
tems). Blood samples were refrigerated and transported to
a field station. Samples were centrifuged at 2000 g for 10
min and serum and plasma were harvested, and frozen
within 6 h from sampling. Samples were stored at -20°C
up to 5 months before analysis.
Serum and plasma samples were analysed at the Clinical
Pathology Laboratory, University Animal Hospital, SLU,
Uppsala using commercial kits according to the manufac-
turers' instructions. Haemolysed samples were excluded
(n = 1). Serum haptoglobin (PHASE RANGE, Hap-
toglobin Assay, Tridelta Development Ltd, Bray, Ireland)
and BHB (β-Hydroxybutyrate LiquiColor Procedure No.
2440, STANBIO laboratory, Boerne, TX., US) were ana-
lysed on a Cobas MIRA chemistry analyser (Roche Diag-
nostica, Basel, Switzerland). Serum activities of AST (AST/
GOT, IFCC, Konelab, Thermo Electron Corporation, Van-
taa, Finland), GD (GLDH, Roche Diagnostics GmbH,
Mannheim, Germany), as well as concentrations of total
cholesterol(CHOLESTEROL, Konelab, Thermo Electron
Corporation), NEFA (NEFA C, ACS-ACOD method, Wako
Chemicals GmbH, Neuss, Germany), fructosamine (Fruc-
tosamine, ABX Pentra, Montpellier, France) and plasma
glucose (GLUCOSE, HK, Konelab, Thermo Electron Cor-
poration) were determined on a Konelab 30 chemistry
analyser (Thermo Electron Corporation). Serum insulin
was analysed with a porcine insulin radioimmunoassay
(PORCINE INSULIN RIA KIT, Linco research, St. Charles,
MO., US) using a Cobra II Auto-Gamma counter (Packard
Instrument Company, Meriden, CT., US).
Data analyses
Cows with only one observation (39 cows), and observa-
tions from cows with a disturbed general condition at
clinical examination or diagnosed with clinical disease ±
5 days from sampling (18 observations) were excluded.
Further, observations ± 1 day around parturition were
excluded from the analyses (17 observations) because
blood metabolites during this period are more affected by
parturition per se and may thus be less useful as indicators
of metabolic status. The remaining 326 observations were
included in the study.
Herd-specific patterns for blood parameters and BCS were
analysed by linear mixed models as applied in the MIXED
procedure of SAS (SAS version 9.1, SAS Institute, Cary,
NC., USA). The repeated statement and an unstructured
covariance matrix were used to account for the repeated
sampling within cow and herd. All outcome variables
were measured on a continuous scale. BCS, glucose and
fructosamine were used without transformations while
NEFA, insulin, BHB, AST, GD and haptoglobin were log-
transformed and cholesterol was square-root-transformed
to get normally distributed residuals. Predictor variables
included as fixed effects in the models were breed, parity,
week, herd and the interaction between week and herd.
Breed was classified into Swedish Red, Swedish Holstein
and other/crossbreeds. Parity was classified as first, second
or third or more lactations. Week was classified as one-
week intervals from 3 weeks ap to 9 weeks pp, but values
from week 4 ap were included in week 3 ap.
The statistical significance of differences in herd-specific
patterns was tested by combining weekly estimates from
the models in four periods using the estimate statement in
the MIXED procedure; four weeks ap to partum, partum to
three weeks pp, 4–6 weeks pp and 7–9 weeks pp. Model
validation was done by examining residuals with respect
to equal variance and a normal distribution, and all mod-
els were found to be valid. A coefficient of determination
(R
2
) was approximated by the squared correlation
between observed and predicted values [31].
Results
Herd data
Ninety-four clinically healthy cows and a total of 326
examinations were included in the study. The herds had
150 to 300 cows per herd and produced 9 500 to 11 500
kg ECM per cow and year. The distribution of cows and
observations over predictor variables is shown in Table 1.
Cows were milked twice daily except for high-yielding
Acta Veterinaria Scandinavica 2008, 50:31 />Page 4 of 11
(page number not for citation purposes)
cows in herd B, that were milked in an automated milking
system (average number of milkings was 2.5 times/day).
All herds kept lactating cows in loose housing systems
where they were fed total mixed rations. Herd A had a con-
centrate:roughage ratio of 55:45 and top fed cows accord-
ing to milk production. Herd B had a ratio of 30:70, herd
C a ratio of 30:70, herd D a ratio of 60:40 and herd E a
ratio of 60:40. Dry cows received straw ad lib and a
restricted ration of either TMR or silage. Feed to dry cows
in herd A consisted of only straw one day and restricted
rations of TMR the next day until close-up diet was
applied 2–3 weeks ap. As close-up diets, all herds received
restricted rations of TMR starting 2–3 weeks ap. In week 6
pp, herd D changed to a batch of silage (according to the
questionnaire) in which hygiene quality problems were
detected. Herds A and E held dry cows in tie stalls and
herds A, B and C held dry cows and heifers separate from
lactating cows until after calving. Herd A and B had a sep-
arate group for dry animals receiving close-up diet while
herd C held all dry cows and heifers in one group irrespec-
tive of time to calving. Disease frequency and recorded
cases of abomasal displacement and ketosis per 100 cows
in the 12-month period preceding the last herd visit are
shown in Table 2.
Feed hygiene
The pH in silage samples ranged from 2.8 to 4.2. Single
silage samples from herds A, B, C and the first sample in
herd D and E had acceptable microbiological quality.
Reduced microbiological quality was found in silage sam-
ples from herd D and E. Silage from herd D was sampled
again after a change from first cut to second cut, due to
diarrhoea in all cows, and detectable levels of Enterobacte-
riaceae and abundant growth of Aspergillus fumigatus was
found. In the first two silage samples from herd E during
the fall, detectable and abundant growth of Penicillium
Table 1: Distribution of observations over class predictor variables
Predictor variable Class Number of
cows
Number of
samples
Breed Swedish Red 12 41
Swedish Holstein 56 192
Other breeds or crossbreeds 26 93
Parity First lactation 19 67
Second lactation 35 128
Third or more lactations 40 131
Week w 4 and 3 ap 38
w 2 ap 28
w 1 ap 28
w 1 pp 19
w 2 pp 22
w 3 pp 37
w 4 pp 33
w 5 pp 24
w 6 pp 32
w 7 pp 30
w 8 pp 20
w 9 pp 15
Herd A 19 69
B2274
C1859
D1342
E2282
antepartum (ap), postpartum (pp)
Table 2: Disease frequency in number of cases (and per cent) in herds A-E during the 12-month period preceding the last herd visit
Herd Cow-years Date of last visit DA K DA+K Total
A 149 2005-06-14 6 (4.0%) 8 (5.4%) 9.4% 97 (65.1%)
B 263 2005-05-02 6 (2.3%) 4 (1.5%) 3.8% 39 (14.8%)
C 499 2005-06-15 8 (1.6%) 7 (1.4%) 3.0% 181 (36.3%)
D 151 2005-12-08 9 (6.0%) 1 (0.6%) 6.6% 70 (46.4%)
E 164 2005-12-22 9 (5.5%) 1 (0.6%) 6.1% 141 (86.0%)
displaced abomasum (DA), ketosis (K) and total disease incidence (Total) recorded
Acta Veterinaria Scandinavica 2008, 50:31 />Page 5 of 11
(page number not for citation purposes)
roqueforti was found, respectively. The third sample held
acceptable microbiological quality.
Herds A, B, D and E used grain produced on-farm. The
water activities in the samples were from 0.69 to 0.76.
Herds A and B had grain samples with reduced microbio-
logical quality. Grain from herd A had an elevated water
activity of 0.71 (reference value < 0.70 [32]), sparse
growth of Penicillium spp., moderate growth of Aspergillus
fumigatus and abundant growth of Fusarium spp. and
Cladosporium spp. Grain from herd B had an elevated
water activity of 0.76. Aerobic bacteria (log 8.5) and
moulds (log 5.3) were considered above threshold (<log
7.7 and <log 5.0, respectively [33]), and 20% of the ker-
nels were endogenously infected with Fusarium spp.
BCS and blood parameters
Herd- and week-specific estimates (least-squares means)
from the linear regression models for BCS, NEFA, BHB,
cholesterol, glucose, fructosamine, insulin, haptoglobin
and GD are shown in Figures 1, 2, 3. The approximated R
2
indicated that the models explained between 37 and 85%
of the total variability. The models of haptoglobin, GD
and glucose had the lowest R
2
and cholesterol had the
highest R
2
.
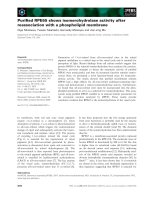
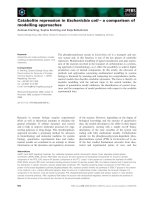
All herds had a mean BCS above 3.5 ap (Fig. 1a). Only
11% of the cows had a BCS of 3 or lower ap, mainly found
in herds B and E. All the cows with a BCS loss of 1.0 or
greater had a BCS of 4 or higher ap except for one cow
each in herds A and E (Table 3). Herds A and C had signif-
icantly higher NEFA values than the other herds ap (p <
0.01) and herd B had a significantly lower peak pp than
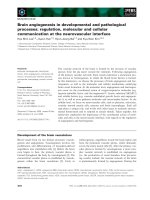
herds A, C and E (p < 0.01, Fig. 1b). Herd A had signifi-
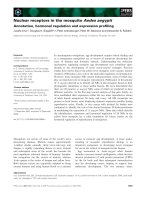
cantly lower insulin levels ap than the other herds (p <
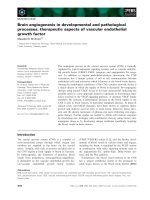
0.01, Fig. 2a) as well as significantly lower cholesterol lev-
els during the first three weeks pp than the other herds (p
< 0.01, Fig. 3a). All individual AST values were below the
suggested reference value, <2.2 μkat/L [25], except 1 ap
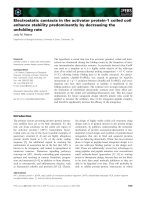
and 6 pp samples. Herd C had significantly higher hap-
toglobin level than herds D and E and herd A significantly
higher level than herd E during the first three weeks pp (p
< 0.05). Number of cows and per cent of cows in herds A-
E outside suggested reference ranges are shown in Table 3.
Discussion
All herds in the present study had generally overcondi-
tioned dry cows. Several studies have shown that overcon-
ditioned dry cows have a greater depression of feed intake
ap and pp and deeper negative energy balance than cows
with a lower body condition [1,2]. In the present study
13% to 38% of the cows in all herds lost over 1.0 unit in
BCS in early lactation, up to six weeks pp (Table 3). High
BCS ap, as well as major losses in body condition have
been associated with abomasal displacement, ketosis and
other metabolism related diseases, decreased fertility and
increased culling rates [2,34,35]. The high BCS ap and loss
of BCS pp in all 5 herds most likely were major contribut-
ing factors to the herd problems with metabolic disorders.
Assessing the metabolic blood profiles may aid in investi-
gating the herd problems by indicating the severity and
timing of disturbed energy metabolism. Thus herds A and
C had higher levels of NEFA ap than the other herds, for
herd C mainly during the last week ap. A majority of the
cows in these herds had NEFA levels ap above the refer-
ence value of 0.4 mmol/L used by Whitaker [11] (Table
3), indicating a mobilisation of adipose tissue already
before calving. Cows in herd A also had lower insulin lev-
els ap than the other herds. It has previously been shown
that the level of insulin is related to nutrient intake in dry
cows [36]. It is thus reasonable to assume that the low
insulin level among cows in herd A reflected a low energy
intake. The dry cow feeding regime in herd A (according
to the questionnaire) using forage with very low energy
content during most of the dry period may have caused
underfeeding, thus explaining the metabolic profiles.
Cows in late pregnancy in herd C may have been underfed
as all dry cows were held in one group irrespective of time
to expected calving. It appears as if the dry cows in herds
B and D were in a more favourable energy balance ap than
the cows in herds A and C. One reason could be that close-
up cows in herds B and D were held in a separate group,
which facilitated the access to feed. Whitaker [11] suggests
a pp reference value for NEFA of <0.7 mmol/L day 10–20
pp. According to this reference value, herds A, C and E all
had more than one third of the cows with elevated levels
of NEFA the first weeks after calving, indicating an exag-
gerated mobilisation of adipose tissue also seen as BCS
losses. In herd D, few cows were sampled during the
period suggested by Whitaker [11] but two more cows had
NEFA values above 0.7 mmol/L on day 21. However,
despite high BCS ap and pronounced losses in BCS, herd
B had normal levels of NEFA pp. Leblanc et al. [14] sug-
gested that elevated NEFA ap increases the risk of aboma-
sal displacement pp.
No significant differences in mean BHB levels were found
among the herds. Oetzel [12] suggested 1.4 mmol/L as a
threshold for subclinical ketosis. Herds A and D had mean
levels around 1.4 mmol/L 5 weeks pp and this may imply
abundance of subclinical ketosis. However BHB does not
only emanate from incomplete oxidation of NEFA in the
liver but also from butyrate of rumen origin oxidised to
BHB in the rumen epithelium [37]. Oetzel [12] suggested
using a proportion of cows in a given timeframe with ele-
vated levels to evaluate subclinical ketosis on herd level.
Thus, over 10% of a minimum of 12 cows sampled days
5–50 pp with BHB values above 1.4 mmol/L has been
used as an indication of subclinical ketosis herd-prob-
Acta Veterinaria Scandinavica 2008, 50:31 />Page 6 of 11
(page number not for citation purposes)
Herd-specific patterns for herd A-E shown as least-squares meansFigure 1
Herd-specific patterns for herd A-E shown as least-squares means. a) body condition score (BCS), b) non-esterified
fatty acids (NEFA) and c) β-hydroxybutyrate (BHB). The BHB peak week 7 in herd D was 2.95 mmol/L.
a)
2
2.5
3
3.5
4
4.5
5
-3 -2 -1 1 2 3 4 5 6 7 8 9
Week
BCS
b)
0
0.1
0.2
0.3
0.4
0.5
0.6
0.7
0.8
0.9
-3 -2 -1 1 2 3 4 5 6 7 8 9
Week
NEFA (mmol/L
)
c)
0.2
0.4
0.6
0.8
1
1.2
1.4
1.6
1.8
-3 -2 -1 1 2 3 4 5 6 7 8 9
Week
BHB (mmol/L
)
A B C D E
Acta Veterinaria Scandinavica 2008, 50:31 />Page 7 of 11
(page number not for citation purposes)
Herd-specific patterns for herd A-E shown as least-squares meansFigure 2
Herd-specific patterns for herd A-E shown as least-squares means. a) insulin, b) glucose and c) fructosamine.
a)
0
5
10
15
20
25
-3 -2 -1 1 2 3 4 5 6 7 8 9
Week
μu/mL
b)
2
2.5
3
3.5
4
4.5
-3 -2 -1 1 2 3 4 5 6 7 8 9
Week
mmol/L
c)
200
210
220
230
240
250
260
270
-3-2-1123456789
Week
μmol/L
a b c d e
Acta Veterinaria Scandinavica 2008, 50:31 />Page 8 of 11
(page number not for citation purposes)
Herd-specific patterns for herd A-E shown as least-squares meansFigure 3
Herd-specific patterns for herd A-E shown as least-squares means. a) cholesterol, b) glutamate dehydrogenase (GD)
and c) haptoglobin.
a)
0
2
4
6
8
10
-3-2-1123456789
Week
Cholesterol (mmol/L)
b)
0
0.1
0.2
0.3
0.4
0.5
0.6
0.7
-3 -2 -1 1 2 3 4 5 6 7 8 9
Week
GD (μkat/L)
c)
0
0.2
0.4
0.6
0.8
1
1.2
1.4
1.6
-3 -2 -1 1 2 3 4 5 6 7 8 9
Week
Haptoglobin (g/L
)
A B C D E
Acta Veterinaria Scandinavica 2008, 50:31 />Page 9 of 11
(page number not for citation purposes)
lems. In our herds, between 9% and 33% of the samples
were above 1.4 mmol/L. However, only herd D had a clear
indication of a herd problem with subclinical ketosis.
Insulin levels ap in herds D and E, and to a lesser extent
also in B and C, were similar to levels found in overfed dry
cows in a study by Holtenius et al. [38]. In that study cows
with high insulin levels ap had a lower glucose clearance
rate pp indicating increased insulin resistance. However,
the usefulness of insulin levels ap as markers for insulin
resistance needs further study. Differences between herds
in NEFA and insulin levels were not reflected in glucose
levels. This indicates that glucose may not be a sensitive
measure of energy status, probably because glucose is sub-
ject to tight homeostatic control as previously concluded
by Herdt [18]. No significant differences between herds
and no changes in level over time were observed in fruc-
tosamine. A weak correlation between blood glucose and
fructosamine but no association between total protein
and fructosamine were found when glucose and total pro-
tein were measured 12–30 days before fructosamine [39].
Fructosamine did not seem to be a sensitive marker for
glucose levels in healthy cows where the variation in glu-
cose is limited.
Herd A had significantly lower mean cholesterol values
than the other herds 1–3 weeks pp. Approximately one
third of the cows in this herd had values below 2.0 mmol/
L. Low cholesterol levels the first weeks after calving (<2
mmol/L) have been associated with fatty liver pp [22-24].
However, much of the variation in cholesterol may be
explained by dry matter intake [21] such that a lower feed
intake leads to lower cholesterol levels. The low choles-
terol values together with the elevated NEFA levels ap sug-
gests that fatty liver was contributing to the metabolic
disorders in herd A. This herd also had the highest fre-
quency of recorded disease during the 12-month period.
Herd D had significantly higher mean values of choles-
terol both 1–3 weeks ap and 1–3 weeks pp. According to
Janovick Guretzky et al. [21], this may be an indication of
a lower degree of adipose tissue mobilisation. However,
herd D had elevated levels of NEFA and BHB pp, as well
as one of the highest reported incidences of disease, thus
indicating a high degree of tissue mobilisation.
Herds A and C had higher haptoglobin levels the first
week pp than herds D and E (Fig. 3c). These herds also
had elevated NEFA levels ap, supporting that elevated
haptoglobin levels pp may be associated with fatty liver as
previously suggested [28]. A peak in haptoglobin the days
after calving are in accordance with several other studies
[[40,41], Nyman AK, Emanuelson U, Holtenius K, Ing-
vartsen KL, Larsen T and Persson Waller K, unpublished
data] and probably due to inflammatory reactions in the
Table 3: Number of cows (and per cent) in herds A-E outside suggested reference ranges out of those sampled within the time frames
Herd
A (%) B (%) C (%) D (%) E (%)
NEFA ≥0.4 mmol/L
a
day 14 to 2 ap
b
11/13
(85)
0/14
(0)
6/11
(55)
0/8
(0)
1/13
(8)
NEFA ≥0.7 mmol/L day 10 to 20 pp
c
7/10
(70)
0/13
(0)
3/6
(50)
1/4
(25)
6/18
(33)
BHB ≥1.4 mmol/L day 5–50 pp
d
7/46
(15)
7/50
(14)
4/38
(11)
7/21
(33)
5/55
(9)
BCS
e
≥3.5 ap 18/18
(100)
18/21
(86)
13/13
(100)
10/11
(91)
13/20
(65)
BCS loss
f
>1 6/16
(38)
6/17
(35)
3/12
(25)
1/8
(13)
5/17
(29)
Cholesterol <2.0 mmol/L
g
day 2–21 pp 7/23
(30)
1/20
(5)
1/13
(8)
0/11
(0)
0/26
(0)
GD >0.25 μkat/L
h
day 2–21 pp 4/23
(17)
3/20
(15)
1/13
(8)
2/11
(18)
2/26
(8)
Haptoglobin >0.5 g/L
i
day 2–21 pp 10/23
(44)
2/20
(10)
5/13
(39)
3/11
(27)
5/26
(19)
non-esterified fatty acids (NEFA), β-hydroxybutyrate (BHB), body condition score (BCS), glutamate dehydrogenase (GD), antepartum (ap),
postpartum (pp)
a
Reference range according to Whitaker [11]
b
Timespan according to Oetzel [12]
c
Reference range and timespan according to Whitaker [11]
d
Reference range and timespan according to Oetzel [12]
e
Edmonson et al. [30]
f
BCS loss defined as difference in BCS 4 weeks to 1 day ap to BCS at 4–6 weeks pp.
g
Holtenius et al. [24] and van den Top et al. [22]
h
Reference according to Clinical Pathology Laboratory, University Animal Hospital, SLU, Uppsala [Personal communication B. Jones]
i
Reference value chosen to allow for increase in haptoglobin associated with calving.
Acta Veterinaria Scandinavica 2008, 50:31 />Page 10 of 11
(page number not for citation purposes)
reproductive tract. Humblet et al. [40] used 0.15 g/L to
separate cows with an acute phase response from healthy
cows in the first week after parturition. In agreement with
another study, we have chosen 0.5 g/L to allow for the
expected haptoglobin increase associated with calving
[41], but still 27% of the cows sampled from day 2–21
had levels of haptoglobin exceeding 0.5 g/L. Even though
the cows in the study were clinically healthy at sampling
and samples collected close to recorded disease were
omitted, it is possible that undetected infectious or
inflammatory processes may have accounted for some of
the haptoglobin responses. More research is needed on
the levels and kinetics of haptoglobin in naturally occur-
ring fatty liver. The elevated GD levels detected in all five
herds (Table 3) indicated liver cell damage, but the herd-
specific profiles did not indicate any consistent relation-
ship between haptoglobin, AST and GD in this study. AST
had a low diagnostic value on herd level in this study.
Hygienic problems with silage detected in herds D and E
and with grain in herds A and B indicated that harvesting
or storage or both were not optimal in these herds. Micro-
bial damage to feedstuffs may reduce nutrient content and
palatability. Although mycotoxins were not analysed in
this study, potentially toxin-producing species were found
in feed from herds A, D and E, which may have contrib-
uted to the elevated GD levels and possibly to disease fre-
quencies. Herd D had an increase in GD during weeks 7
to 9 pp accompanied by concurrent rises in NEFA and
BHB and a decrease in insulin and glucose levels. Herd D
changed to the batch of silage (according to the question-
naire) in which hygiene quality problems were detected
approximately one week before these blood samples were
collected and this may be an explanation for the changes
in the blood profile.
The herds were included in the study based on the refer-
ring veterinarian's opinion and herd records on disease
incidence. In herds B and C, the reported incidence
according to SOMRS of DA and ketosis during the studied
12-month period, was lower than the stated inclusion cri-
teria of 6%. However, all herds had a long-term high inci-
dence of DA and had a reported incidence above the
Swedish average of abomasal displacement (1.0%) and
herds A, B and C had reported incidences above the aver-
age for ketosis (1.3%) [29]. The herds were thus judged to
be high-incidence herds with respect to Swedish condi-
tions at time of inclusion in the study, but not necessarily
in an international perspective.
Establishing reference values for dairy cows in the correct
phase of lactation is a challenge. Due to great variations
between methods, laboratories and cow material, refer-
ence values in literature vary. In order for the present
study to be useful for other than Swedish conditions ref-
erence values need to be well established. This has led us
to use different references for the parameters.
Blood profile results depend on time at sampling in rela-
tion to calving, time of day at sampling and the individual
cows tested. To get a representative metabolic profile at
the herd level, sampling of between 12 and 17 cows is rec-
ommended with cows divided into subgroups ap and pp
[11,12]. A sufficient number of cows to sample in a nar-
row time period around calving may only be available in
large herds, limiting the usefulness of metabolic profiles
in smaller herds. The study herds were sampled when the
farmers had time, at or after the morning milking or in the
early afternoon. This may have added to variations in
blood parameters, but the comparison among herds has
not likely been biased because most of the sampling was
carried out between 10 and 12 am and sampling time was
not systematically different for any of the herds.
We chose to model all blood parameters individually. It
is, however, likely that parameters co-vary because they
are to some extent related to the same biological proc-
esses. It is therefore also possible that a combination of
parameters is more useful than each parameter separately.
A multivariable approach to the statistical modelling may
thus be advantageous and should be addressed in future
research.
Conclusion
In all herds, dry cows were overconditioned and showed
substantial losses in body condition during the first 4–6
weeks pp. NEFA was the parameter that most closely
reflected the BCS losses, supporting earlier findings of its
usefulness in diagnosing herd problems. The BCS losses
were not reflected in glucose and fructosamine levels. One
herd differed in insulin and cholesterol patterns suggest-
ing that these parameters may be potentially useful in
herd profiles, but this needs further investigation.
Increased GD suggested liver cell damage in all herds.
Competing interests
The authors declare that they have no competing interests.
Authors' contributions
The study was designed by all authors and LS did the field
work and collected the data. The statistical analysis was
carried out by LS and UE. All authors contributed to the
interpretation of the data. LS drafted the manuscript and
all authors revised and finally read and approved the pre-
sented manuscript.
Acknowledgements
The study was supported financially by the Swedish Farmers' Foundation
for Agricultural Research. The authors thank Elisabeth Mandorf for carrying
out three of the herd visits and the veterinarians that submitted study
Publish with BioMed Central and every
scientist can read your work free of charge
"BioMed Central will be the most significant development for
disseminating the results of biomedical research in our lifetime."
Sir Paul Nurse, Cancer Research UK
Your research papers will be:
available free of charge to the entire biomedical community
peer reviewed and published immediately upon acceptance
cited in PubMed and archived on PubMed Central
yours — you keep the copyright
Submit your manuscript here:
/>BioMedcentral
Acta Veterinaria Scandinavica 2008, 50:31 />Page 11 of 11
(page number not for citation purposes)
herds. We would especially like to thank participating farmers for interest
and support.
References
1. Hayirli A, Grummer RR, Nordheim EV, Crump PM: Animal and die-
tary factors affecting feed intake during the prefresh transi-
tion period in Holsteins. J Dairy Sci 2002, 85:3430-3443.
2. Rukkwamsuk T, Kruip TA, Wensing T: Relationship between
overfeeding and overconditioning in the dry period and the
problems of high producing dairy cows during the postpartu-
rient period. Vet Q 1999, 21:71-77.
3. Goff JP, Horst RL: Physiological changes at parturition and
their relationship to metabolic disorders 1, 2. J Dairy Sci 1997,
80:1260-1268.
4. Bobe G, Young JW, Beitz DC: Invited review: Pathology, etiol-
ogy, prevention, and treatment of fatty liver in dairy cows. J
Dairy Sci 2004, 87:3105-3124.
5. Ward WR, Murray RD, White AR, Rees EM: The use of blood bio-
chemistry for determining the nutritional status of dairy
cows. In The Annual Nutrition Conference for Feed Manufacturers; Uni-
versity of Nottingham Edited by: Garnsworthy PC, Cole DJA. Notting-
ham University Press; 1995:29-51.
6. Payne JM, Dew AM, Manston R, Faulks M: The use of a metabolic
profile test in dairy herds. Vet Rec 1970, 87:150-158.
7. Kida K: Use of every ten-day criteria for metabolic profile test
after calving and dry off in dairy herds. J Vet Med Sci 2002,
64:1003-1010.
8. Ingraham RH, Kappel LC: Metabolic profile testing. Vet Clin North
Am Food Anim Pract 1988, 4:391-411.
9. Blowey RW: A practical application of metabolic profiles. Vet
Rec 1975, 97:324-27.
10. Mulligan FJ, O'Grady L, Rice DA, Doherty ML: A herd health
approach to dairy cow nutrition and production diseases of
the transition cow. Anim Reprod Sci 2006, 96:331-353.
11. Whitaker DA: Metabolic profiles. In Bovine Medicine: Diseases and
Husbandry of Cattle 2nd edition. Edited by: Andrews AH, Blowey RW,
Boyd H, Eddy RG. Oxford: Blackwell Science; 2004:804-817.
12. Oetzel GR: Monitoring and testing dairy herds for metabolic
disease. Vet Clin North Am Food Anim Pract 2004, 20:651-674.
13. Macrae AI, Whitaker DA, Burrough E, Dowell A, Kelly JM: Use of
metabolic profiles for the assessment of dietary adequacy in
UK dairy herds. Vet Rec 2006, 159:655-661.
14. LeBlanc SJ, Leslie KE, Duffield TF: Metabolic predictors of dis-
placed abomasum in dairy cattle. J Dairy Sci 2005, 88:159-170.
15. Geishauser T, Leslie KE, Duffield TF, Edge V: Evaluation of aspar-
tate transaminase activity and beta-hydroxybutyrate con-
centration in blood as tests for prediction of left displaced
abomasum in dairy cows. Am J Vet Res 1997, 58:1216-1220.
16. Ropstad E: Serum fructosamine levels in dairy cows related to
metabolic status in early lactation. Acta Vet Scand 1987,
28:291-298.
17. Jensen AL, Petersen MB, Houe H: Determination of the fructos-
amine concentration in bovine serum samples. J Vet Med A
Physiol Pathol Clin Med 1993, 40(2):111-117.
18. Herdt TH: Variability characteristics and test selection in
herd-level nutritional and metabolic profile testing. Vet Clin
North Am Food Anim Pract 2000, 16:387-403.
19. Martin GJ, Rand JS: Comparisons of different measurements
for monitoring diabetic cats treated with porcine insulin zinc
suspension. Vet Rec 2007, 161:52-58.
20. Davison LJ, Herrtage ME, Catchpole B: Study of 253 dogs in the
United Kingdom with diabetes mellitus. Vet Rec 2005,
156:467-471.
21. Janovick Guretzky NA, Carlson DB, Garrett JE, Drackley JK: Lipid
metabolite profiles and milk production for Holstein and Jer-
sey cows fed rumen-protected choline during the peripartu-
rient period. J Dairy Sci 2006, 89:188-200.
22. Top AM Van den, Van Tol A, Jansen H, Geelen MJH, Beynen AC:
Fatty liver in dairy cows post partum is associated with
decreased concentration of plasma triacylglycerols and
decreased activity of lipoprotein lipase in adipocytes. J Dairy
Res 2005, 72:129-137.
23. Steen A, Grönstöl H, Torjesen PA: Glucose and insulin responses
to glucagon injection in dairy cows with ketosis and fatty
liver. J Vet Med A Physiol Pathol Clin Med 1997, 44:521-530.
24. Holtenius P, Niskanen R, Holtenius K: Blood lipids and lipopro-
teins in cows with abomasal displacement. In 14 World Buiatrics
Congress; Dublin Edited by: Hartigan PJ, Monaghan ML. Irish Cattle Vet-
erinary Association; 1986:47-51.
25. Kaneko JJ, Harvey JW, Bruss ML: Clinical Biochemistry of Domestic Ani-
mals Fifth edition. London: Academic Press Limited; 1997.
26. Alsemgeest SPM, Kalsbeek HC, Wensing T, Koeman JP, Van Ederen
AM, Gruys E: Concentrations of serum amyloid-A (SAA) and
haptoglobin (HP) as parameters of inflammatory diseases in
cattle. Vet Q 1994, 16:21-23.
27. Yoshino K, Katoh N, Takahashi K, Yuasa A: Purification of a pro-
tein from serum of cattle with hepatic lipidosis and identifi-
cation of the protein as haptoglobin. Am J Vet Res 1992,
53:951-956.
28. Katoh N, Nakagawa H: Detection of haptoglobin in the high-
density lipoprotein and the very high-density lipoprotein
fractions from sera of calves with experimental pneumonia
and cows with naturally occurring fatty liver. J Vet Med Sci
1999, 61:119-124.
29. Swedish Dairy Association: Animal health 2005/2006: Annual report
from the animal health section. Djurhälsovård 2005/2006. Djurhälsa:
Redogörelse för Husdjursorganisationens Djurhälsovård (in Swedish) Eskil-
stuna: Swedish Dairy Association; 2006.
30. Edmonson AJ, Lean IJ, Weaver LD, Farver T, Webster G: A body
condition scoring chart for Holstein dairy cows. J Dairy Sci
1989, 72:68-78.
31. Dohoo IR, Martin W, Stryhn H: Veterinary Epidemiologic Research
Charlottetown: AVC Inc; 2003.
32. Chełkowski J: Cereal grain mycotoxins, fungi and quality in drying and stor-
age. Developments in food science, 26 Amsterdam: Elsevier; 1991.
33. Swedish Board of Agriculture: Directions and general recommendations
concerning feed. SJVFS 2006:81 Saknr M 39. Allmänna råd till 4 kapitlet
6§(in Swedish) Jönköping: Swedish Board of Agriculture; 2006:149.
34. Morrow DA: Fat cow syndrome. J Dairy Sci 1976, 59:1625-1629.
35. Duffield TF: Subclinical ketosis in lactating dairy cattle. Vet Clin
North Am Food Anim Pract 2000, 16:231-253.
36. Odensten MO, Chilliard Y, Holtenius K: Effects of two different
feeding strategies during dry-off on metabolism in high-
yielding dairy cows. J Dairy Sci 2005, 88:2072-2082.
37. Kristensen NB, Gäbel G, Pierzynowski SG, Danfær A: Portal recov-
ery of short-chain fatty acids infused into the temporarily-
isolated and washed reticulo-rumen of sheep. Br J Nutr 2000,
84:477-482.
38. Holtenius K, Agenas S, Delavaud C, Chilliard Y: Effects of feeding
intensity during the dry period. 2. Metabolic and hormonal
responses. J Dairy Sci 2003, 86:883-891.
39. Tråvén M, Stengärde L, Tråvén M, Emanuelson U, Holtenius K, Hult-
gren J, Niskanen R: Evaluation of fructosamine as a tool to
assess glucose levels in dairy cows. In 13th International Confer-
ence on Production Diseases in Farm Animals; Leipzig Edited by: Fürll M.
Merku Druck und Kopier-Zentrum; 2007:168.
40. Humblet MF, Guyot H, Boudry B, Mbayahi F, Hanzen C, Rollin F, Gou-
deau JM: Relationship between haptoglobin, serum amyloid A
and clinical status in a survey of dairy herds during a 6-month
period. Vet Clin Pathol 2006, 35:188-193.
41. Uchida E, Katoh N, Takahashi K: Apperance of haptoglobin in
serum from cows at parturition. J Vet Med Sci 1993, 55:893-894.