Báo cáo khoa học: "Metabolism during anaesthesia and recovery in colic and healthy horses: a microdialysis study" docx
Bạn đang xem bản rút gọn của tài liệu. Xem và tải ngay bản đầy đủ của tài liệu tại đây (370.62 KB, 13 trang )
BioMed Central
Page 1 of 13
(page number not for citation purposes)
Acta Veterinaria Scandinavica
Open Access
Research
Metabolism during anaesthesia and recovery in colic and healthy
horses: a microdialysis study
Anna H Edner*
1
, Birgitta Essén-Gustavsson
1
and Görel C Nyman
2
Address:
1
Department of Clinical Sciences, Faculty of Veterinary Medicine and Animal Science, Swedish University of Agricultural Sciences,
Uppsala, Sweden and
2
Department of Medical Sciences, Clinical Physiology, University hospital, Uppsala, Sweden
Email: Anna H Edner* - ; Birgitta Essén-Gustavsson - ;
Görel C Nyman -
* Corresponding author
Abstract
Background: Muscle metabolism in horses has been studied mainly by analysis of substances in
blood or plasma and muscle biopsy specimens. By using microdialysis, real-time monitoring of the
metabolic events in local tissue with a minimum of trauma is possible. There is limited information
about muscle metabolism in the early recovery period after anaesthesia in horses and especially in
the colic horse. The aims were to evaluate the microdialysis technique as a complement to plasma
analysis and to study the concentration changes in lactate, pyruvate, glucose, glycerol, and urea
during anaesthesia and in the recovery period in colic horses undergoing abdominal surgery and in
healthy horses not subjected to surgery.
Methods: Ten healthy university-owned horses given anaesthesia alone and ten client-owned colic
horses subjected to emergency abdominal surgery were anaesthetised for a mean (range) of 230
min (193–273) and 208 min (145–300) respectively. Venous blood samples were taken before
anaesthesia. Venous blood sampling and microdialysis in the gluteal muscle were performed during
anaesthesia and until 24 h after anaesthesia. Temporal changes and differences between groups
were analysed with an ANOVA for repeated measures followed by Tukey Post Hoc test or Planned
Comparisons.
Results: Lactate, glucose and urea, in both dialysate and plasma, were higher in the colic horses
than in the healthy horses for several hours after recovery to standing. In the colic horses, lactate,
glucose, and urea in dialysate, and lactate in plasma increased during the attempts to stand. The
lactate-to-pyruvate ratio was initially high in sampled colic horses but decreased over time. In the
colic horses, dialysate glycerol concentrations varied considerably whereas in the healthy horses,
dialysate glycerol was elevated during anaesthesia but decreased after standing. In both groups,
lactate concentration was higher in dialysate than in plasma. The correspondence between dialysate
and plasma concentrations of glucose, urea and glycerol varied.
Conclusion: Microdialysis proved to be suitable in the clinical setting for monitoring of the
metabolic events during anaesthesia and recovery. It was possible with this technique to show
greater muscle metabolic alterations in the colic horses compared to the healthy horses in
response to regaining the standing position.
Published: 10 March 2009
Acta Veterinaria Scandinavica 2009, 51:10 doi:10.1186/1751-0147-51-10
Received: 18 July 2008
Accepted: 10 March 2009
This article is available from: />© 2009 Edner et al; licensee BioMed Central Ltd.
This is an Open Access article distributed under the terms of the Creative Commons Attribution License ( />),
which permits unrestricted use, distribution, and reproduction in any medium, provided the original work is properly cited.
Acta Veterinaria Scandinavica 2009, 51:10 />Page 2 of 13
(page number not for citation purposes)
Background
Microdialysis as a means to repeatedly sample and ana-
lyze various substances in the interstitial fluid and in body
cavities has enabled the study of local tissue metabolic
events [1-7]. The great advantage with this technique is
that it allows real-time monitoring of the metabolic
events in local tissue with a minimum of trauma. When
introduced into the tissue, the microdialysis catheter acts
as an artificial blood capillary where the perfusion fluid in
the catheter equilibrates with the concentrations of water-
soluble substances in the extra cellular fluid [8,9]. Com-
monly assessed substances for studying metabolic altera-
tions in tissues are lactate, pyruvate, glycerol, glucose, and
urea.
Lactate and pyruvate play a central role as metabolic
markers in ischaemia research and with increasing fre-
quency these are studied using microdialysis [6,10,11].
Our group has used the microdialysis technique and sam-
pling of muscle biopsies and found that anaesthesia in
healthy horses was associated with an increased produc-
tion of muscle lactate and decreased content of ATP indi-
cating anaerobic metabolism [12,13]. This may be related
to general or local hypoperfusion [14-16].
Increased plasma lactate concentrations are frequently
measured in colic horses subjected to emergency abdom-
inal surgery [17-19]. Muscle biopsy data have shown
increased muscle lactate levels during anaesthesia in colic
horses [20]. However, there is limited information about
muscle metabolism during the early recovery period and
thus the hypothesis was that microdialysis could be a suit-
able technique for studying muscle metabolic events dur-
ing anaesthesia and recovery in healthy and colic horses.
The aims were to evaluate the microdialysis technique as
a complement to plasma analysis and to study the concen-
tration changes in lactate, glucose, glycerol, and urea in
both colic and healthy horses, during anaesthesia and up
to 24 h after standing.
Materials and methods
Study design
The Ethical Committee on Animal Experiments in Upp-
sala, Sweden approved the research protocol. The study
period comprise the time from before anaesthesia until 24
h after recovery to standing.
The material presented below is part of a larger study
investigating metabolic changes in plasma and muscle
biopsy specimens up to seven days after recovery from
anaesthesia, in 20 colic horses subjected to emergency
abdominal surgery as opposed to in 20 healthy horses
subjected to prolonged anaesthesia in dorsal recumbency
[20]. The present study comprise 10 of the colic and 10 of
the healthy horses that, in addition to plasma and muscle
biopsy sampling, were subjected to muscle microdialysis.
Colic horses entered the present study when microdialysis
was performed and where samples were obtained at least
during anaesthesia and in to recovery. The 10 included
healthy horses were those anaesthetised during 2000.
Horses
Colic horses
Ten client-owned colic horses (C) subjected to acute
abdominal surgery at the horse clinic at the Swedish Uni-
versity of Agricultural Sciences, from January to April
2001 and from January to June 2002 were studied. The
horses were referred by field practitioners or smaller
equine clinics because of unresolved acute colic of differ-
ent genesis. On arrival at the university all horses were
examined clinically and treated medically and later surgi-
cally by the veterinarian on duty. The approximate dura-
tion of colic (and withdrawal of food) from observation
of signs until time of surgery in the sampled horses varied
from 6 h up to 2.5 days with a median of 24 h.
Healthy horses
Microdialysate and plasma samples from 10 healthy,
Standardbred, research horses (H), anaesthetised in dor-
sal recumbency for participation in two other anaesthesia
research projects were used for comparison of results.
These horses were owned by the former Department of
Large Animal Clinical Sciences, SLU, Uppsala, Sweden
and were housed at the department where they were out-
doors during the day and stabled at night. They were
fasted for 12 h before anaesthesia.
A summary of details regarding age, sex, breed and weight
of all horses are shown in Table 1.
Anaesthesia
Colic horses
The procedure has been described previously [20] and is
only described briefly below.
In horses in which additional sedation or analgesia before
induction was necessary, this usually consisted of an
alpha-2 agonist and butorphanol. In eight horses, anaes-
thesia was induced with an intravenous (IV) infusion of
7.5% guaifenesin to effect and a bolus dose of 3.1–4.4
mg/kg thiopentone sodium. Diazepam (0.02 mg/kg IV)
and ketamine (2.2 mg/kg IV) or guaifenesin and ketamine
(2.1 mg/kg IV) were used for induction in two horses. The
horses were intubated and anaesthesia was maintained
with isoflurane in oxygen delivered by a semi-closed large
animal anaesthetic circuit with horses in dorsal recum-
bency. In five horses breathing was spontaneous while in
five horses intermittent positive pressure ventilation
(IPPV) was instituted for most or part of the procedure.
Acta Veterinaria Scandinavica 2009, 51:10 />Page 3 of 13
(page number not for citation purposes)
Cardiovascular and respiratory function was monitored
with standard techniques.
Intravenous, isotonic electrolytes were given to all horses.
Hypotension (mean arterial pressure <70 mmHg) was
treated with an IV infusion of a dextran colloid or dob-
utamine (0.5–2 μg/kg/min) or both. After anaesthesia
and abdominal surgery the horses were allowed to recover
in a padded box and supplemented with oxygen insuf-
flated at 15 L/min through the tracheal tube or the nostril.
Treatment in the recovery box was provided as judged
from case to case by the treating veterinarian but xylazine
and flunixin were given to most horses.
Healthy horses
The healthy horses were premedicated with detomidine
(10 μg/kg IV) 10 min before intravenous induction with
7.5% guaifenesin to effect and a bolus dose of thiopen-
tone sodium (4.5 mg/kg IV). Intubation and maintenance
of anaesthesia was as described above. Fluid therapy con-
sisted of isotonic electrolytes at 4 mL/kg/h. In one horse
breathing was spontaneous, four horses were ventilated
with IPPV for the whole procedure, and five horses expe-
rienced both modes of ventilation. After anaesthesia the
horses were allowed to recover in a padded stall as
described above. Six horses were given xylazine (0.15 mg/
kg) and flunixin (1.1 mg/kg) IV after discontinuation of
inhalation anaesthesia. No recovery assistance was given.
Post anaesthesia
Medical treatment during the 24 h-study period after
recovery to standing was provided at the distinction of the
treating veterinarian as judged necessary by the horse's
condition. All surviving colic horses were given IV fluids,
antibiotics (penicillin or gentamicin or both) and flu-
nixin. Other analgesic drugs provided were alpha-2 recep-
tor agonists, dipyrone, pethidine, and butorphanol. An IV
infusion of glucose (2.5%) was given to one horse (C1).
The healthy horses received medical treatment only if
complications developed.
No feed was provided to the colic horses during the study
period. The healthy horses were provided water and hay
(approximately 8 kg/day) and a wet mixture consisting of
beet pulp, wheat and barley bran (0.5–1 kg/day) when
they were alert after recovery from anaesthesia, approxi-
mately after 4 hours.
Samples
Sampling and analyses of dialysate
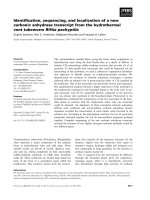
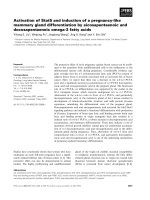
After placing the horse in dorsal recumbency on the sur-
gery table, the horse was slightly tilted to the right and a
commercially available microdialysis catheter (CMA 70
Brain Microdialysis Catheter, CMA/Microdialysis AB,
Solna, Sweden) (Figure 1) was introduced into the left
gluteal muscle through a custom-designed split catheter. A
small, battery-powered infusion pump (CMA 106 Micro-
dialysis pump, CMA/Microdialysis AB, Solna, Sweden)
was secured to the horse's tail with self-adhesive wrap and
protected with plastic. Using this pump a modified Krebs-
Henseleit buffer, with the addition of a colloid (40 g/L
dextran-70), was perfused through the microdialysis cath-
eter at a perfusion rate of 0.3 μL/min. This means that the
concentration of the recovered substance in the dialysate
is very close to the true interstitial concentration of that
substance (a relative recovery of glucose of 90% and that
of lactate approximates 100% in humans) [8,21]. A stabi-
lisation period of 90 min was allowed after insertion of
the catheter before beginning to collect the first sample,
subsequently referred to as dialysate. Samples were col-
lected continuously in 20- to 40-min sequences during
anaesthesia and when possible during recovery. After
recovery to standing, sampling continued in 30- to 60-
min sequences for 2–3 h and thereafter in 1–3-hour
sequences for as long as the catheter was functioning up
to 24 h. Every vial was weighed before and after sampling
Table 1: Summarised data on the 10 colic and 10 healthy horses included in the present study
Colic horses Healthy horses
Number of horses: 10 10
Age:
mean (range)
10 (3–15) years 7 (4–17) years
Sex: 4 mares, 5 geldings,1 stallion 5 mares, 5 geldings
Breed: 1 Shetland pony, 2 Standardbred trotters, 1 Arabian, 6 Warmblooded riding horses 10 Standardbred trotters
Weight:
mean (range)
520 (230–695) kg 503 (428–584) kg
The mean values for age, breed and weight (kg) of the horses are given with the range within the parenthesis.
Acta Veterinaria Scandinavica 2009, 51:10 />Page 4 of 13
(page number not for citation purposes)
to allow estimation of fluid loss or gain. The vials were
kept in protective vials on ice for 10–20 minutes before
being weighed, put into tight plastic bags and frozen at -
20°C until analysis. The dialysate was analysed for its con-
centrations of lactate, glucose, urea, and glycerol with
enzymatic colorimetric methods using a commercially
available sample analyzer (CMA/600, CMA/Microdialysis
AB, Solna, Sweden). In five colic horses pyruvate was ana-
lysed instead of glycerol. Each horse's sequence of samples
was analysed at the same time to decrease the within-
horse variation.
Sampling and analyses of blood samples
Venous blood was sampled in the awake state before
induction; at every hour of anaesthesia; at 15 minutes and
at every hour after discontinuation of inhalation anaes-
thesia whilst still recumbent; at 15 and 30 min, 1, 2, 4, 8,
12, and 24 h after standing. The blood samples were col-
lected from a catheter in the jugular vein. Samples for
assays of plasma lactate, glycerol, glucose, and urea were
taken in heparinised vials. Samples were kept on ice until
they were centrifuged (within 30 minutes) and stored at -
80°C until analysed. Plasma lactate was assayed with a
lactate analyser (Analox GM7, Analox Ltd, London, Great
Britain). Glycerol was determined using a commercial kit
(EnzyPlus, Diffchamb AB, Västra Frölunda, Sweden). Glu-
cose was assayed using modified fluorometric methods
[22]. Urea was determined by a spectrophotometric
method using standardised reagent kits (Konelab 30,
Kone Instruments, Espoo, Finland).
Statistical analysis
Statistical analyses (Statistica 6.0 and 7.0, StatSoft
®
, Inc.
Tulsa OK, USA) of the microdialysate results were per-
formed on the following samples: the last sample
obtained during anaesthesia, the sample obtained during
the horse's successful attempt to reach the standing posi-
tion (sample 0), the samples obtained 1 h and 2 h after
standing, and also the sample representing the mean max-
imum change (increase or decrease) from the end of
anaesthesia was seen. The timepoint for this sample could
be different in individual horses. No statistical analysis
was performed on the temporal changes in dialysate dur-
ing anaesthesia due to the different duration of anaesthe-
sia between horses. Statistical analysis beyond 2 h after
standing was not performed.
Statistical analyses of blood sample results were per-
formed on the sample obtained before anaesthesia, on the
first and last samples taken during anaesthesia, a mean of
the samples taken during recovery from anaesthesia when
still recumbent, 15 minutes and 1 h and 2 h after regain-
ing the standing position.
Temporal changes and differences between groups were
analysed with an ANOVA for repeated measures followed
by Tukey Post Hoc test or Planned Comparisons when the
sphericity assumptions were violated. If the interaction
Group*Time was significant, simple effects were exam-
ined, i.e. effects of one factor holding the other factor
fixed. The p-values were then corrected according to the
Bonferroni procedure. The distribution of dialysate glu-
cose was skewed and was log transformed before formal
analyses. In all analyses, a p-value of <0.05 was consid-
ered significant. Dialysate and plasma results are reported
and shown in the figures as means ± standard error of
means (SEM).
For the statistical analyses, the plasma sample taken at 15
minutes after standing was compared to the dialysate
sample collected when the horse regained the standing
position (0). In the graphs, these two samples are the
point of synchronisation. Since the horses spent different
lengths of time lying down in recovery, the samples before
time 0 may for different horses represent samples
obtained either during anaesthesia or samples obtained
after termination of inhalation anaesthesia when still
recumbent.
Samples from two colic horses (C8 and C14) were not
included in the statistical analyses and are also discussed
An illustration of the microdialysis catheter and infusion pumpFigure 1
An illustration of the microdialysis catheter and infu-
sion pump. The microdialysis catheter consists of a 600-
mm-long inlet tube, a 90-mm-long double-lumen tube, and a
220-mm-long outlet tube to which the microvial is fastened.
The double-lumen tube has a 60-mm-long shaft (0.9 mm in
diameter) and a 30-mm tip (0.6 mm in diameter) where the
outer layer consists of a polyamide dialysis membrane. The
perfusate enters the catheter between the inner tubing and
the outer dialysis membrane, allowing for the process of dial-
ysis, the dialysate is subsequently transported away inside the
inner tube to be collected in the microvial. The illustration
was published with kind permission of CMA/Microdialysis
AB, Solna, Sweden.
Acta Veterinaria Scandinavica 2009, 51:10 />Page 5 of 13
(page number not for citation purposes)
separately since these horses were judged to be in a worse
condition as interpreted from their pre-operative status.
The glucose values from the horse (C1) receiving glucose
were excluded from statistical analysis.
Results
Anaesthesia and outcome
The mean (range) duration of anaesthesia was 208 (145–
300) minutes for the colic horses and 230 (193–273)
minutes for the healthy horses. The mean (range) time
from discontinuation of anaesthesia until the standing
position was regained was 52 (15–105) minutes in the
colic horses and 53 (18–75) minutes in the healthy
horses. Eight colic horses needed one or two attempts to
stand. Two colic horses (C8, C14) never regained the
standing position. The quality of recovery for those horses
that regained the standing position was mostly good, it
was violent in one horse (C13) and another horse (C15)
did some paddling before regaining the standing position.
Both of these horses had signs of slight hind limb dysfunc-
tion for one day. Seven of the ten colic horses survived at
least 24 h after recovery to standing. One horse (C8) died
from cardiovascular collapse and pulmonary oedema 65
min after termination of inhalation anaesthesia without
ever making any attempts to stand or lie in the sternal
position. One mare (C14) was in severe pain and had
spontaneous reflux of gastric contents and metabolic aci-
dosis (BE: -17) in the recovery box. She made one assisted,
but unsuccessful, attempt to stand. This horse was nine
months pregnant and was euthanised 3 h after discontin-
uation of inhalation anaesthesia. The third non-surviving
horse (C19) was euthanised 14 h after standing due to
progressive endotoxemia and bloody diarrhoea. Of the
surviving colic horses four showed mild to moderate gait
disturbances from the hind limbs during the study period.
Clinical signs of myopathy (swollen, sore muscles) were
not detected.
The healthy horses stood after one to four attempts
(median 1.5). One healthy horse (H2) made several vio-
lent attempts to stand but without injuring itself. Two
other horses were distressed during their attempts to stand
and both of these showed symptoms of post-anaesthetic
myopathy post anaesthesia; one had a slightly painful gra-
cilis muscle (H10) and another developed a progressively
worse triceps myopathy (H14). They were treated with
flunixin after recovery. All healthy horses completed the
study.
Dialysate sampling
Dialysate was successfully collected for a mean of 10 h 59
min and 20 h 43 min after recovery to standing in the
healthy and the colic horses respectively. With time the
membrane of the microdialysis catheters broke or the
catheters were pulled out and at 20 h after standing there
are results from five colic horses but from no healthy
horse. Therefore, the mean levels at the end of the graphs
in Figures 2, 3, 4, 5 were calculated from only a few sam-
ples.
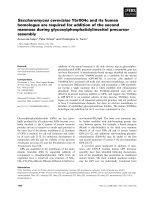
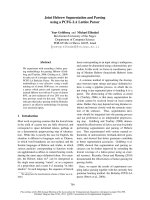
Lactate
The concentration of lactate was always higher in dialysate
than in plasma in both groups (Figure 2a and 2b), but the
concentration difference between dialysate and plasma var-
Lactate concentrations in dialysate and plasma in colic and healthy horsesFigure 2
Lactate concentrations in dialysate and plasma in colic and healthy horses. The mean (± SEM) lactate concentra-
tions in gluteal muscle dialysate and plasma in 8 colic horses (a) and in 10 healthy horses (b) during anaesthesia, in response to
regaining the standing position (time 0) and up to 24 h after standing. Due to loss of the microdialysis catheter the number of
dialysate samples decreases with time. At 10 h after standing there are results from 8 colic and from 5 healthy horses, and at
20 h after standing there are results from five colic horses but from no healthy horse.
Time (h)
Dialysate lactate
Plasma lactate
0
2
10
-4 0 4 8 12 16 20 24
4
6
8
mmol/L
(b) Healthy horses
standing
mmol/L
Dialysate lactate
Plasma lactate
Time (h)
0
10
-4 0 4 8 12 16 20 24
2
4
6
8
standing
(a) Colic horses
Acta Veterinaria Scandinavica 2009, 51:10 />Page 6 of 13
(page number not for citation purposes)
ied greatly between groups, individuals and over time. In the
colic horses the maximum dialysate-to-plasma difference
occurred at time 0 (4.2 ± 1.3 mmol/L) while it occurred at 30
min after standing in the healthy horses (2.1 ± 0.3 mmol/L).
Dialysate lactate concentrations increased in all but one
colic horse in response to the work of regaining the stand-
ing position and was significantly higher at 1 h (p = 0.02)
and 2 h (p = 0.04) after standing compared to the end of
anaesthesia. In the group of healthy horses there was no
significant increase in dialysate lactate after regaining the
standing position. The concentration of lactate in dia-
lysate was significantly higher in the colic horses com-
pared to the healthy horses at 1 h (C: 8.7 ± 1.8 and H: 3.1
± 0.3 mmol/L, p = 0.02) and 2 h (C: 7.0 ± 1.2 and H: 2.8
± 0.3 mmol/L, p = 0.04) after standing.
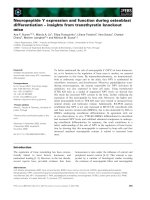
Glucose concentrations in dialysate and plasma in colic and healthy horsesFigure 3
Glucose concentrations in dialysate and plasma in colic and healthy horses. The mean (± SEM) glucose concentra-
tions in gluteal muscle dialysate and plasma in 8 colic (a) and 10 healthy horses (b) during anaesthesia, in response to regaining
the standing position (time 0) and up to 24 h after standing. Due to loss of the microdialysis catheter the number of dialysate
samples decreases with time. At 10 h after standing there are results from 8 colic and from 5 healthy horses, and at 20 h after
standing there are results from five colic horses but from no healthy horse.
Dialysate glucose Plasma glucose
10
0
-4 0 4 8 12 16 20 24
Time (h)
mmol/L
2
4
6
8
(a) Colic horses
standing
Dialysate glucose Plasma glucose
Time (h)
mmol/L
-4 0 4 8 12 16 20 24
0
10
8
6
4
2
(b) Hhealthy horses
standing
Urea concentrations in dialysate and plasma in colic and healthy horsesFigure 4
Urea concentrations in dialysate and plasma in colic and healthy horses. The mean (± SEM) urea concentrations in
gluteal muscle dialysate and plasma in 8 colic horses (a), gluteal muscle dialysate urea concentrations in 10 healthy horses and
plasma urea concentrations in 5 healthy horses (b), during anaesthesia, in response to regaining the standing position (time 0)
and up to 24 h after standing. Due to loss of the microdialysis catheter the number of dialysate samples decreases with time. At
10 h after standing there are results from 8 colic and from 5 healthy horses, and at 20 h after standing there are results from
five colic horses but from no healthy horse.
Time (h)
0
2
4
6
8
mmol/L
-4 0 4 8 12 16 20 24
Dialysate urea Plasma urea
(a) Colic horses
standing
Dialysate urea
Plasma urea
Time (h)
0
2
4
6
8
-4 0 4 8 12 16 20 24
mmol/L
(b) Healthy horses
standing
Acta Veterinaria Scandinavica 2009, 51:10 />Page 7 of 13
(page number not for citation purposes)
The general trends for the plasma lactate concentration
changes were similar in colic and healthy horses but larger
fluctuations were seen in the colic horses and the concen-
trations were higher in this group until 2 hours after
standing. Plasma lactate increased from before anaesthe-
sia to after one hour of anaesthesia in both colic horses (C:
2.2 ± 0.8 mmol/L to 3.4 ± 0.6 mmol/L, p < 0.001) and in
the healthy horses (H: 0.5 ± 0.1 to 1.5 ± 0.1 mmol/L, p <
0.001). In the colic horses, the lactate concentration in
plasma was significantly increased (p = 0.003) at 15 min-
utes after standing (6.2 ± 1.3 mmol/L), compared to the
end of anaesthesia (3.1 ± 0.6 mmol/L) but decreased
thereafter. In the healthy horses plasma lactate was signif-
icantly lower (p = 0.001) at two hours after standing (1.1
± 0.1 mmol/L) compared to the end of anaesthesia (2.0 ±
0.2 mmol/L).
In the two most severely affected colic horses whose
results are not included in the mean values (C8 and C14),
lactate in both dialysate and plasma were above 15 mmol/
L at all times and in C14 lactate in dialysate reached a
maximum concentration of 42 mmol/L. In these horses,
plasma lactate concentrations were 20.7 mmol/L and 15.4
mmol/L before anaesthesia and reached concentrations of
28.5 and 17.8 mmol/L at the end of anaesthesia. In horse
C19, dialysate lactate increased post operatively, from 2.7
to 6.6 mmol/L when its condition deteriorated during the
last hours before euthanasia. The healthy horse (H14)
that developed a triceps myopathy had the highest con-
centrations of both dialysate and plasma lactate during
anaesthesia (6 mmol/L and 4 mmol/L in dialysate and
plasma respectively) and immediately after standing (8.1
mmol/L and 7.2 mmol/L in dialysate and plasma respec-
tively) of all healthy horses. The concentrations decreased
quickly thereafter.
Pyruvate
Pyruvate in the dialysate was analysed in five colic horses,
hence no statistical comparisons were performed on these
data. The temporal changes in pyruvate basically followed
the changes in lactate with an increase after standing, the
maximum levels (0.3–0.5 mmol/L) being reached within
2–4 h after regaining the standing position and then a
gradual decrease towards stable levels around 0.1 mmol/
L.
The dialysate lactate-to-pyruvate ratio
The lactate-to-pyruvate ratio (La/Py ratio) reached its
highest level at the beginning of sampling during anaes-
thesia with ratios varying from 38 to 75 and decreased
thereafter. A short-lasting small increase was seen in asso-
ciation with the work of standing up. By 20 h after stand-
ing, in the three horses where samples still were obtained
the ratio varied from 17 to 25. In the horse that was euth-
anised due to aggravating endotoxemia and diarrhoea 14
h after standing (C19), the La/Py ratio increased by more
than 100% (from 15 to 43) during the last 2 h before
euthanasia.
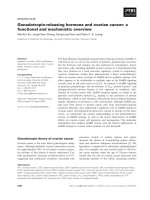
Glycerol concentrations in dialysate and plasma in colic and healthy horsesFigure 5
Glycerol concentrations in dialysate and plasma in colic and healthy horses. The mean (± SEM) glycerol concentra-
tion in plasma in 8 colic horses and in gluteal muscle dialysate in 4 colic horses (a), mean (± SEM) plasma and gluteal muscle dia-
lysate glycerol concentrations in 10 healthy horses (b). The graphs show the changes during anaesthesia, in response to
regaining the standing position (time 0) and up to 24 h after standing. Due to loss of the microdialysis catheter the number of
dialysate samples decreases with time. At 10 h after standing there are results from 5 healthy horses.
Dialysate glycerol Plasma glycerol
0 12 24
Time (h)
0
200
400
600
mmol/L
(a) Colic horses
4 8 16 20-4
mmol/L
0
12 24
Time (h)
0
200
400
600
(b) Healthy horses
Dialysate glycerol Plasma glycerol
-4 4 8 16 20
Acta Veterinaria Scandinavica 2009, 51:10 />Page 8 of 13
(page number not for citation purposes)
Glucose
In the healthy horses the concentration of glucose was
always lower in dialysate compared to that in plasma
whereas in the colic horses the opposite situation was
sometimes present, especially during anaesthesia and
early after standing (Figure 3). In some colic horses the
glucose levels in the dialysate exceeded that in plasma by
5–8 mmol/L.
In the colic horses dialysate glucose was increased during the
first hours after standing compared to during anaesthesia (p
< 0.01), whereas in the healthy horses there was no change
over time. The concentration of dialysate glucose was higher
in the colic horses than in the healthy horses, the difference
being significant at time 0 (C: 10.5 ± 1.3 mmol/L and H: 5.7
± 0.4 mmol/L, p = 0.01) and 1 h after standing (C: 10.4 ± 1.3
mmol/L and H: 5.9 ± 0.4 mmol/L, p = 0.001) and a near sig-
nificant difference at 2 h after standing (C: 10.0 ± 2.8 mmol/
L and H: 5.6 ± 0.4 mmol/L, p = 0.06).
The plasma glucose concentration was significantly higher in
the colic than in the healthy horses during anaesthesia (p =
0.002) but not after standing. Plasma glucose did not change
significantly after standing in either group, but tended to
decrease over the following 12 h in the colic horses.
Urea
The concentration of dialysate urea was significantly
higher in the colic than in the healthy horses until at least
2 h after standing (p = 0.02) (Figure 4). In the colic horses
dialysate urea increased significantly after standing (p =
0.003) at time 0 compared to the last sample during
anaesthesia) and decreased slowly thereafter. The plasma
urea level did not change significantly but the trend over
time was similar to that of dialysate urea. The relationship
between the dialysate and plasma concentrations varied
over time and between individuals in the group of colic
horses. Higher concentrations in the dialysate than in
plasma were sometimes present during anaesthesia and in
the early recovery-to-standing period whereas in the later
samples, similar levels in the dialysate and plasma were
seen. In the healthy horses urea concentrations remained
stable showing no dialysate-to-plasma differences.
Glycerol
In all healthy horses, the glycerol concentrations were
always higher in dialysate than in plasma until immedi-
ately after or within a few hours after regaining the stand-
ing position, individual concentration differences being 2
to 10-fold. Thereafter, in those horses where dialysis con-
tinued to function, glycerol in dialysate was slightly lower
or of similar concentration as in plasma (Figure 5b).
The plasma sample obtained in the healthy horses at 15
min after standing was significantly increased compared
to all other sampling times (p = 0.04).
In the five colic horses in which dialysate glycerol was ana-
lysed, concentrations varied largely between individuals
and over time (Figure 5a) and hence no statistical analysis
was performed. The colic horse that died from pulmonary
oedema and cardiovascular collapse during recovery (C8)
had extremely high values (above 2200 mmol/L) during
anaesthesia and early in recovery, but a decrease was seen
in the last sample before the horse died. In this horse, the
concentration of glycerol in plasma was approximately
50% of that in the dialysate.
Discussion
The results show that with the microdialysis technique it
was possible to study temporal changes in muscle lactate,
glucose, glycerol, pyruvate and urea during anaesthesia
and recovery in healthy and colic horses. Marked differ-
ences in the concentration levels between healthy and
colic horses, as well as time-related changes were detected.
The results from the healthy group of horses were more
homogenous than those from the colic horses where large
inter-individual differences were present reflecting differ-
ent circulatory and metabolic status of the horses.
The microdialysis technique
Microdialysis enabled nearly continuous monitoring of
muscle interstitial concentrations of lactate, glucose, urea,
glycerol and pyruvate in the horses studied. This tech-
nique offers unique opportunities to increase the knowl-
edge about metabolism in the horse during various
situations. It may not only be used in muscle but also in
other tissues or body cavities where a dialysis catheter can
be introduced [9,10,23]. Bed-side analysis may be per-
formed using a commercial analyser (CMA 600, CMA/
Microdialysis AB, Solna, Sweden) from the manufacturer
of the microdialysis catheters.
Some difficulties were encountered in the present study
using microdialysis in the freely moving horse; e.g. some
catheters were accidentally pulled out or damaged when
the horse moved or rubbed against the walls. A possible
reason why the healthy horses lost their catheters at an
earlier stage than the colic horses may be because they
were moving around more in their stall. In the research
setting, the risk of catheter loss would be reduced by
inserting two or more catheters. In anaesthesia research,
assisted recoveries and keeping the horses tied up when
awake would probably also decrease this risk, but pose
other problems instead, such as an increased risk of injury
for the personnel.
An almost complete equilibrium with the true interstitial
concentration is valuable since otherwise, different cali-
bration methods have to be used to calculate this. With
the long dialysis membrane and the low flow-rate used,
the lactate, glycerol and urea concentrations in muscle
dialysate were probably close to that in the interstitial
Acta Veterinaria Scandinavica 2009, 51:10 />Page 9 of 13
(page number not for citation purposes)
space whereas glucose was slightly underestimated [3,8].
Further studies are necessary to find the exact perfusion
rate where a 100% relative recovery of different metabo-
lites is obtained in horses.
Some of the concentration differences that were found
between dialysate and plasma may refer to the different
methods for analysis and possibly to the effect of storage.
However these factors should have affected the sample
concentrations rather constantly over time and between
groups why these factors are likely to have only minor
influence on the results. A recently published study
showed no statistical difference in metabolites when
stored in microvials in -20C for 60 days [24].
Metabolism
Lactate
The two horses with the highest concentrations of lactate
in both dialysate and plasma did not survive. This finding
agrees with earlier studies that found that the concentra-
tion of plasma lactate is a good prognostic indicator for
survival in colic horses [17,19,25]. That lactate in dia-
lysate is a useful parameter to follow in the postoperative
period was also shown by the sudden concentration
increase in dialysate in the colic horse that was euthanised
14 h after standing due to a deteriorating condition.
Traditionally, increased lactate production has been con-
sidered mainly as a marker for tissue ischaemia and anaer-
obic glycolysis but in the last decades, the role of lactate in
different metabolic processes has been re-evaluated [26].
An increased rate of glycolysis due to sympathetic stimu-
lation also results in increased lactate generation despite
the presence of oxygen [11,27-29]. The high concentra-
tions of lactate in plasma and dialysate seen in the colic
horses probably resulted from a combination of acceler-
ated glycolysis and anaerobic metabolism [30-32]. That
anaerobic metabolism was contributing to energy produc-
tion before and during anaesthesia in the colic horses was
shown in a previous study by our group where the content
of ATP in muscle was low and lactate high in several colic
horses [20]. In the more severely ill colic horses, circula-
tion is often compromised due to for example dehydra-
tion, electrolyte disturbances and endotoxemia, leading to
poor peripheral perfusion. At the same time, many colic
horses have an active colic behaviour where they walk and
roll which increases their energy demands. To provide the
muscle cells with energy, anaerobic metabolism must
ensue. The relative contribution of the different causes for
increased lactate production in the colic horses probably
varied from case to case depending on the degree of stress
and circulatory compromise.
Although lactate concentration changes in plasma mostly
followed the changes in dialysate in both groups, the rela-
tionship between changes in dialysate and in plasma was
not constant. In addition, with few exceptions, the plasma
sample result underestimated the level in dialysate. These
results confirm those from an earlier study [13]. This
implies that by obtaining only plasma samples, certain
events occurring in muscle will pass undiscovered [33].
An interesting pattern was seen in dialysate lactate during
anaesthesia in several colic horses where an increase was
followed by a decrease. This decrease could either reflect
lactate being used as a substrate by the muscle cells [34] or
by a slower rate of anaerobic glycolysis.
The greater increases seen in plasma and dialysate lactate
in the colic horses compared to the healthy horses in
response to regaining the standing position, and despite a
visually good recovery, indicate that this period imposes
more stress for the colic than the healthy horses. In most
horses, a recovery requiring greater effort to stand was
associated with greater increases in dialysate lactate, but
not necessarily plasma lactate, compared to that in horses
with a perfect and easy recovery.
Lactate-to-pyruvate ratio
Pyruvate, the precursor of lactate, and the La/Py ratio have
gained increasing interest during the last decades as a
means to distinguish between an increased rate of aerobic
glycolysis, due for example to stress, and anaerobic pro-
duction as the cause of the increased production of lactate
[6,27,28,30,35,36]. If the lactate concentration increases
but the ratio between lactate and pyruvate remains con-
stant, there is no "excess" anaerobic production of lactate.
In this situation the increased generation of lactate may
not solely be the result of anaerobic metabolism but also
a rapidly increased aerobic formation of pyruvate that can
not enter the Krebs cycle [28,30]. Results from the five
colic horses in the present study in which dialysate pyru-
vate was measured indicate that increased glycolysis also
contributed to lactate production. This occurred especially
in the period immediately after recovery to standing and
is shown by increases in lactate in all horses while the La/
Py ratio decreases in three out of the four horses that
regained the standing position. The one of the three sur-
viving horses (C13) that shows a remaining high La/Py
ratio after standing experienced a very violent recovery
(see below) while the other horses had acceptable to good
recoveries with presumably less relative demands on
anaerobic metabolism for the supply of energy.
Glucose
The finding that the plasma glucose concentrations in the
healthy horses were slightly higher or similar to the con-
centrations in dialysate agrees with previous results in
anaesthetised horses [13] and in human microdialysis
studies [8,37]. Puzzling is that in several colic horses the
Acta Veterinaria Scandinavica 2009, 51:10 />Page 10 of 13
(page number not for citation purposes)
glucose concentration was actually higher in dialysate
than in plasma (Figure 3).
Blood flow may influence the concentration of glucose in
dialysate [38-40] but does not explain the large discrep-
ancy between plasma and dialysate concentrations (5–8
mmol/L). Since no healthy horse showed similarly higher
glucose concentrations in dialysate compared to plasma,
this phenomenon must relate to some factor unique for
the systemically ill horses. One possibility for the
increased concentrations of free glucose in the interstitial
fluid may be related to a breakdown of muscle glycogen
because this might result in some free glucose [41,42].
Muscle glycogen is used as a substrate during strenuous
work, especially during short intensive bouts of exercise
[43]. When the horses regain the standing position they
perform similar type of work. Some of the increase
observed in dialysate lactate after recovery to standing
may partly have been due to an increased availability of
glucose [41,44,45]. The increased concentrations in dia-
lysate glucose during and after regaining the standing
position in the colic horses may also depend on an
increased sympathetic outflow and the anti-insulin effect
of catecholamines and cortisol prohibiting transport of
glucose from the interstitium into the cell and delaying
the rate of utilisation of glucose [46].
Urea
The initially higher concentrations of dialysate and
plasma urea in the colic horses compared to the healthy
horses probably reflects decreased renal perfusion and
excretion of urea depending on cardiovascular depression
in the colic horses [18,47,48]. The subsequent decreasing
concentration of urea over time in the colic horses accord-
ingly is probably a result of improved circulation follow-
ing correction of their primary condition.
The transient increase in the dialysate urea level seen in
the colic horses in response to regaining the standing posi-
tion is difficult to explain. An increased recovery of urea
has been referred to indicate an increased tissue blood
flow [49] but since dialysis was performed at a very low
flow rate that was identical in both healthy and colic
horses, this metabolite would at least not be expected to
be markedly higher in dialysate than in plasma as was the
case in several colic horses (Figure 4, Figure 6c) but in no
healthy horse. Changes in the plasma water content could
possibly explain some of the increases in both glucose and
urea in dialysate compared to plasma. However, as shown
in the previous study by Edner et al. [20] the plasma pro-
tein concentration did not change over time during this
period.
Glycerol
High initial concentrations of glycerol in dialysate after
insertion of the catheter are usually considered to indicate
cellular damage after introduction of the catheters
[8,37,50]. A similar equilibration period as in the present
study has been used by others and found to suffice
[8,37,51], however dialysate glycerol had not stabilized in
all horses by that time. Increased dialysate glycerol con-
centrations have also been found in response to increased
intramuscular pressure in a porcine compartment syn-
drome model [35] and also during ischemia in humans
[6,52]. Both of these processes may be present during
anaesthesia in the horse [13,53-56]. Lipolysis of intramus-
cular stores of triglycerides occurs in humans in response
to β-adrenergic stimulation [51] and this may be true also
in the horse. The initially higher concentrations of glyc-
erol in the dialysate compared to plasma in the healthy
horses of the present study may therefore be an effect of
increased intramuscular lipolysis. Results from a previous
study suggest increased sympathetic stimulation during
anaesthesia in healthy horses [13] since the concentration
of plasma glycerol, free fatty acids and cortisol increased
after induction of anaesthesia. Marked intramuscular
lipolysis was probably the cause of the several-fold higher
concentrations in dialysate compared to plasma during
and after anaesthesia in the colic horses.
Case discussion
It is interesting to note that the colic horse (C13; Figure 6)
that had the most violent recovery not only had very high
concentrations of lactate in both dialysate (26 mmol/L)
and plasma (8.9 mmol/L) after recovery to standing, but
that this horse also had a very high concentration of lac-
tate during anaesthesia in dialysate (15 mmol/L), how-
ever, not in plasma (2.5 mmol/L) (Figure 6a). The high
La/Py ratio in this horse during anaesthesia and the first
hours after standing indicates a significant anaerobic com-
ponent during these periods. The results from a previous
study [20] showed that during anaesthesia, this horse also
had the lowest concentrations of serum potassium (2.5
mmol/L), high concentrations of plasma free fatty acids
(above 600 mmol/L), and a muscle content of creatine
phosphate that decreased markedly from the start to the
end of anaesthesia (from 51 to 38 mmol/kg dry weight).
These results together indicate that during anaesthesia this
horse suffered from muscle hypoxia with consumption of
energy sources. It is likely that those derangements in the
muscle affected this horse's capacity to stand up
smoothly.
Interestingly, similarly high interstitial concentrations of
lactate during anaesthesia were seen in the healthy horse
(H14) that also had a rough recovery and later developed
a triceps myopathy. Anaesthesia was unremarkable with a
mean blood pressure above 70 mmHg and an oxygen sat-
uration > 99%. Since this horse also showed the highest
glycerol concentrations in dialysate and plasma of the
healthy horses during anaesthesia and no intramuscular
changes in adenine nucleotides or creatine phosphate
Acta Veterinaria Scandinavica 2009, 51:10 />Page 11 of 13
(page number not for citation purposes)
Example of lactate, glucose, and urea changes in dialysate and plasma in a colic horseFigure 6
Example of lactate, glucose, and urea changes in dialysate and plasma in a colic horse. Concentrations of lactate
(a), glucose (b), and urea (c) in plasma and gluteal muscle dialysate in one colic horse (C13) during anaesthesia, in response to
standing (0) and until 24 h after regaining the standing position. In this horse, as in several other colic horses, higher concentra-
tions of both urea and glucose in dialysate compared to plasma were observed during anaesthesia and in the early recovery
period.
Dialysate Glucose Plasma Glucose
0
10
0 8 16 24
Time (h)
10 12 14 18 20 22-4 -2 2 4 6
5
15
mmol/L
(b) Glucose
standing
Dialysate Urea Plasma Urea
mmol/L
0
10
0 8 16 24
Time (h)
10 12 14 18 20 22-4 -2 2 4 6
6
8
4
2
(c) Urea
standing
Dialysate Lactate Plasma Lactate
10
Time (h)
0
20
0 8 16 2410 12 14 18 20 22-4 -2 2 4 6
mmol/L
(a) Lactate
standing
Acta Veterinaria Scandinavica 2009, 51:10 />Page 12 of 13
(page number not for citation purposes)
[20], this indicates that lipid metabolism was activated
and the increase in lactate probably had other causes than
increased anaerobic metabolism.
General discussion
The healthy horses consisted of a rather homogenous
group of horses that were treated similarly and where the
anaesthetic procedure alone affected muscle metabolism.
In contrast, the group of colic horses was heterogeneous
and metabolism was, in addition to anaesthesia, affected
by different degrees of debilitation and medical treat-
ment, and they also underwent surgery. It is therefore not
always clear what was caused by anaesthesia and what was
caused by the disease or surgery. However, the study aim
was to investigate metabolic changes in colic horses
undergoing anaesthesia compared with that in healthy
horses undergoing anaesthesia.
Since the colic group was heterogeneous and small it is
difficult to make statistical correlations between metabo-
lite levels and different anaesthesia protocols, treatments,
complications, speed of recovery etc. The metabolic state
of the horse when entering anaesthesia largely influenced
its metabolite levels both during anaesthesia and also
early during recovery. A larger, more homogenous study
group would have been preferable but was not possible at
the time of the study. The metabolic parameters presented
in the present study do not differ from the results of the
study by Edner et al [20].
By studying metabolism in colic horses the metabolic
processes will be further understood and will aid in
improving the treatment and care of these horses.
Conclusion
Microdialysis proved to be a valuable technique for the
study of muscle metabolic events in the horse, since
repeated sampling at a peripheral site and with minor
intervention with the horse was possible. The results show
that muscle production of lactate may be substantial espe-
cially in the colic horse and that the extent not always will
be reflected by correspondingly high concentrations in
plasma. The results also indicate that not only anaerobic
lactate production but also other mechanisms such as an
enhanced rate of aerobic glycolysis may contribute to the
alterations seen in lactate concentrations during and after
recovery from anaesthesia in colic horses. The metabolic
response to regaining the standing position after anaes-
thesia was in general more severe in the colic horses than
in the healthy horses. Further metabolic studies using
microdialysis in the horse are encouraged.
Competing interests
The authors declare that they have no competing interests.
Authors' contributions
AE planned and carried out the study, performed most of
the statistics and prepared the manuscript. BEG and GN
participated in the design and carrying out of the study,
interpretation of the results and helped to draft the man-
uscript. All authors read and approved the final manu-
script.
Acknowledgements
The authors are grateful to Kristina Karlström, Robert Kruse for skilful
technical assistance, to veterinary students and technical staff at the equine
clinic at SLU for assistance with sampling and to Elisabeth Berg, Karolinska
Institute, for statistical support.
This study was supported financially by grants from AGRIA Animal Insur-
ance Company, Sweden.
References
1. Ungerstedt U, Hallström A: In vivo microdialysis- a new
approach to the analysis of neurotransmitters in the brain.
Life Sciences 1987, 41:861-864.
2. Ingvast-Larsson C, Appelgren LE, Nyman G: Distribution studies of
theophylline: microdialysis of theophylline in rat and horse.
J Vet Pharmacol Ther 1992, 15(4):386-394.
3. Hagström-Toft E, Enoksson S, Moberg E, Bolinder J, Arner P: Abso-
lute concentrations of glycerol and lactate in human skeletal
muscle, adipose tissue, and blood. Am J Physiol 1997, 273(3 Pt
1):E584-E592.
4. Groth L, Serup J: Cutaneous microdialysis in man: effects of
needle insertion trauma and anaesthesia on skin perfusion,
erythema and skin thickness. Acta Dermato-Venereologica 1998,
78:5-9.
5. Ettinger SN, Poellmann CC, Wisniewski NA, Gaskin AA, Shoemaker
JS, Poulson JM, Dewhirst MW, Klitzman B: Urea as a recovery
marker for quantitative assesment of tumor interstitial sol-
utes with microdialysis. Cancer Res 2001, 61:7964-7970.
6. Ungerstedt J, Nowak G, Ericzon BG, Ungerstedt U: Intraperitoneal
microdialysis (IPM): a new technique for monitoring intesti-
nal ischemia studied in a porcine model. Shock 2003, 20:91-96.
7. Rooyackers O, Thorell A, Nygren J, Ljungqvist O: Microdialysis
methods for measuring human metabolism. Curr Opin Clin Nutr
Metab Care 2004, 7:515-521.
8. Rosdahl H, Hamrin K, Ungerstedt U, Henriksson J: Metabolite lev-
els in human skeletal muscle and adipose tissue studied with
microdialysis at low perfusion flow. Am J Physiol 1998,
274:E936-945.
9. Ungerstedt U: Microdialysis- principles and applications for
studies in animals and man. J Intern Med 1991, 230:365-373.
10. Jansson K, Ungerstedt J, Jonsson T, Redler B, Andersson M, Unger-
stedt U, Norgren L: Human intraperitoneal microdialysis:
increased lactate/pyruvate ratio suggests early visceral
ischaemia. A pilot study. Scand J Gastroenterol 2003,
38:1007-1011.
11. Luchette FA, Jenkins WA, Friend LA, Su C, Fischer JE, James JH:
Hypoxia is not the sole cause of lactate production during
shock. J Trauma
2002, 52:415-419.
12. Edner A, Nyman G, Essén-Gustavsson B: The relationship of mus-
cle perfusion and metabolism with cardiovascular variables
before and after detomidine injection during propofol-keta-
mine anaesthesia in horses. Vet Anaesth Analg 2002, 29:182-199.
13. Edner A, Essén-Gustavsson B, Nyman G: Muscle metabolic
changes associated with long-term inhalation anaesthesia in
the horse analysed by muscle biopsy and microdialysis tech-
niques. J Vet Med A Physiol Pathol Clin Med 2005, 52(2):99-197.
14. Manohar M, Gustafson R, Goetz TE, Nganwa D: Systemic distribu-
tion of blood flow in ponies during 1.45%, 1.96%, and 2.39%
end-tidal isoflurane-O2 anesthesia. Am J Vet Res 1987,
48:1504-1510.
15. Goetz TE, Manohar M, Nganva D, Gustafson R: A study of the
effect of isoflurane anaesthesia on equine skeletal muscle
perfusion. Equine Vet J Suppl 1989:133-137.
Publish with BioMed Central and every
scientist can read your work free of charge
"BioMed Central will be the most significant development for
disseminating the results of biomedical research in our lifetime."
Sir Paul Nurse, Cancer Research UK
Your research papers will be:
available free of charge to the entire biomedical community
peer reviewed and published immediately upon acceptance
cited in PubMed and archived on PubMed Central
yours — you keep the copyright
Submit your manuscript here:
/>BioMedcentral
Acta Veterinaria Scandinavica 2009, 51:10 />Page 13 of 13
(page number not for citation purposes)
16. Serteyn D, Mottart E, Michaux C, Micheels J, Philippart C, Lavergne L,
Guillon C, Lamy M: Laser Doppler flowmetry: Muscular micro-
circulation in anaesthetized horses. Equine Vet J 1986,
18:391-395.
17. Moore JN, Owen RR, Lumsden JH: Clinical evaluation of blood
lactate levels in equine colic. Equine Vet J 1976, 8:49-54.
18. Parry BW, Anderson GA, Gay CC: Prognosis in equine colic: a
study of individual variables used in case assessment. Equine
Vet J 1983, 15:337-344.
19. Ihler CF, Larsen JV, Skjerve E: Evaluation of clinical and labora-
tory variables as prognostic indicators in hospitalised gas-
trointestinal colic horses. Acta Vet Scand 2004, 45:109-118.
20. Edner A, Nyman G, Essén-Gustavsson B: Metabolism before, dur-
ing and after anaesthesia in colic and healthy horses. Acta Vet
Scand 2007, 49:.
21. Rosdahl H, Ungerstedt U, Henriksson J: Microdialysis in human
skeletal muscle and adipose tissue at low flow rates is possi-
ble if dextran-70 is added to prevent loss of perfusion fluid.
Acta Physiol Scand 1997, 159:261-262.
22. Lowry OH, Passonneau JV: A flexible system of enzymatic anal-
ysis. New York: Academic Press; 1973:1-291.
23. Delgado JM, DeFeudis FV, Roth RH, Ryugo DG, Mitruka BM: Dia-
lytrode for long term intracerebral perfusion in awake mon-
keys. Arch Int Pharmacodyn 1972, 198:9-21.
24. Abrahamsson P, Johansson G, Åberg A-M, Haney M, Winsö O: Opti-
mised sample handling in association with use of the CMA
600 analyser. J Pharm Biomed Anal 2008, 48:940-945.
25. Parry BW, Anderson GA, Gay CC: Prognosis in equine colic: a
comparative study of variables used to assess individual
cases. Equine Vet J 1983, 15:211-215.
26. Gladden LB: Lactate metabolism: a new paradigm for the
third millenium. J Physiol 2004, 558:5-30.
27. James JH, Luchette FA, McCarter FD, Fischer JE: Lactate is an unre-
liable indicator of tissue hypoxia in injury or sepsis. Lancet
1999, 354:505-508.
28. Gore DC, Jahoor F, Hibbert JM, DeMaria EJ:
Lactic acidosis during
sepsis is related to increased pyruvate production, not defi-
cits in tissue oxygen availability. Ann Surg 1996, 224:97-102.
29. Wolfe RR, Martini WZ: Changes in intermediary metabolism in
severe surgical illness. World J Surg 2000, 24:639-647.
30. Huckabee WE: Relationships of pyruvate and lactate during
anaerobic metabolism. III. Effect of breathing low-oxygen
gases. J Clin Invest 1958, 37(2):264-271.
31. Larsson J, Hultman E: The effect of long-term, arterial occlusion
on energy metabolism of the human quadriceps muscle.
Scand J Clin Lab Invest 1979, 39:257-264.
32. Harris K, Walker PM, Mickle DA, Harding R, Gatley R, Wilson GJ,
Kuzon B, McKnee N, Romaschin AD: Metabolic response of skel-
etal muscle to ischaemia. Am J Physiol 1986, 250:H213-H220.
33. Müller M, Schmid R, Nieszpaur-Los M, Fassolt A, Lönnroth P, Fasching
P, Eichler HG: Key metabolite kinetics in human skeletal mus-
cle during ischaemia and reperfusion: measurement by
microdialysis. Eur J Clin Invest 1995, 25:601-607.
34. Gladden LB: Muscle as a consumer of lactate. Med Sci Sports
Exrec 2000, 32(4):764-771.
35. Ungerstedt J, Goiny M, Ungerstedt U: Acute compartment syn-
drome in a pig model monitored with microdialysis. In 3rd
Scandinavian Microdialysis User Symposium; Bålsta, Sweden CMA/Micro-
dialysis; 2002.
36. Setälä LP, Korvenoja EM-L, Härmä MA, Alhava EM, Uusaro AV, Ten-
hunen JJ: Glucose, lactate and pyruvate response in an exper-
imental model of microvascular flap ischemia and
reperfusion: a microdialysis study. Microsurgery 2004,
24:223-231.
37. Fuchi T, Rosdahl H, Hickner RC, Ungerstedt U, Henriksson J: Micro-
dialysis of rat skeletal muscle and adipose tissue: dynamics of
the interstitial glucose pool. Acta Physiol Scand 1994,
151:249-260.
38. Rosdahl H, Ungerstedt U, Jorfeldt L, Henriksson J: Interstitial glu-
cose and lactate balance in human skeletal muscle and adi-
pose tissue studied by microdialysis.
J Physiol 1993,
471:637-657.
39. Rosdahl H: Microdialysis sampling from skeletal muscle and
adipose tissue with special reference to the effects of insulin
on tissue blood flow and glucose metabolism. In Doctoral thesis
Karolinska Institutet, the Department of Physiology and Pharmacol-
ogy; 1998.
40. Hickner RC, Rosdahl H, Borg I, Ungerstedt U, Jorfeldt L: The etha-
nol technique of monitoring local blood flow changes in rat
skeletal muscle: implications for microdialysis. Acta Physiol
Scand 1992, 146:87-97.
41. Newsholme EA, Leech AR, Eds: Biochemistry for the medical
sciences. London, UK: John Wiley & Sons Ltd.; 1983.
42. Essén B, Kaijser L: Regulation of glycolysis in intermittent exer-
cise in man. J Physiol 1978, 281:499-511.
43. Gottlieb M: Muscle glycogen depletion patterns during
draught work in Standardbred horses. Equine Vet J 1989,
21:110-115.
44. Kerckhoffs DAJM, Arner P, Bolinder J: Lipolysis and lactate pro-
duction in human skeletal muscle and adipose tissue follow-
ing glucose ingestion. Clin Sci (Lond) 1998, 94:71-77.
45. Del Canale S, Fiaccadori E, Ronda N, Söderlund K, Antonucci C,
Guariglia A: Muscle energy metabolism in uremia. Metabolism
1986, 35:981-983.
46. Lager I: The insulin-antagonistic effect of the counterregula-
tory hormones. J Intern Med Suppl 1991, 735:41-47.
47. Parry BW: Use of clinical pathology in evaluation of horses
with colic. Vet Clin North Am Equine Pract 1987, 3:529-542.
48. Svendsen CK, Hjortkjaer RK, Hesselholt M: Colic in the horse. A
clinical and clinical chemical study of 42 cases. Nord Vet Med
1979, 31:1-31.
49. Lundberg G, Olofsson P, Ungerstedt U, Jansson E, Sundberg CJ: Lac-
tate concentrations in human skeletal muscle biopsy, micro-
dialysate and venous blood during dynamic exercise and
under blood flow restriction. Pflugers Arch 2002,
443(3):458-465.
50. Henriksson J: Microdialysis of skeletal muscle at rest. Proc Nutr
Soc 1999, 58:919-923.
51. Hagström-Toft E, Enoksson S, Moberg E, Bolinder J, Arner P: beta-
Adrenergic regulation of lipolysis and blood flow in human
skeletal muscle in vivo. Am J Physiol 1998, 275(6 pt 1):E909-E916.
52. Östman B, Michaelsson K, Rahme H, Hillered L: Torniquet-induced
ischemia and reperfusion in human skeletal muscle. Clin
Orthop Relat Res 2004:260-265.
53. Lindsay WA, McDonell WN, Bignell W: Equine postanesthetic
forelimb lameness: Intracompartmental muscle pressure
changes and biochemical patterns. Am J Vet Res 1980,
41:1919-1924.
54. Steffey EP, Lindsay WA, Mc Donell WN, Bignell W: Equine pos-
tanesthetic forelimb lameness: Intracompartmental muscle
pressure changes and biochemical patterns. Am J Vet Res 1980,
41:1919-1924.
55. Serteyn D, Mottart E, Deby C, Deby-Dupont G, Pincemail G, Philip-
part C, Lamy M: Equine postanaesthetic myositis: a possible
role for free radical generation and membrane lipoperoxida-
tion. Res Vet Sci 1990, 48:42-46.
56. Serteyn D, Pincemail G, Mottart E, Caudron I, Deby C, Deby-Dupont
G, Philippart C, Lamy M: Approche directe pour la mise en évi-
dence des phénomènes radicalaires lors myopathie pos-
tanesthésique équine: étude peliminaire. Can J Vet Res 1994,
58:309-312.