Báo cáo y học: "Gastric intramucosal pH is stable during titration of positive end-expiratory pressure to improve oxygenation in acute respiratory distress syndrome" pptx
Bạn đang xem bản rút gọn của tài liệu. Xem và tải ngay bản đầy đủ của tài liệu tại đây (70.46 KB, 7 trang )
Available online />Research
Gastric intramucosal pH is stable during titration of positive
end-expiratory pressure to improve oxygenation in acute
respiratory distress syndrome
Ibrahim Ozkan Akinci
1
, Nahit Çakar
2
, Gökhan Mehmet Mutlu
3
, Simru Tugrul
1
,
Perihan Ergin Ozcan
1
, Musa Gitmez
1
, Figen Esen
2
and Lutfi Telci
2
1
Attendings of Anesthesiology and Intensive Care, Department of Anesthesiology and Intensive Care, Istanbul Medical Faculty, Capa Klinikleri, Istanbul,
Turkey
2
Professor of Anesthesiology and Intensive Care, Department of Anesthesiology and Intensive Care, Istanbul Medical Faculty, Capa Klinikleri, Istanbul,
Turkey
3
Assistant Professor of Medicine, Pulmonary and Critical Care Medicine, Evanston Northwestern Healthcare, Evanston, and Northwestern University,
Illinois, USA
Correspondence: I Ozkan Akinci,
R17
ALI = acute lung injury; ARDS = acute respiratory distress syndrome; DO
2
= oxygen delivery; MAP = mean arterial pressure; Pao
2
= partial arterial
oxygen tension; P
(t–a)
CO
2
= gap between partial tissue and arterial carbon dioxide tension; PEEP = positive end-expiratory pressure; pH
i
= gastric
mucosal pH.
Abstract
Background Optimal positive end-expiratory pressure (PEEP) is an important component of adequate
mechanical ventilation in acute lung injury and acute respiratory distress syndrome (ARDS). In the present
study we tested the effect on gastric intramucosal pH of incremental increases in PEEP level (i.e. PEEP
titration) to improve oxygenation in ARDS. Seventeen consecutive patients with ARDS, as defined by
consensus criteria, were included in this clinical, prospective study. All patients were
haemodynamically stable and were not receiving vasopressors. From an initial level of 5 cmH
2
O, PEEP
was titrated at 2 cmH
2
O increments until the partial arterial oxygen tension was 300 mmHg or greater,
peak airway pressure was 45 cmH
2
O or greater, or mean arterial blood pressure decreased by 20% or
more of the baseline value. Optimal PEEP was defined as the level of PEEP that achieved the best
oxygenation. The maximum PEEP was the highest PEEP level reached during titration in each patient.
Results Gastric mucosal pH was measured using gastric tonometry at all levels of PEEP. The
thermodilution technique was used for measurement of cardiac index. Gastric mucosal pH was similar
at baseline and at optimal PEEP levels, but it was slightly reduced at maximum PEEP. Cardiac index
and oxygen delivery remained stable at all PEEP levels.
Conclusion Incremental titration of PEEP based on improvement in oxygenation does not decrease
gastric intramucosal perfusion when cardiac output is preserved in patients with ARDS.
Keywords acute lung injury, acute respiratory distress syndrome, mechanical ventilation, positive end-expiratory
pressure, splanchnic perfusion
Received: 12 February 2003
Revisions requested: 20 February 2003
Revisions received: 24 February 2003
Accepted: 24 February 2003
Published: 12 March 2003
Critical Care 2003, 7:R17-R23 (DOI 10.1186/cc2172)
This article is online at />© 2003 Akinci et al., licensee BioMed Central Ltd
(Print ISSN 1364-8535; Online ISSN 1466-609X). This is an Open
Access article: verbatim copying and redistribution of this article are
permitted in all media for any purpose, provided this notice is
preserved along with the article's original URL.
Open Access
Introduction
Positive end-expiratory pressure (PEEP) is an important com-
ponent of the ventilatory management of acute lung injury
(ALI) and acute respiratory distress syndrome (ARDS). PEEP
improves oxygenation by redistributing the alveolar fluid and
restores functional residual capacity by keeping the alveoli
R18
Critical Care June 2003 Vol 7 No 3 Akinci et al.
open. However, PEEP can be detrimental because it may,
particularly at high levels, decrease cardiac output by
decreasing the venous return as a result of diminished pres-
sure gradient between the systemic veins and right atrium [1],
and consequently it may lead to hypoperfusion of vital organs.
Ultimately, despite improving arterial oxygen content, PEEP
may decrease oxygen delivery to various organs, among
which the splanchnic vascular bed appears to be particularly
at risk because of its predisposing features and the influence
of PEEP on regional blood flow distribution.
Maintenance of splanchnic blood flow is important because
splanchnic hypoperfusion may play a critical role in the patho-
genesis of multiorgan dysfunction syndrome [2,3]. Mechanical
ventilation has been suggested to potentiate the adverse
effects of underlying critical illness on splanchnic vasculature
and contribute to the development of multiorgan dysfunction
syndrome, particularly when ‘injurious’ ventilatory strategies that
produce high end-inspiratory lung volumes are employed [3].
Experimental studies suggested that mechanical ventilation
with considerably high levels of PEEP can lead to splanchnic
hypoperfusion and marked reduction in hepatic blood flow
[4–6]. Furthermore, PEEP may decrease splanchnic blood flow
in patients with no underlying lung disease [7,8]. Most available
evidence regarding the effects of PEEP from animal studies
has been extrapolated to humans based on the assumption
that the effects of mechanical ventilation on humans and
animals are similar. However, a recent study conducted in
humans explored the effect of PEEP in patients with ALI [9]
and did not find a consistent effect on splanchnic blood flow.
Because of the difficulties associated with measurement of
pressure–volume curves, incremental titration of PEEP in an
attempt to find the ‘best’ PEEP, based on improvement in
oxygenation, is common practice in the management of
hypoxaemic respiratory failure. However, it is unknown
whether this strategy has an adverse effect on splanchnic
perfusion. The aim of the present study was to investigate the
impact of PEEP titration (based on improvement in oxygena-
tion) on gastric mucosal perfusion in patients with ARDS, as
assessed by measurement of gastric mucosal pH (pH
i
).
Method
Patients
The study protocol was approved by the Institutional Ethics
Committee of Istanbul University Hospital. Written informed
consent was obtained from each patient or the patient’s next
of kin. We consecutively enrolled 17 patients with ARDS
admitted to the multidisciplinary intensive care unit at Istanbul
University Hospital. The criteria for eligibility were a diagnosis
of ARDS (based on a consensus report [10]), age older than
18 years and mean arterial pressure (MAP) greater than
60 mmHg with no haemodynamic support. All patients were
enrolled within the first 24 hours following the diagnosis of
ARDS. Patients with known cardiac dysfunction or pre-
existing liver disease were not included in the trial.
Protocol
All patients were ventilated using a Servo 300 Siemens ventila-
tor (Siemens Elema, Uppsala, Sweden) using the pressure-reg-
ulated volume control mode with a tidal volume of 8–10 ml/kg
(based on ideal body weight), frequency of 12 breaths/min,
fraction of inspired oxygen of 1.0, and inspiratory : expiratory
ratio of 1 : 2. Patients were sedated with midazolam
(Dormicum; Hoffmann LaRoche, Basel, Switzerland) at
4 mg/hour and paralyzed with 0.1 mg/kg vecuronium (Nor-
curon; Organon, Oss, The Netherlands) infusion during the
study. In addition to employing a radial arterial catheter for
blood pressure measurement, a pulmonary artery catheter
(Abbot Labs, North Chicago, IL, USA) was placed in all patients
for haemodynamic monitoring. No patients received any thera-
peutic intervention to improve haemodynamics (i.e. fluid resus-
citation or catecholamine infusion) throughout the study.
Baseline PEEP (PEEP
baseline
) was set at 5 cmH
2
O and
titrated at 2 cmH
2
O increments until the partial arterial
oxygen tension (Pa
O
2
) reached at least 300 mmHg, peak
airway pressure was 45 cmH
2
O or greater, or MAP dropped
by 20% or more from the baseline value. Criteria for overin-
flation of lung (and therefore for discontinuation of further
titration of PEEP) were reduction in Pa
O
2
of 10% or more
and an increase in arterial carbon dioxide tension of 10% or
more. Optimal PEEP (PEEP
opt
) was defined as the PEEP
that achieved the best oxygenation, whereas maximum PEEP
(PEEP
max
) was the greatest level of PEEP achieved during
titration in each patient.
A nasogastric catheter (TRIP Catheter; Tonometrics Divi-
sion, Instrumentarium Corp., Helsinki, Finland) was inserted
into the stomach to measure pH
i
. Correct placement of the
TRIP catheter was confirmed by radiography. Enteral nutri-
tion was withheld throughout the study, and all patients
received ranitidine 50 mg intravenously. In order to allow for
equilibration, pH
i
was measured 45 min after injection of
2.5 ml isotonic saline into the semipermeable balloon of the
TRIP catheter. Partial pressure of carbon dioxide in saline
solution and bicarbonate level in arterial blood were mea-
sured simultaneously using a blood gas analyzer (ABL-500;
Radiometer, Copenhagen, Denmark) immediately after sam-
pling [11] and were corrected for the equilibration time
[12]. The pH
i
was calculated using the Henderson–Hassel-
bach equation.
All measurements, including respiratory, haemodynamic para-
meters, arterial and mixed venous blood gas analyses, and
gastric pH
i
, were taken at baseline and following ventilation
for 45 min at each level of PEEP. Haemodynamic parameters
were monitored continuously using an Horizon XL monitor
(Mennen Medical Inc., New York, NY, USA). Cardiac output
was measured in triplicate by thermodilution technique using
10 ml saline solution at room temperature. Cardiac index,
shunt fraction, oxygen delivery (D
O
2
) and oxygen consump-
tion were calculated at baseline and at all PEEP levels.
R19
Statistical analysis
Paired analysis of variance tests were used to analyze the dif-
ferences between measurements. P < 0.05 was considered
statistically significant. All values are presented as
mean ± standard deviation.
Results
A total of 17 patients were enrolled in the present study
(11 male and 6 female). The characteristics of the individual
patients are shown in Table 1. The mean age of the study
population was 47.2 ± 19.8, the mean Acute Physiology and
Chronic Health Evaluation II score was 19.7 ± 3.5, and the
mean Sequential Organ Failure Assessment score was
6.3 ± 1.8. By titrating PEEP, we were able to achieve a mean
PEEP
opt
of 10.4 ± 3.9 cmH
2
O and a PEEP
max
of
13.3 ± 2.9 cmH
2
O (P = 0.0001). The highest PEEP value
applied was 17 cmH
2
O. Static compliance improved slightly
at PEEP
opt
, but this did not achieve statistical significance
(P = 0.84; Table 2). Changes in peak airway and mean airway
pressures at PEEP
baseline
, PEEP
opt
and PEEP
max
were statisti-
cally significant (P < 0.001; Table 2). Reasons for stopping
the titration of PEEP were reduction in Pa
O
2
(from 20% to
40%; n=6), reduction in MAP (from 25% to 60%; n = 4),
adequate oxygenation (Pa
O
2
350–450 mmHg; n = 4) and
excessive peak upper airway pressure (n = 3).
Although PEEP significantly improved shunt fraction, and
consequently Pa
O
2
, its greater effect on cardiac output led to
a reduction in D
O
2
both at PEEP
opt
and PEEP
max
. However,
none of the changes in haemodynamic parameters, including
those in central venous pressure, pulmonary artery occlusion
pressure, cardiac output, cardiac index and D
O
2
, achieved
statistical significance (Table 2 and Fig. 1). Pa
O
2
values
remained stable at each level of PEEP. The mean pH
i
was
7.31 ± 0.13 at baseline and 7.32 ± 0.12 at PEEP
opt
; it
decreased to 7.29 ± 0.12 at PEEP
max
, but this reduction was
not statistically significant (P = 0.84). Similar to pH
i
, alter-
ations in the gap between partial tissue and arterial carbon
dioxide tension (P
(t–a)
CO
2
) were not significant (P = 0.353).
Although the increase in PEEP had no impact on the group
as a whole, changes in pH
i
and P
(t–a)
CO
2
during PEEP titra-
tion differed between individual patients (Table 3). The pH
i
decreased in eight patients (47%), it increased in five
(29.4%) and it was unchanged in four (23.5%) at PEEP
opt
as
compared with PEEP
baseline
. The pH
i
at PEEP
max
was lower in
12 (70.6%) and higher in five (29.4%) patients as compared
with baseline values. The P
(t–a)
CO
2
values increased in nine
(52.3%) patients at PEEP
opt
and in 10 (58.3%) patients at
PEEP
max
as compared with PEEP
baseline
(Table 3). However,
there were no statistically significant differences in P
(t–a)
CO
2
Available online />Table 1
Characteristics of the 17 patients studied
Patient number Diagnosis at admission Age (years) Sex APACHE II score SOFA score Additional organ failure
1 Multiple trauma 74 M 15 5 R, N
2 Hepatic coma 26 F 23 10 R, H, N, L
3 Cerebral ischaemia 70 M 22 6 H, N
4 Sepsis 55 M 21 6 H, L
5 Intracranial haemorrhage 58 M 15 7 H, N
6 Acute pancreatitis 50 M 23 9 R, H, L
7 Multiple trauma 24 M 19 6 R, H
8 Pneumonia 18 F 12 5 R
9 Postoperative sepsis 28 F 21 7 R, H, N, L
10 Acute pancreatitis 74 M 23 7 R, H, L
11 Tetanus 62 M 22 4 R, H
12 Pneumonia 62 M 21 3 H
13 Bronchopneumonia 37 F 16 4 R
14 Multiple trauma 40 M 21 5 R, H
15 Postoperative scoliosis 19 F 24 7 R, H, L
16 Aortoduodenal fistula 69 M 17 6 R, H, L
17 Intra-abdominal sepsis 37 F 20 7 R, H, L
APACHE, Acute Physiology and Chronic Health Evaluation; F, female; H, haematological system; L, hepatic system; M, male; N, neurological
system; R, renal system; SOFA, Sequential Organ Failure Assessment.
R20
values between PEEP
baseline
, PEEP
opt
and PEEP
max
(P = 0.353; Table 2). Interestingly, DO
2
in those patients who
exhibited a rise in pH
i
did not increase. Rather, DO
2
in these
patients also decreased (although this was not statistically
significant) at PEEP
opt
and PEEP
max
, to a degree similar to
that in patients who exhibited a drop in pH
i
.
Discussion
The results of the present study indicate that incremental
increases in PEEP do not impact on splanchnic perfusion, as
assessed by gastric tonometry, when cardiac output (and
consequently D
O
2
) is maintained.
In animals, PEEP decreases hepatosplanchnic perfusion in a
dose-dependent manner, with a limited effect at PEEP levels
of less than 10 cmH
2
O [2,4,5]. Alterations in splanchnic
blood flow attributed to PEEP occur in parallel to those in
cardiac output and consequently can be reversed with
restoration of blood pressure [4,13]. Despite experimental
evidence, concerns regarding the effects of PEEP on
splanchnic perfusion remain theoretical because large
studies in humans are lacking. Similarly, in humans without
ALI or ARDS, PEEP reduces splanchnic oxygenation and this
is accompanied by decreases in cardiac output, albeit with
no change in lactate levels [14]. Recently, Kiefer and col-
leagues [9] reported no change in splanchnic perfusion when
PEEP was titrated on the linear portion of the
pressure–volume curve in patients with ALI [9].
Critical Care June 2003 Vol 7 No 3 Akinci et al.
Table 2
Parameters measured during titration of positive end-expiratory pressure
Parameter PEEP
baseline
PEEP
opt
PEEP
max
P value
PEEP (cmH
2
O) 5 10.4 ± 3.9 13.3 ± 2.9 0.0001
P
peak
(cmH
2
O) 27.2 ± 5 31.5 ± 6.2 35 ± 5 0.0001
P
mean
(cmH
2
O) 11.4 ± 1.9 15.9±4.9 19.3 ± 2.8 0.0001
PaO
2
(mmHg) 136.6 ± 48.7 231 ± 86.1 226 ± 99.8 0.001
Pa
CO
2
(mmHg) 38.4± 7.02 37 ± 7.63 37.4±8.19 0.70
pH
i
7.31 ± 0.13 7.32 ± 0.12 7.30±0.12 0.84
P
(t–a)
CO
2
(mmHg) 3.74± 8.31 5.27± 5.49 7.42 ± 7.39 0.353
CI (l/min per m
2
) 4.03±1.47 3.72±1.4 3.62±1.21 0.79
CO (l/min) 7.02±2.46 6.61±2.41 6.5±2.15 0.13
MAP (mmHg) 89 ± 17.7 88.4 ± 15.3 83 ± 15.9 0.49
CVP (mmHg) 13 ± 2.9 12 ± 3.4 11.5 ± 2.8 0.45
PCWP (mmHg) 15 ±3.3 12.7±3.07 12.5 ± 3.1 0.10
D
O
2
(ml/min per m
2
) 689 ± 232.9 659.9 ± 221.7 638.5 ± 197.4 0.14
V
O
2
(ml/min per m
2
) 244.2 ± 73.4 233 ± 42.08 251.2 ± 49.7 0.84
Qs/Qt (%) 34.41 ± 6.23 23.1 ± 9.18 27.4±6.65 0.03
O
2
ext (%) 21.88± 4.65 27.03 ± 3.22 28.51 ± 8.53 0.57
C
st
(ml/cmH
2
O) 32.3 ± 9.7 33 ± 8.35 32.9± 8.5 0.84
CI, cardiac index; CO, cardiac output; C
st
, static compliance; CVP, central venous pressure; DO
2
, oxygen delivery; MAP, mean arterial pressure;
O
2
ext, oxygen extraction ratio; PaO
2
, partial arterial oxygen tension; PCWP, pulmonary capillary wedge pressure; PEEP, positive end-expiratory
pressure; pHi, gastric mucosal pH; P
mean
, mean airway pressure; P
(t–a)
CO
2
, gap between partial tissue and arterial carbon dioxide tension; P
peak
,
peak airway pressure; Qs/Qt, shunt fraction; VO
2
, oxygen consumption.
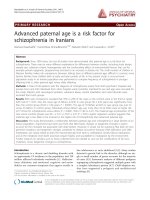
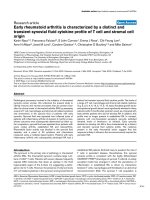
Figure 1
Cardiac output changes at baseline positive end-expiratory pressure
(PEEP
baseline
; 5 cmH
2
O), PEEP
opt
and PEEP
max
.
0.0
2.0
4.0
6.0
8.0
10.0
12.0
14.0
Cardiac output
PEEPmax
5 PEEP PEEPopt
R21
The results presented here, which demonstrate a lack of
impact on splanchnic blood flow when PEEP is not accompa-
nied by decreased cardiac output, corroborate those from
animal studies [4,13] and from the recent human study con-
ducted by Kiefer and coworkers [9]. The lack of change in
pH
i
at PEEP
opt
(11 cmH
2
O) is in agreement with our current
understanding that PEEP at 10 cmH
2
O has a limited effect on
splanchnic blood flow. Furthermore, the presence of ARDS
limited the relative impact of increased thoracic pressure on
the cardiovascular system.
Perhaps more important, these observations were valid for a
wide range of PEEP levels, from 5 cmH
2
O to as high as
17 cmH
2
O. We ascribed the lack of significant changes in
cardiac output and D
O
2
in the patients to adequate volume
status and preload. Relative hypovolaemia appears to be the
most likely explanation for the reductions in cardiac output and
splanchnic blood flow observed in animal studies. Gastric pH
i
,
and consequently splanchnic blood flow, remained stable at
PEEP
opt
and PEEP
max
when cardiac output and DO
2
remained
relatively unchanged. Preservation of splanchnic blood flow at
PEEP
opt
and PEEP
max
was attributed to an increase in oxygen
extraction ratio that was sufficient to compensate for the small,
insignificant drop in cardiac output and D
O
2
that occurred
during PEEP titration [15].
It is also noteworthy that there may be individual variations in
pH
i
in response to PEEP. Although differences in pH
i
response among individuals cannot explained on the basis of
changes in D
O
2
, they may be attributed to differences in the
relative impact of underlying critical illness on splanchnic per-
fusion and variations in splanchnic vascular response (i.e.
severity and/or duration of vasoconstriction, extraction ratio)
to small changes in D
O
2
among individuals.
Because of concerns about the reliability of pH
i
for assessing
mucosal perfusion, we also calculated the P
(t–a)
CO
2
because
it has been proposed to be a better parameter than pH
i
[16].
The pH
i
level can sometimes be misleading, particularly in sit-
uations in which gastric tissue and arterial bicarbonate levels
are not equal. In addition, unlike pH
i
, which can change with
the degree of alveolar ventilation, P
(t–a)
CO
2
remains a reliable
parameter because both components (i.e. partial arterial and
tissue carbon dioxide tension) are similarly influenced by
changes in alveolar ventilation, unless they are associated
with alterations in cardiac output [17]. In the present study,
Available online />Table 3
Levels of positive end-expiratory pressure achieved and corresponding levels of gastric mucosal pH, and partial tissue and arterial
carbon dioxide tension gap
pH
i
P
(t–a)
CO
2
Patient PEEP
opt
PEEP
max
number (cmH
2
O) (cmH
2
O) At PEEP
baseline
At PEEP
opt
At PEEP
max
At PEEP
baseline
At PEEP
opt
At PEEP
max
1 7 9 7.46 7.4 7.4 –1.7 –1 –3.5
2 13 15 7.45 7.43 7.33 –1.7 6.7 17.5
3 17 17 7.26 7.28 7.28 3 –2 –2
4 5 15 7.19 7.19 7.16 10.2 8 13
5 7 11 7.45 7.37 7.32 –3.4 3.4 11
6 15 15 7.23 7.05 7.05 –0.7 11.6 12.6
7 7 15 7.24 7.26 7.23 1.5 0.9 16.1
8 9 13 7.18 7.18 7.24 11.2 14 10.8
9 17 17 7.45 7.44 7.44 –1 10 5
10 15 17 7.15 7.23 7.2 4.6 10.5 13.2
11 11 15 7.45 7.42 7.29 –4.7 5 8.9
12 13 15 7.50 7.43 7.46 –0.3 8 –3.6
13 13 13 7.27 7.46 7.46 –3.5 1 7.3
14 5 9 7.36 7.36 7.27 3.4 3.8 7.4
15 7 9 7.38 7.37 7.37 2.1 13 16
16 5 13 7.14 7.14 7.08 7 –3.8 –2.6
17 9 9 7.15 7.46 7.46 26.6 0.5 –1
Positive end-expiratory pressure (PEEP) at baseline was 5 cmH
2
O. pHi, gastric mucosal pH; P
(t–a)
CO
2
, gap between partial tissue and arterial
carbon dioxide tension.
R22
changes in P
(t–a)
CO
2
were not statistically significant and cor-
related with changes in pH
i
. Consequently, we used pH
i
values in our discussion because we believe that pH
i
reliably
reflects the accurate tissue pH in patients.
Our results corroborate those from the only other study that
evaluated the impact of PEEP on splanchnic perfusion in
patients with ALI. Similar to Kiefer and colleagues [9], we
found no change either in pH
i
or P
(t–a)
CO
2
during PEEP titra-
tion. However, there were several differences between two
studies. Whereas Kiefer and colleagues used pressure–
volume curves for PEEP titration, we titrated PEEP on the
basis of improvement in oxygenation, which is a commonly
used method in clinical practice because determination of
pressure–volume curves can sometimes be cumbersome.
Furthermore, the present study was larger and we included
patients with more severe disease (ratio of fractional inspired
oxygen to Pa
O
2
: 139 in the present study versus 168 in that
conducted by Kiefer and coworkers).
However, the present study has several limitations. The first
and perhaps most important limitation of the study is the
liberal titration of PEEP in order to determine its impact on
pH
i
, as described under Method (see above). We acknowl-
edge that in day-to-day clinical practice, some of the patients
would not have been managed with such aggressive titration
of PEEP and therefore would not have received the levels of
PEEP achieved in the study, rendering the clinical implica-
tions of these observations quite limited. Second, we did not
directly measure splanchnic perfusion but assessed it indi-
rectly by monitoring pH
i
using gastric tonometry. Although the
diagnostic value of gastric tonometry has been questioned
because of some methodological problems, we believe that
we minimized most of these limitations and improved the
reproducibility of our measurements by immediate analysis of
samples, use of H
2
blockers [18] and lack of enteral nutrition
[19], rendering it possible to use gastric pH
i
to evaluate
splanchnic perfusion. Third, PEEP
opt
in the study (approxi-
mately 11 cmH
2
O) was lower than levels reported in other
ARDS studies [20]. Higher tidal volume (10 ml/kg) leading to
higher mean airway pressure, the termination criteria used in
our study, and the differences in titration technique (based on
oxygenation versus pressure–volume curve) may account for
this difference. Finally, pH
i
was measured after patients had
been exposed to different levels of PEEP for a short duration.
Although short-term application of high PEEP did not signifi-
cantly change pH
i
, it is conceivable that longer durations or
higher numbers of patients would have led to more prominent
reductions and statistically significant differences.
Collectively, the present findings indicate that determination
of PEEP
opt
by titration of PEEP based on improvement in oxy-
genation is a safe strategy, with no impairment in gastric
mucosal perfusion, when cardiac output is preserved. Mainte-
nance of cardiac output during mechanical ventilation with
high PEEP may be adequate to prevent its unwanted effects
on organs in the splanchnic vasculature. Nonetheless, the
possibility that PEEP can alter splanchnic perfusion when it is
applied at high levels and for longer durations cannot be
completely excluded.
Competing interests
None declared.
References
1. Guyton AC, Lindsey AW, Abernathy B, Richardson T: Venous
return at various right atrial pressure and the normal venous
return curve. Am J Physiol 1957, 189:609-615.
2. Pastores SM, Katz DP, Kvetan V: Splanchnic ischemia and gut
mucosal injury in sepsis and the multiple organ dysfunction
syndrome. Am J Gastroenterol 1996, 91:1697-1710.
3. Mutlu GM, Mutlu EA, Factor P: GI complications in patients
receiving mechanical ventilation. Chest 2001, 119:1222-1241.
4. Brienza N, Revelly JP, Ayuse T, Robotham JL: Effects of PEEP on
liver arterial and venous blood flows. Am J Respir Crit Care
Med 1995, 152:504-510.
5. Fujita Y: Effects of PEEP on splanchnic hemodynamics and
blood volume. Acta Anaesthesiol Scand 1993, 37:427-431.
6. Arvidsson D, Almquist P, Haglund U: Effects of positive end-
expiratory pressure on splanchnic circulation and function in
experimental peritonitis. Arch Surg 1991, 126:631-636.
7. Winso O, Biber B, Gustavsson B, Holm C, Milsom I, Niemand D:
Portal blood flow in man during graded positive end-expira-
tory pressure ventilation. Intensive Care Med 1986, 12:80-85.
8. Bonnet F, Richard C, Glaser P, Lafay M, Guesde R: Changes in
hepatic flow induced by continuous positive pressure ventila-
tion in critically ill patients. Crit Care Med 1982, 10:703-705.
9. Kiefer P, Nunes S, Kosonen P, Takala J: Effect of positive end-
expiratory pressure on splanchnic perfusion in acute lung
injury. Intensive Care Med 2000, 26:376-383.
10. Bernard GR, Argitas A, Brigham KL, Carlet J, Falke K, Hudson L,
Lamy M, LeGall JR, Morris A, Spragg R, and the Consensus Com-
mittee: The American-European Consensus Conference on
ARDS. Definition, mechanism, relevant outcomes and clinical
trial coordination. Am J Respir Crit Care Med 1994, 149:818-824.
11. Takala J, Parviainen I, Siloaho M, Ruokonen E, Hamalainen E:
Saline PCO
2
is an important source of error in the assess-
ment of gastric intramucosal pH. Crit Care Med 1994, 22:
1877-1879.
12. Fiddian-Green RG: Tonometry: theory and applications. Inten-
sive Care World 1992, 9:60-65.
13. Matuschak GM, Pinsky MR, Roger RM: Effects of positive end-
expiratory pressure on hepatic blood flow and performance. J
Appl Physiol 1987, 62:1377-1383.
14. Berendes E, Lippert G, Loick HM, Brussel T: Effects of positive
end-expiratory pressure ventilation on splanchnic oxygena-
tion in humans. J Cardiothorac Vasc Anesth 1996, 10:598-602.
15. Geiger K, Georgieff M, Lutz H: Side effects of positive pressure
ventilation on hepatic function and splanchnic circulation. Int J
Clin Monit Comput 1986, 3:103-106.
16. Schlichtig R, Mehta N, Gayowski TJ: Tissue-arterial PCO2 dif-
ference is a better marker of ischemia than intramural pH
(pHi) or arterial pH-pHi difference. J Crit Care 1996, 11:51-56.
17. Bernardin G, Lucas P, Hyvernat H, Deloffre P, Mattei M: Influence
of alveolar ventilation changes on calculated gastric intramu-
cosal pH and gastric-arterial PCO2 difference. Intensive Care
Med 1999, 25:249-251.
18. Heard SO, Helsmoortel CM, Kent JC, Shahnarian A, Fink MP:
Gastric tonometry in healthy volunteers: effect of ranitidine on
calculated intramural pH. Crit Care Med 1991, 19:271-274.
Critical Care June 2003 Vol 7 No 3 Akinci et al.
Key message
• Incremental increase in PEEP to identify the optimal
value does not affect splanchnic perfusion as
assessed by gastric tonometry
R23
19. Kolkman JJ, Groenevelt AB, Meuswissen SG: Effect of gastric
feeding on intragastric P(CO
2
) tonometry in healty volunteers.
J Crit Care 1999, 14:34-38.
20. Amato MB, Barbas CS, Medeiros DM, Magaldi RB, Schettino GP,
Lorenzi-Filho G, Kairalla RA, Deheinzelin D, Munoz C, Oliveira R,
Takagaki TY, Carvalho CR: Effect of a protective-ventilation
strategy on mortality in the acute respiratory distress syn-
drome. N Engl J Med 1998, 338:347-354.
Available online />