Báo cáo y học: "Conventional or physicochemical approach in intensive care unit patients with metabolic acidos" ppsx
Bạn đang xem bản rút gọn của tài liệu. Xem và tải ngay bản đầy đủ của tài liệu tại đây (69.09 KB, 5 trang )
Available online />Research
Conventional or physicochemical approach in intensive care unit
patients with metabolic acidosis
Mirjam Moviat
1
, Frank van Haren
2
and Hans van der Hoeven
3
1
Research Fellow, Department of Intensive Care Medicine, University Medical Centre St Radboud, Nijmegen, The Netherlands
2
Consultant, Department of Intensive Care Medicine, Jeroen Bosch Hospital, ‘s-Hertogenbosch, The Netherlands
3
Professor, Department of Intensive Care Medicine, University Medical Centre St Radboud, Nijmegen, The Netherlands
Correspondence: Hans van der Hoeven,
Introduction
Metabolic acidosis is one of the most frequent acid–base dis-
orders occurring in the intensive care unit (ICU) [1]. It may
contribute to the morbidity and mortality associated with
shock, although it may also have some protective effects.
Traditional approaches are often inadequate to explain the
complexity of acid–base derangements in critically ill patients.
The physicochemical approach described by Stewart is
based on two major principles: electroneutrality and conser-
vation of mass [2,3]. According to this theory, there are three
41
AG = anion gap; AG
corr
= anion gap corrected for albumin and lactate; ICU = intensive care unit; PaCO
2
= arterial carbon dioxide tension; pCO
2
=
carbon dioxide tension; SBE = standard base excess; SID
app
= apparent strong ion difference; SID
eff
= effective strong ion difference; SIG =
strong ion gap.
Abstract
Introduction Metabolic acidosis is the most frequent acid–base disorder in the intensive care unit. The
optimal analysis of the underlying mechanisms is unknown.
Aim To compare the conventional approach with the physicochemical approach in quantifying
complicated metabolic acidosis in patients in the intensive care unit
Patients and methods We included 50 consecutive patients with a metabolic acidosis (standard
base excess ≤ –5). We measured sodium, potassium, calcium, magnesium, chloride, lactate,
creatinine, urea, phosphate, albumin, pH, and arterial carbon dioxide and oxygen tensions in every
patient. We then calculated HCO
3
–
, the base excess, the anion gap, the albumin-corrected anion gap,
the apparent strong ion difference, the effective strong ion difference and the strong ion gap.
Results Most patients had multiple underlying mechanisms explaining the metabolic acidosis.
Unmeasured strong anions were present in 98%, hyperchloremia was present in 80% and elevated
lactate levels were present in 62% of patients. Calculation of the anion gap was not useful for the
detection of hyperlactatemia. There was an excellent relation between the strong ion gap and the
albumin-corrected and lactate-corrected anion gap (r
2
= 0.934), with a bias of 1.86 and a precision of
0.96.
Conclusion Multiple underlying mechanisms are present in most intensive care unit patients with a
metabolic acidosis. These mechanisms are reliably determined by measuring the lactate-corrected and
albumin-corrected anion gap. Calculation of the more time-consuming strong ion gap according to
Stewart is therefore unnecessary.
Keywords acid–base disorder, hyperchloremia, metabolic acidosis, strong ion difference, strong ion gap
Received: 24 December 2002
Revisions requested: 18 February 2003
Revisions received: 23 February 2003
Accepted: 31 March 2003
Published: 1 May 2003
Critical Care 2003, 7:R41-R45 (DOI 10.1186/cc2184)
This article is online at />© 2003 Moviat et al., licensee BioMed Central Ltd
(Print ISSN 1364-8535; Online ISSN 1466-609X). This is an Open
Access article: verbatim copying and redistribution of this article are
permitted in all media for any purpose, provided this notice is
preserved along with the article's original URL.
Open Access
R42
Critical Care June 2003 Vol 7 No 3 Moviat et al.
variables that independently determine the hydrogen ion con-
centration. These variables are the strong ion difference, the
total concentration of nonvolatile weak acid (primarily serum
proteins and phosphate), and the carbon dioxide tension
(pCO
2
) [4,5]. Although the Stewart approach may give a
better understanding of the mechanisms that underlie an
acid–base disorder, it is more time consuming than conven-
tional methods and is therefore less convenient in daily prac-
tice [6].
The purpose of the present study was to compare two differ-
ent methods of quantifying metabolic acidosis in patients
admitted to an ICU. We were especially interested in whether
acid–base analysis according to the physicochemical
approach could result in important changes in diagnosis, and
therefore in therapy. We hypothesised that a less time-con-
suming method such as the lactate-corrected and albumin-
corrected anion gap would be as efficient as the calculations
according to the physicochemical approach in identifying the
major causes of metabolic acidosis: hyperchloremia, hyperlac-
tatemia and the presence of other unmeasured strong anions.
Methods
The study was conducted in a single, mixed medical and sur-
gical ICU of the Jeroen Bosch Hospital, ‘s-Hertogenbosch,
The Netherlands from August 2001 until February 2002. The
local medical ethical committee waived informed consent.
We studied 50 consecutive patients who were either admit-
ted with a metabolic acidosis or who developed a metabolic
acidosis during their stay in the ICU. Metabolic acidosis was
defined as a standard base excess (SBE) ≤ –5. In all patients
we measured pH, arterial oxygen tension, arterial carbon
dioxide tension (PaCO
2
), sodium, potassium, chloride, mag-
nesium, calcium, lactate, creatinine, urea, phosphate and
albumin in a single arterial blood sample. Bicarbonate was
calculated using the Henderson–Hasselbach equation
(pH = 6.1 + log ([HCO
3
–
]/0.0301 PaCO
2
) and the SBE using
the Siggaard–Andersen formulae. The urine was screened for
the presence of ketones in every patient.
The anion gap (AG) was calculated with the formula
AG = [Na
+
]+[K
+
] – [Cl
–
] – [HCO
3
–
]. The anion gap corrected
for albumin and lactate (AG
corr
) was calculated with the formula
AG
corr
= AG + 0.25 (40 – [albumin]) – lactate [7]. The apparent
strong ion difference (SID
app
) was calculated using the formula
SID
app
= [Na
+
]+[K
+
] + [Ca
2+
] + [Mg
2+
] – [Cl
–
] – [lactate
–
]. The
effective strong ion difference (SID
eff
) was calculated using
the formula SID
eff
= 12.2 × pCO
2
/ (10
–pH
) + 10 × [albumin] ×
(0.123 × pH – 0.631) + [PO
4
–
] × (0.309 × pH – 0.469). The
strong ion gap (SIG) was calculated by subtracting the effec-
tive strong ion difference from the apparent strong ion differ-
ence: SIG = SID
app
– SID
eff
.
The serum reference range for a normal AG in our laboratory
is 4–12 mmol/l (Aeroset 2002; Abbott, Hoofddorf, the
Netherlands). AG > 12 mmol/l was considered elevated.
SIG > 0 points to the presence of unmeasured strong anions
and was considered abnormal [8]. Fluid resuscitation was
performed with isotonic 0.9% NaCl or short acting starch
products (chloride concentration, 154 mmol/l). Polygeline col-
loidal fluids were not used because they not only increase
serum chloride levels, but probably also increase the SIG [9].
Acute Physiology and Chronic Health Evaluation II data were
collected for each patient for the first 24 hours after admis-
sion. A decrease in renal function was defined as a creatinine
concentration > 110 µmol/l for males and > 100 µmol/l for
females. All patients were followed up to determine the
28-day survival.
Results are reported as the mean ± standard deviation or the
median (25th percentile, 75th percentile) depending on the
distribution of the data. We performed linear regression
analysis to compare the SIG with the AG
corr
. We calculated
the bias (the mean difference between the two methods)
after subtracting 12 from the AG
corr
and the precision (the
standard deviation of the bias). The limits of agreement were
defined by ± 2 standard deviations [10].
Results
Fifty patients were enrolled in the study. Patient characteris-
tics are presented in Table 1, and acid–base and electrolyte
data for the study population are presented in Table 2.
Twenty-nine patients had evidence of a decreased renal func-
tion. Urine samples were positive for ketones in six patients.
Hyperchloremia (serum chloride ≥ 110 mmol/l) was present in
40 patients (80%), and hyperlactatemia (serum lactate
≥ 2 mmol/l) was present in 31 patients (62%). The contribu-
tions of the three main causes of metabolic acidosis (hyper-
chloremia, hyperlactatemia and increased levels of other
unmeasured strong anions) are presented in Table 3. Of the
29 patients with renal failure, 14 had elevated lactate levels,
20 had hyperchloremia and all 29 had an elevated SIG.
Calculation of the uncorrected AG was not useful for the
detection of hyperlactatemia: sensitivity, 45%; specificity,
16%; positive predictive value, 47%; negative predictive value,
15%. Calculation of the albumin AG
corr
increased the sensitiv-
ity to 100%, but the specificity decreased to 11%. The posi-
tive and negative predictive values were 65% and 100%,
respectively. The mean SID
app
was 27.8 ± 4.3 mEq/l (normal,
38–42 mEq/l). In all but one patient the SIG was increased
(median, 3.61 mEq [1.99, 6.07]). There was a weak but signifi-
cant correlation between the lactate levels and the SIG
(r
2
= 0.149, P = 0.005). There was a very strong correlation
between the AG
corr
and the SIG (r
2
= 0.934, P < 0.001; Fig. 1).
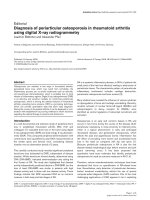
The bias was 1.86 and the precision was 0.96. The limits of
agreement were therefore –0.06 and 3.78 (Fig. 2)
Discussion
The main finding of the present study was the excellent rela-
tionship between the AG
corr
and the SIG in patients with a
R43
metabolic acidosis admitted to the ICU (r
2
= 0.934). Further-
more, unmeasured strong anions excluding lactate were
almost universally present in this unselected patient group, as
was hyperchloremia.
A positive SIG indicating the presence of unmeasured strong
anions was reliably detected by the AG
corr
. Durward and col-
leagues studied 540 children, of whom 240 developed a
metabolic acidosis [6]. In their study, unmeasured strong
anions were also the main component of tissue acids. In
accordance with the present study, the AG
corr
had the best
discriminatory ability (area under curve, 0.95) and the tightest
determination coefficient for the detection of tissue acids
(r
2
= 0.86). Durward and colleagues also found a weak but
significant inverse correlation between the total amount of
tissue acids and the chloride:sodium ratio. A chloride:sodium
ratio > 0.79 was able to exclude a raised tissue acid level
with a positive predictive value of 81% and a likelihood ratio
of 4.5. The upper normal range for the chloride:sodium ratio
in our hospital is 0.79. Thirty-eight (76%) patients had a chlo-
Available online />Table 1
Patient characteristics
Age (years) 65 (26–89)
Sex (male/female) 26/24
Acute Physiology and Chronic Health Evaluation II 22 (9–43)
Mechanical ventilation (%) 92
Standardised mortality ratio 0.90
Hospital mortality (%) 38
Diagnosis
Septic shock 22
Hypovolemic shock 15
Cardiogenic shock 9
Other 4
Table 2
Acid–base and electrolyte data
pH 7.295 (7.213, 7.33)
Arterial carbon dioxide tension (mmHg) 36.5 (29.25, 42)
Standard base excess –8.5 (–11, –7)
Sodium (mmol/l) 138 (135, 141)
Potassium (mmol/l) 4 (3.52, 4.37)
Chloride (mmol/l) 114 (110, 117)
Lactate (mmol/l) 2.25 (1.42, 3.07)
Albumin (g/l) 16 (13, 19)
Strong ion gap (mEq/l) 3.61 (1.99, 6.07)
Data presented as median (interquartile range).
Table 3
Distribution of the three main underlying mechanisms of
metabolic acidosis
Underlying mechanism Number of patients (%)
Increased strong ion gap 49 (98)
Increased lactate 31 (62)
Increased chloride 40 (80)
Increased strong ion gap + lactate 31 (62)
Increased strong ion gap + chloride 39 (78)
Increased lactate + chloride 25 (50)
Increased strong ion gap + lactate + chloride 25 (50)
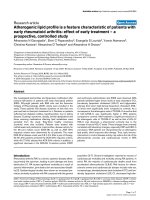
Figure 1
Correlation between the albumin-corrected anion gap (AG) minus
lactate and the strong ion gap (SIG).
y = 0.8494x + 2.1877
R
2
= 0.9344
–2
0
2
4
6
8
10
12
14
16
–5 0 5 10 15
Corrected AG – 12 (mEq/l)
SIG (mEq/l)
Figure 2
Bland–Altman analysis of the albumin-corrected anion gap minus
lactate (AG
corr
) and the strong ion gap (SIG) (bias, 1.81 and precision,
0.96).
–2
–1
0
1
2
3
4
5
–4 0 4 8 12 16
((AG
corr
-[lactate] – 12) + SIG) / 2 (mEq/l)
SIG – (Ag
corr
-[lactate] – 12) (mEq/l)
R44
ride:sodium ratio > 0.79 in our study. This is in agreement
with our definition of hyperchloremia using an absolute level
of 110 mmol/l (80% hyperchloremia). We also found a signifi-
cant negative correlation between the amount of unmeasured
strong anions and the chloride:sodium ratio (r
2
= 0.54,
P < 0.001).
The unmeasured strong anions involved in the SIG remain
largely unidentified. These anions appear, for example, in the
circulation during sepsis and liver failure, and may be a variety
of organic and inorganic compounds [8]. The use of urea-
linked polygelines, for example, as the priming fluid for the
extracorporeal circuit during cardiac surgery has also been
shown to increase the SIG [9]. They represent approximately
5.6 mEq anions per 500 ml fluid. Also, the (over)use of several
medications such as salicylates and penicillin can be a cause
of a positive SIG. The importance of a raised SIG in clinical
practice, however, is unknown. Cusack and colleagues
recently showed that the pH and SBE were better outcome
predictors than the SIG in a group of mixed medical and sur-
gical ICU patients [11]. Furthermore, normal levels for the
SIG in critically ill patients are unknown. We defined SIG > 0
as abnormal but these data were based on measurements in
healthy volunteers [8]. Cusack and colleagues found a much
higher SIG in critically ill patients but they provide no sepa-
rate data for the patients with a normal SBE. If we assume
that normal AG ≤ 12 mEq/l, the intercept in Figure 1 suggests
that the normal SIG in our critically ill patients is close to
2 mEq/l.
A significant part of the acidosis in the present patients is
probably related to the resuscitation with isotonic saline and
starch products. This can be deduced from the frequent
occurrence of hyperchloremia in our patients in relation to the
plasma sodium concentration. Both have a chloride concen-
tration of 154 mmol/l. This results in a reduction of the strong
ion difference, which in turn produces an increase in the
number of hydrogen ions to preserve electrical neutrality. The
term ‘dilutional acidosis’ used in relation to high volume
resuscitation should therefore be abandoned. Hyper-
chloremic acidosis after fluid resuscitation is a well-known
phenomenon in the ICU [12–14]. The clinical consequences,
however, are unknown.
There is no proof to date that the use of a more balanced
resuscitation fluid will result in a better patient outcome.
Kellum showed that a balanced resuscitation fluid (Hextend
®
,
Abbott, Chicago, IL, USA); chloride concentration,
124 mmol/l) resulted in a better short-term survival in a rat
sepsis model compared with isotonic saline [15]. Waters and
colleagues compared isotonic saline with lactated Ringer’s
solution in patients undergoing abdominal aortic aneurysm
repair [16]. Patients in the normal saline group developed a
more severe acidosis and received a larger volume of platelet
transfusion. However, there were no differences in the dura-
tion of mechanical ventilation, the ICU stay, the hospital stay
and the incidence of complications. Furthermore, the use of
Ringer’s lactate has been associated with postoperative
hypercapnic acidosis and hyponatremia [17]. Therefore, the
importance of resuscitation-induced hyperchloremic acidosis
remains to be determined.
Hyperlactatemia was the third cause of metabolic acidosis in
the present study. Considering the high number of patients
with sepsis, this is not surprising. The importance of hyperlac-
tatemia as a marker of shock and its prognostic significance
are well known. We demonstrated that a normal AG does not
exclude the presence of hyperlactatemia (sensitivity, 45%;
negative predictive value, 15%). Although the sensitivity of
the AG
corr
for the detection of hyperlactatemia increased to
100%, it was not specific (11%). Therefore, determination of
the (corrected) AG is not a good substitute for the direct
measurement of lactate in patients with a metabolic acidosis
in the ICU. As expected, there was a weak but significant cor-
relation between lactate levels and the SIG. This weak corre-
lation was especially pronounced in patients with normal or
slightly elevated lactate levels.
Several weaknesses of the present study should be men-
tioned. We only studied patients with a clear metabolic acido-
sis (SBE ≤ –5), and the SIG and lactate levels of patients with
a normal or marginally normal SBE are therefore unknown.
Furthermore, although the patients were included immediately
when the SBE became ≤ –5, changes over time may have
influence over the type of acidosis detected.
In conclusion, the present study demonstrates that multiple
underlying mechanisms are present in most ICU patients with
a metabolic acidosis. These mechanisms are reliably deter-
mined by measuring the lactate-corrected and albumin-
corrected anion gap. Calculation of the more time-consuming
strong ion gap according to Stewart, although a gold stan-
dard, is therefore unnecessary for clinical purposes. Further
studies should focus on the nature and importance of the
unmeasured strong anions that are almost universally present
in these patients.
Competing interests
None declared.
Critical Care June 2003 Vol 7 No 3 Moviat et al.
Key messages
• Metabolic acidosis in intensive care unit patients is
usually explained by multiple underlying mechanisms
• Underlying mechanisms of metabolic acidosis are reli-
ably determined by measuring the lactate-corrected
and albumin-corrected anion gap. Calculation of the
more time-consuming strong ion gap according to
Stewart is therefore unnecessary
R45
References
1. Gauthier PM, Szerlip HM: Metabolic acidosis in the intensive
care unit. Crit Care Clin 2002, 18:289-308.
2. Stewart PA: Modern quantitative acid–base chemistry. Can J
Physiol Pharmacol 1983, 61:1441-1461.
3. Kellum JA: Determinants of blood pH in health and disease.
Crit Care 2000, 4:6-14.
4. Wilkes P: Hypoproteinemia, strong-ion difference, and
acid–base status in critically ill patients. J Appl Physiol 1998,
84:1740-1748.
5. Figge J, Rossing TH, Fencl V: The role of serum proteins in
acid–base equilibrium. J Lab Clin Med 1991, 117:453-467.
6. Durward A, Skellett S, Mayer A, Taylor D, Tibby SM, Murdoch IA:
The value of the chloride:sodium ratio in differentiating the
aetiology of metabolic acidosis. Intensive Care Med 2001,
27:828-835.
7. Figge J, Jabor A, Kazda A, Fencl V: Anion gap and hypoalbu-
minemia. Crit Care Med 1998, 26:1807-1810.
8. Kellum JA: Strong ion gap: a methodology for exploring unex-
plained anions. J Crit Care 1995, 10:51-55.
9. Hayhoe M, Bellomo R, Liu G, McNicol L, Buxton B: The aetiology
and pathogenesis of cardiopulmonary bypass-associated
metabolic acidosis using polygeline pump prime. Intensive
Care Med 1999, 25:680-685.
10. Bland JM, Altman DG: Statistical methods for assessing agree-
ment between two methods of clinical measurement. Lancet
1986, i:307-310.
11. Cusack RJ, Rhodes A, Lochhead P, Jordan B, Perry S, Ball JAS,
Grounds RM, Bennett ED: The strong ion gap does not have
prognostic value in critically ill patients in a mixed
medical/surgical adult ICU. Intensive Care Med 2002, 28:864-
869.
12. Prough DS, Terry White R: Acidosis associated with peri-oper-
ative saline administration. Dilution or delusion? Anesthesiol-
ogy 2000, 93:1167-1169.
13. Liskaser FJ, Bellomo R, Hayhoe M, Story D, Poustie S, Smith B,
Letis A, Bennet M: Role of pump prime in the aetiology and
pathogenesis of cardiopulmonary bypass-associated acido-
sis. Anesthesiology 2000, 93:1170-1173.
14. Rehm M, Orth V, Scheingraber S, Kreimeier U, Brechtelsbauer H,
Finsterer U: Acid–base changes caused by 5% albumin versus
6% hydroxyethyl starch solution in patients undergoing acute
normovolemic hemodilution. Anesthesiology 2000, 93:1174-
1183.
15. Kellum JA: Fluid resuscitation and hyperchloremic acidosis in
experimental sepsis: improved short-term survival and
acid–base balance with Hextend compared with saline. Crit
Care Med 2002, 30:300-305.
16. Waters JH, Gotlieb A, Schoenwald P, Popovich MJ, Sprung J,
Nelson DR: Normal saline versus lactated Ringer’s solution for
intra-operative fluid management in patients undergoing
abdominal aortic aneurysm repair: an outcome study. Anesth
Analg 2001, 93:817-822.
17. Takil A, Eit Z, Irmak P, Yilmaz GF: Early postoperative respira-
tory acidosis after large intravascular infusion of lactated
ringer’s solution during major spine surgery. Anesth Analg
2002, 95:294-298.
Available online />