Báo cáo khoa học: "Hyperglycaemic index as a tool to assess glucose control: a retrospective study" docx
Bạn đang xem bản rút gọn của tài liệu. Xem và tải ngay bản đầy đủ của tài liệu tại đây (190 KB, 6 trang )
R122
Critical Care June 2004 Vol 8 No 3 Vogelzang et al.
Research
Hyperglycaemic index as a tool to assess glucose control: a
retrospective study
Mathijs Vogelzang
1
, Iwan CC van der Horst
2
and Maarten WN Nijsten
3
1
Department of Surgery, Groningen University Hospital, Groningen, The Netherlands
2
Department of Internal Medicine, Groningen University Hospital, Groningen, The Netherlands
3
Department of Surgery, Groningen University Hospital, Groningen, The Netherlands
Corresponding author: Maarten WN Nijsten,
Introduction
Acute hyperglycaemia is a prognostic factor for mortality in
critically ill patients either in the presence or in the absence of
diabetes mellitus [1–3]. The benefit of strict glucose control
in the intensive care unit (ICU) was demonstrated by the Leuven
study [4,5]. Remarkable reduction in morbidity and mortality
was achieved in patients who were treated according to a
protocol that aimed to achieve normoglycaemia. Thus, the
logical aims of glucose control are to eliminate hyper-
glycaemia as rapidly as possible and to maintain normo-
glycaemia from then onward, while avoiding hypoglycaemia
[6,7]. Although this represents a clear goal for algorithms,
APACHE = Acute Physiology and Chronic Health Evaluation; HGI = hyperglycaemic index; ICU = intensive care unit; IQR = interquartile range;
ROC = receiver operator characteristic.
Abstract
Introduction Critically ill patients may benefit from strict glucose control. An objective measure of
hyperglycaemia for assessing glucose control in acutely ill patients should reflect the magnitude and
duration of hyperglycaemia, should be independent of the number of measurements, and should not be
falsely lowered by hypoglycaemic values. The time average of glucose values above the normal range
meets these requirements.
Methods A retrospective, single-centre study was performed in a 12-bed surgical intensive care unit.
From 1990 through 2001 all patients over 15 years, staying at least 4 days, were included. Admission
type, sex, age, Acute Physiology and Chronic Health Evaluation II score and outcome were recorded.
The hyperglycaemic index (HGI) was defined as the area under the curve above the upper limit of
normal (glucose level 6.0 mmol/l) divided by the total length of stay. HGI, admission glucose, mean
morning glucose, mean glucose and maximal glucose were calculated for each patient. The relations
between these measures and 30-day mortality were determined.
Results In 1779 patients with a median stay in the intensive care unit of 10 days, the 30-day mortality
was 17%. A total of 65,528 glucose values were analyzed. Median HGI was 0.9 mmol/l (interquartile
range 0.3–2.1 mmol/l) in survivors versus 1.8 mmol/l (interquartile range 0.7–3.4 mmol/l) in nonsurvivors
(P < 0.001). The area under the receiver operator characteristic curve was 0.64 for HGI, as compared
with 0.61 and 0.62 for mean morning glucose and mean glucose. HGI was the only significant glucose
measure in binary logistic regression.
Conclusion HGI exhibited a better relation with outcome than other glucose indices. HGI is a useful
measure of glucose control in critically ill patients.
Keywords critically ill patients, hyperglycaemia, normoglycaemia, outcome, prognosis
Received: 30 November 2003
Revisions requested: 22 January 2004
Revisions received: 16 February 2004
Accepted: 25 February 2004
Published: 15 March 2004
Critical Care 2004, 8:R122-R127 (DOI 10.1186/cc2840)
This article is online at />© 2004 Vogelzang et al., licensee BioMed Central Ltd. This is an
Open Access article: verbatim copying and redistribution of this article
are permitted in all media for any purpose, provided this notice is
preserved along with the article's original URL.
Open Access
R123
Available online />there is no clear way to assess the performance of such
algorithms [8].
In ICU patients we do not possess a measure such as
glycosylated haemoglobin A
1c
, which has proven to be an
important predictor of long-term complications and to be
useful for evaluating the quality of glucose control [9–11].
Therefore, glucose itself must be measured during the ICU
stay in order to determine whether hyperglycaemia is present.
In studies of acutely ill patients, regular indices of glucose
regulation that have been used are admission glucose,
maximum glucose, mean morning glucose and mean glucose
[5,12–15]. All of these indices have specific drawbacks.
Admission glucose, maximum glucose and mean morning
glucose are all based on either a single measurement or a
subset of measurements, and therefore they are not indicative
of overall hyperglycaemia. A single mean glucose that uses all
measurements can be strongly biased by unequal time
distribution between measurements, as commonly occurs in
practice [16–18]. Calculating time-averaged glucose compen-
sates for an unequal time distribution of glucose measure-
ments. However, hypoglycaemic episodes may still lower
such an index, thus falsely suggesting normoglycaemia when
in reality hyperglycaemia is present.
We hypothesized that an index that takes into account the
unequal time distribution of glucose sampling and which is
not falsely lowered by low glucose values would be a better
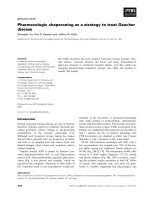
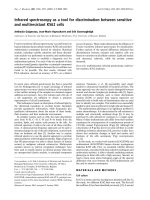
index of glucose regulation. We defined the hyperglycaemic
index (HGI; Fig. 1) as the area under the glucose curve above
the normal range divided by the length of stay.
We evaluated the association of HGI and conventional
glucose indices of regulation with mortality in a large group of
ICU patients with a prolonged ICU stay.
Methods
In a retrospective analysis we included all patients older than
15 years of age admitted to the surgical ICU of our tertiary
teaching hospital from 1990 to the end of 2001. Because
glucose control appears to be particularly important in
patients with prolonged stay in the ICU, we studied only
those patients who stayed for 4 days or longer in the ICU
[4,5]. Age, sex, admission type and the Acute Physiology and
Chronic Health Evaluation (APACHE) II score were obtained
from case records and electronic databases of all admitted
patients to our hospital. Blood glucose values were obtained
from the central laboratory database.
Therapeutic protocol
Patients were fed enterally as soon as possible. Total
parenteral nutrition was only given when enteral nutrition
failed. Concentrated glucose infusion was not routinely used.
Insulin was administrated only to patients with diabetes
mellitus or patients with glucose levels exceeding 10.0 mmol/l,
and was never administered at rates of infusion greater than
10 IU/hour. Whole blood samples were taken from arterial or
central lines and sent to the central laboratory for glucose
measurement.
Glucose indices
Admission glucose was defined as the first measurement
after ICU admission. Morning glucose was calculated as the
arithmetic mean of all measurements done between
06:00 hours and 08:00 hours [4,5]. Mean glucose was
calculated as the arithmetic mean of all measurements.
Maximum glucose was the highest glucose determined for
the entire ICU stay.
To determine the HGI of a patient, all glucose measurements
performed during the ICU stay were analyzed. As indicated in
Fig. 1, the first step was to interpolate all glucose values.
Then, the area between this glucose curve and the upper
normal range was calculated. HGI was defined as this area
under the curve divided by the total length of stay, thus
making HGI independent of length of stay.
Because the Leuven study [4,5] demonstrated improved
outcome by lowering glucose levels to under 6.0 mmol/l, we
chose this value as our upper range of normal in all tests
unless otherwise noted. Since the Leuven study was reported,
others have hypothesized that 6.0 mmol/l might not be the
best target [19]. Therefore, we also performed an analysis of
the performance of HGI at cutoff levels other than 6.0 mmol/l.
As for other measures of glucose regulation, HGI is
expressed in millimoles per litre (mmol/l). Thus, a patient in
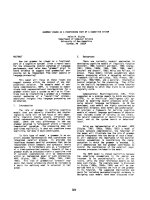
Figure 1
Calculation of the hyperglycaemic index (HGI). All measured glucose
values (black dots) and their corresponding sampling times are taken
into account. The average over time is calculated for the area (shaded)
under the glucose curve for hyperglycaemic values only. The normal
glucose range is indicated by the hatched area, with 6.0 mmol/l
(dotted line) the cutoff. HGI is the shaded area divided by the total
length of stay. In this case HGI is 0.73 mmol/l, as indicated by the
dashed line. Note that normal or hypoglycaemic measurements do not
affect HGI, and thus they do not falsely lower this index.
R124
Critical Care June 2004 Vol 8 No 3 Vogelzang et al.
whom all glucose values are 8.5 mmol/l will have an HGI of
2.5 mmol/l. A patient who is normoglycaemic, with all
measured glucose levels at 6.0 mmol/l or less, will have an
HGI of 0.0 mmol/l.
Even though the primary focus of the present study is
hyperglycaemia, the importance hypoglycaemia should not be
underestimated, and so we determined the incidence of
severely hypoglycaemic (glucose <2.7 mmol/l) episodes [6,7].
Statistical analysis
Data were expressed as medians and interquartile ranges
(IQRs) unless otherwise indicated. Differences between
groups were assessed using the Mann–Whitney U test, and
χ
2
analysis was used to test differences between proportions.
The primary end-point was 30-day mortality. In univariate
analysis we assessed the performance of HGI and other
glucose-derived measures in relation to 30-day mortality.
Patients were subgrouped into survivors (i.e. patients alive at
30 days) and nonsurvivors. Receiver operator characteristic
(ROC) curves were computed. We performed a multivariate
binary logistic regression analysis with age, sex, type of
admission, APACHE II score and all glucose-derived
measures as independent parameters, and 30-day mortality
as the dependent parameter. Differences were considered
significant for a two-tailed P value < 0.05. The Statistical
Package for the Social Sciences (version 11.0.1; SPSS Inc,
Chicago, IL, USA) was used to conduct statistical analyses.
Results
During the 12-year period of the study, 6885 patients were
admitted to the ICU. A total of 1779 patients (26%) stayed
for a period of at least 4 days and were included in the
present study. The mean age was 55 years (standard deviation
19 years) and 65% were male. Table 1 lists the demo-
graphical data and glucose-related measures for survivors
and nonsurvivors. APACHE II scores were available for the
years 1992–1999; for all other parameters there were no
missing data. Abdominal surgery and trauma were the most
frequent reasons for ICU admission.
A total of 65,528 glucose measurements were performed in
the 1779 included patients, with a median number of glucose
measurements of 21 (IQR 11–42). In fewer than 1% of the
patients not a single glucose measurement was taken. The
median mean glucose concentration of all patients was
7.0 mmol/l (IQR 6.1–8.6 mmol/l), median morning glucose
was 6.7 mmol/l (IQR 5.9–8.1 mmol/l), median admission
glucose was 7.3 mmol/l (IQR 5.8–9.7 mmol/l), median
maximum glucose was 8.7 mmol/l (IQR 6.9–11.6 mmol/l) and
median HGI was 1.0 mmol/l (IQR 0.4–2.4 mmol/l). Severe
hypoglycaemia (glucose <2.7 mmol/l) occurred in 177
Table 1
Characteristics for surviving and non-surviving patients and results of univariate analysis of glucose indices
Characteristic Survivors Nonsurvivors P
Number of patients (n [%]) 1484 (83) 295 (17)
Male sex (n [%]) 982 (66) 182 (61) 0.18
Age (years; mean ± SD) 53 ± 19 63 ± 16 <0.001
Length of ICU stay (days) 10 (6–20) 10 (6-17) 0.12
Reason for ICU admission (n [%]) <0.001
Trauma 372 (25) 30 (10)
Abdominal surgery 443 (30) 101 (34)
Liver transplant 219 (15) 38 (13)
Vascular surgery 164 (11) 51 (17)
Miscellaneous 286 (19) 75 (25)
APACHE II score 18 (14–23) 25 (20–28) <0.001
Number of glucose measurements 20 (10.5–41) 27 (15–45) <0.001
Mean glucose (mmol/l) 6.9 (6.0–8.4) 7.7 (6.4–9.5) <0.001
Morning glucose (mmol/l) 6.6 (5.9–7.9) 7.5 (6.2–8.8) <0.001
Admission glucose (mmol/l) 7.2 (5.8–9.5) 7.9 (6.0–10.9) 0.07
Maximum glucose (mmol/l) 10.2 (8.0–14.2) 12.3 (9.5–16.4) <0.001
HGI (mmol/l) 0.9 (0.3–2.1) 1.8 (0.7–3.4) <0.001
Values are expressed as median (interquartile range) unless otherwise stated. APACHE, Acute Physiology and Chronic Health Evaluation; HGI,
hyperglycaemic index; ICU, intensive care unit; SD, standard deviation.
R125
(6.6%) patients. The median duration of such hypoglycaemic
episodes was 1.5 hours (IQR 0.6–3.4 hours).
Survivors and nonsurvivors both stayed in the ICU for a
median of 10 days (IQR 6–20 days for survivors and
6–17 days for nonsurvivors). A total of 295 patients (17%)
died within 30 days after ICU admission.
In the univariate analysis, the median mean glucose level was
7.7 mmol/l in nonsurvivors and 6.8 mmol/l in survivors
(P < 0.001). Median HGI was 1.8 mmol/l in nonsurvivors,
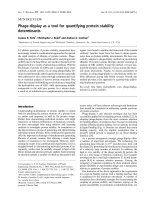
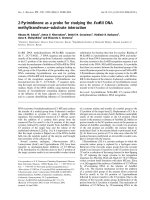
which was twice that in survivors (P < 0.001). The ROC
curves for all glucose-derived parameters are shown in Fig. 2.
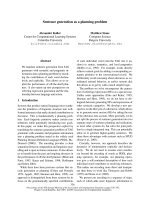
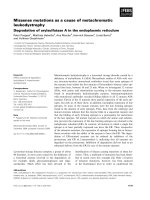
HGI had the highest area under the curve (0.64). Fig. 3
shows the relations between HGI quartiles and mortality.
Mortality in the lowest HGI quartile was 8.6% as compared
with 25.1% in the highest HGI quartile (P < 0.001).
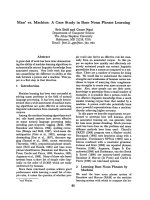
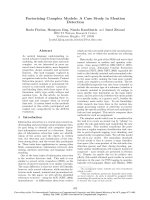
Fig. 4 shows the area under the ROC curve for HGI when
cutoff values other than 6.0 mmol/l are used.
In multivariate analysis with APACHE II score, sex and age,
HGI remained the only statistically significant glucose index in
the binary logistic model (P < 0.001). P values for mean
glucose, morning glucose, admission glucose and maximum
glucose were 0.08, 0.17, 0.43 and 0.49, respectively. With
regard to mortality, the results of regression analysis did not
differ between the cohort of patients whose APACHE II
scores were available and the cohort of patients whose
APACHE II scores were not.
Discussion
Of all measures of hyperglycaemia evaluated, HGI correlated
best with 30-day mortality in this population of critically ill
patients. This supports our hypothesis that HGI is a useful
index for quantifying glucose control. Therefore, assuming
that normoglycaemia is the aim, the goal of a glucose–insulin
algorithm is clear. The algorithm should obtain an HGI as
close to zero as possible.
Both in the univariate analysis and in the multivariate binary
logistic regression analysis – in which severity of illness, age
Available online />Figure 2
Receiver operator characteristic (ROC) curves for different glucose
measures. HGI, hyperglycaemic index.
0
0.2
0.4
0.6
0.8
1
0 0.2 0.4 0.6 0.8 1
1 - specificity
sensitivity
HGI
mean glucose
admission glucos
e
maximum gluc os
e
morning glucose
Figure 3
Relation between hyperglycaemic index (HGI; divided into quartiles)
and mortality. In the highest quartile mortality is nearly three times
higher than mortality in the lowest quartile (P < 0.001).
HGI and mortality
0%
10%
20%
30%
0 - 0.4 mmol/l 0.4 - 1.0 mmol/l 1.0 - 2.4 mmol/l 2.4 - 8.9 mmol/l
HGI quartiles
30 day mortality
Figure 4
Hyperglycaemic index (HGI) for various glucose cutoffs. The cutoff in
all other analyses was chosen at 6 mmol/l because it was the upper
limit of the intensive treatment group in the Leuven study [4,5]. To see
how HGI performs at other cutoff values, the area under the ROC
curve was determined for HGI cutoffs from 4.0 to 15.0 mmol/l. In the
patients studied, a cutoff between 6.0 and 8.0 mmol/l was associated
with the greatest area.
0,5
0,6
0,7
4 6 8 10121416
Cut-off for HGI mmol/l
ROC area
R126
and sex were included – HGI emerged as the best indicator
of hyperglycaemia. We assume this reflects the fact that HGI
takes better account of the variation in glucose concentra-
tions over time, and avoids the possibility that alternating high
and low values will average out to yield a normal value.
The principle of calculating the area under the glucose curve
is not new. Brown and Dodek [8] determined the area under
the curve above a glucose threshold of 11.5 mmol/l. The area
under the curve was used to assess the speed of initial normal-
ization of glucose with an insulin algorithm. Other recent studies
have also used glucose thresholds above 10.0 mmol/l to separ-
ate good control from poor control [20,21]. However, follow-
ing the publication of the Leuven study findings [4,5] such
thresholds are now considered high, because that study demon-
strated improved outcome if normoglycaemia (4.4–6.1 mmol/l)
was pursued. Because the vast majority of glucose
concentrations in the patients studied here were below
10 mmol/l, crucial information would have been lost if a cutoff
of 10.0 mmol/l had been used, as reflected by a decreased
area under the ROC curve at a cutoff value for calculation of
HGI of 10.0 mmol/l (Fig. 4). The cutoff of 6.0 mmol/l was
based on the upper limit of the group of patients with strict
regulation in the Leuven study [4,5]. Recently, Finney and
colleagues [19] found that glucose regulation below
8.3 mmol/l was not related to a better outcome. This is in
accord with our observations; Fig. 4 shows that the optimal
cutoff for calculation of HGI lies between 6.0 and 8.0 mmol/l.
Some limitations of the present study should be mentioned.
The study is a retrospective, single ICU study that covers a
period when strict glucose control was not a major issue.
Mortality at 30 days was used as an outcome measure to
identify the best glucose index. HGI was the best measure of
glucose control, but with a ROC area of 0.64 HGI alone
cannot serve as a useful predictor of mortality. The relative
contributions of endogenous glucose production, exogenous
glucose supply and insulin to HGI and other some other
measures could not be identified because our study did not
include glucose infusion or (par)enteral feeding, and neither
did it include intensive treatment with insulin.
It should be stressed that HGI was designed to quantify hyper-
glycaemia and not hypoglycaemia. Prevention of hypoglycaemia
is a critical requirement of any algorithm for glucose control
[5–7]. However, unlike hyperglycaemia, hypoglycaemia is a
phenomenon that tends to be relatively short-lived, as our results
show, and could be quantified using more straightforward
measures such as the lowest glucose concentration.
An elevated admission glucose level is associated with a
worse outcome; this has been found by many investigators in
various patient categories, and was also found in the present
study [1–3,12,13,22–30]. In our study, however, the area
under the ROC curves was smaller for conventional
measures of glucose control than it was for HGI.
Like other indices of glucose control, HGI is related to
outcome. In contrast to admission glucose, however, HGI is
also amenable to therapy. HGI involves additional computa-
tion (Fig. 1) as compared with more straightforward indices
but it does not require more information. Calculating HGI
should be feasible in ICUs that possess a patient database
management system that can provide automated input for the
HGI calculation. The fact that HGI expresses glucose
regulation as a single value has methodological advantages.
The performance of glucose–insulin algorithms could be
compared with HGI, and therefore it is important to measure
glucose regularly. A major advantage of HGI is that periods of
very frequent sampling (e.g. during hyperglycaemia or
hypoglycaemia) are compensated for because HGI is based
on an average over time.
HGI must be reassessed in the era of tighter glucose control.
Moreover, the value of HGI needs confirmation in other ICUs.
Because HGI has not been used by other investigators, it
would be of interest to determine how HGI compares with
other glucose indices in observational or intervention studies.
Existing glucose patient databases could be reanalyzed to
determine HGI. The use of glucose measures to predict
outcome independently of other parameters such as age and
severity scores is interesting but lacks power, as is shown by
the area under the ROC. In general, HGI may be more useful
for relating hyperglycaemia to organ failure scores such as
the Sequential Organ Failure Assessment score [31] or
parameters of systemic inflammation.
Continuous measurements of blood glucose will allow us to
calculate and compare HGI and the value of other glucose
measures to a degree that is not possible with intermittent
measurements [32–35]. Currently available glucose sensors
are promising but have not yet proven to be sufficiently
reliable in critically ill patients and do not allow continuous
measurements over prolonged periods [32–35].
Critical Care June 2004 Vol 8 No 3 Vogelzang et al.
Key messages
• Strict glucose control in ICU patients calls for a
measure of hyperglycaemia similar to what HbA1c is in
diabetic outpatients
• Admission glucose, mean glucose and morning
glucose all have drawbacks as indicators of overall
hyperglycaemia
• The hyperglycemic index (HGI) was conceived to
integrate glucose measurements as they are
performed in practice into a single value
• In 1779 surgical ICU patients HGI exhibited a better
relation with outcome than other glucose measures
• HGI may be a useful measure of glucose control
R127
Conclusion
In conclusion, HGI quantifies the impact of hyperglycaemia in
critically ill patients better than other glucose indices. HGI
may thus be a useful measure of glucose control.
Note
On request an annotated computer program with source
code that calculates HGI, as well as regular glucose indices,
will be provided. The program is written in the multiplatform
language Java, and should run on every major platform.
Competing interests
ICC van der Horst is consultant for Medtronic Minimed. M
Vogelzang and MWN Nijsten: none declared.
Acknowledgements
Research by ICC van der Horst was supported by a grant of The
Netherlands Heart Foundation (99.028).
References
1. Capes SE, Hunt D, Malmberg K, Gerstein HC: Stress hypergly-
caemia and increased risk of death after myocardial infarction
in patients with and without diabetes: a systematic overview.
Lancet 2000, 355:773-778.
2. Capes SE, Hunt D, Malmberg K, Pathak P, Gerstein HC: Stress
hyperglycemia and prognosis of stroke in nondiabetic and
diabetic patients: a systematic overview. Stroke 2001, 32:
2426-2432.
3. Umpierrez GE, Isaacs SD, Bazargan N, You X, Thaler LM, Kitabchi
AE: Hyperglycemia: an independent marker of in-hospital
mortality in patients with undiagnosed diabetes. J Clin
Endocrinol Metab 2002, 87:978-982.
4. van den Berghe G, Wouters P, Weekers F, Verwaest C, Bruyn-
inckx F, Schetz M, Vlasselaers D, Ferdinande P, Lauwers P, Bouil-
lon R: Intensive insulin therapy in the critically ill patients.
N Engl J Med 2001, 345:1359-1367.
5. van den Berghe G, Wouters PJ, Bouillon R, Weekers F, Verwaest
C, Schetz M, Vlasselaers D, Ferdinande P, Lauwers P: Outcome
benefit of intensive insulin therapy in the critically ill: Insulin
dose versus glycemic control. Crit Care Med 2003, 31:359-366.
6. Fischer KF, Lees JA, Newman JH: Hypoglycemia in hospitalized
patients. Causes and outcomes. N Engl J Med 1986, 315:
1245-1250.
7. Stagnaro-Green A, Barton MK, Linekin PL, Corkery E, deBeer K,
Roman SH: Mortality in hospitalized patients with hypo-
glycemia and severe hyperglycemia. Mt Sinai J Med 1995, 62:
422-426.
8. Brown G, Dodek P: Intravenous insulin nomogram improves
blood glucose control in the critically ill. Crit Care Med 2001,
29:1714-1719.
9. Tenerz A, Lonnberg I, Berne C, Nilsson G, Leppert J: Myocardial
infarction and prevalence of diabetes mellitus. Is increased
casual blood glucose at admission a reliable criterion for the
diagnosis of diabetes? Eur Heart J 2001, 22:1102-1110.
10. Tenerz A, Norhammar A, Silveira A, Hamsten A, Nilsson G, Ryden L,
Malmberg K: Diabetes, insulin resistance, and the metabolic
syndrome in patients with acute myocardial infarction without
previously known diabetes. Diabetes Care 2003, 26:2770-2776.
11. Woo J, Lam CW, Kay R, Wong AH, Teoh R, Nicholls MG: The
influence of hyperglycemia and diabetes mellitus on immedi-
ate and 3-month morbidity and mortality after acute stroke.
Arch Neurol 1990, 47:1174-1177.
12. Bolk J, van der PT, Cornel JH, Arnold AE, Sepers J, Umans VA:
Impaired glucose metabolism predicts mortality after a
myocardial infarction. Int J Cardiol 2001, 79:207-214.
13. Gore DC, Chinkes D, Heggers J, Herndon DN, Wolf SE, Desai M:
Association of hyperglycemia with increased mortality after
severe burn injury. J Trauma 2001, 51:540-544.
14. Krinsley JS: Association between hyperglycemia and
increased hospital mortality in a heterogeneous population of
critically ill patients. Mayo Clin Proc 2003, 78:1471-1478.
15. Yendamuri S, Fulda GJ, Tinkoff GH: Admission hyperglycemia
as a prognostic indicator in trauma. J Trauma 2003, 55:33-38.
16. Bonnier M, Lonnroth P, Gudbjornsdottir S, Attvall S, Jansson PA:
Validation of a glucose-insulin-potassium infusion algorithm in
hospitalized diabetic patients. J Intern Med 2003, 253:189-193.
17. van der Horst IC, Gans RO, Nijsten MW, Ligtenberg JJ: Benefi-
cial effect of glucose-insulin-potassium infusion in noncriti-
cally ill patients has to be proven [letter]. J Intern Med 2003,
254:513.
18. Bonnier M, Lonnroth P, Gudbjornsdottir S, Attvall S, Jansson PA:
Beneficial effect of glucose–insulin–potassium infusion in
noncritically ill patients has to be proven: reply [letter]. J Intern
Med 2003, 254:514.
19. Finney SJ, Zekveld C, Elia A, Evans TW: Glucose control and
mortality in critically ill patients. JAMA 2003, 290:2041-2047.
20. Pomposelli JJ, Baxter JK, III, Babineau TJ, Pomfret EA, Driscoll DF,
Forse RA, Bistrian BR: Early postoperative glucose control pre-
dicts nosocomial infection rate in diabetic patients. JPEN J
Parenter Enteral Nutr 1998, 22:77-81.
21. Furnary AP, Zerr KJ, Grunkemeier GL, Starr A: Continuous intra-
venous insulin infusion reduces the incidence of deep sternal
wound infection in diabetic patients after cardiac surgical pro-
cedures. Ann Thorac Surg 1999, 67:352-360.
22. Bruno A, Biller J, Adams HP Jr, Clarke WR, Woolson RF, Williams
LS, Hansen MD: Acute blood glucose level and outcome from
ischemic stroke. Trial of ORG 10172 in Acute Stroke Treat-
ment (TOAST) Investigators. Neurology 1999, 52:280-284.
23. Dorhout Mees SM, Van Dijk GW, Algra A, Kempink DR, Rinkel GJ:
Glucose levels and outcome after subarachnoid hemorrhage.
Neurology 2003, 61:1132-1133.
24. Foo K, Cooper J, Deaner A, Knight C, Suliman A, Ranjadayalan K,
Timmis AD: A single serum glucose measurement predicts
adverse outcomes across the whole range of acute coronary
syndromes. Heart 2003, 89:512-516.
25. Lam AM, Winn HR, Cullen BF, Sundling N: Hyperglycemia and
neurological outcome in patients with head injury. J Neurosurg
1991, 75:545-551.
26. Paret G, Barzilai A, Lahat E, Feldman Z, Ohad G, Vardi A, Ben
Abraham R, Barzilay Z: Gunshot wounds in brains of children:
prognostic variables in mortality, course, and outcome. J Neu-
rotrauma 1998, 15:967-972.
27. Penney DG: Hyperglycemia exacerbates brain damage in
acute severe carbon monoxide poisoning. Med Hypotheses
1988, 27:241-244.
28. Rovlias A, Kotsou S: The influence of hyperglycemia on neuro-
logical outcome in patients with severe head injury. Neuro-
surgery 2000, 46:335-342.
29. Young B, Ott L, Dempsey R, Haack D, Tibbs P: Relationship
between admission hyperglycemia and neurologic outcome of
severely brain-injured patients. Ann Surg 1989, 210:466-472.
30. Goldberg PA, Siegel MD, Sherwin RS, Halickman JI, Lee M,
Bailey VA, Lee SL, Dziura JD, Inzucchi SE: Implementation of a
safe and effective insulin infusion protocol in a medical inten-
sive care unit. Diabetes Care 2004, 27:461-467.
31. Vincent JL, Moreno R, Takala J, Willatts S, de Mendonca A, Bruin-
ing H, Reinhart CK, Suter PM, Thijs LG: The SOFA (Sepsis-
related Organ Failure Assessment) score to describe organ
dysfunction/failure. On behalf of the Working Group on
Sepsis-Related Problems of the European Society of Inten-
sive Care Medicine. Intensive Care Med 1996, 22:707-710.
32. Chee F, Fernando T, van Heerden PV: Closed-loop control of
blood glucose levels in critically ill patients. Anaesth Intensive
Care 2002, 30:295-307.
33. Chee F, Fernando T, van Heerden PV: Closed-loop glucose
control in critically ill patients using continuous glucose moni-
toring system (CGMS) in real time. IEEE Trans Inf Technol
Biomed 2003, 7:43-53.
34. Jungheim K, Wientjes KJ, Heinemann L, Lodwig V, Koschinsky T,
Schoonen AJ: Subcutaneous continuous glucose monitoring:
feasibility of a new microdialysis-based glucose sensor
system. Diabetes Care 2001, 24:1696-1697.
35. Kapitza C, Lodwig V, Obermaier K, Wientjes KJ, Hoogenberg K,
Jungheim K, Heinemann L: Continuous glucose monitoring:
reliable measurements for up to 4 days with the SCGM1
system. Diabetes Technol Ther 2003, 5:609-614.
Available online />