Báo cáo y học: "Erythropoietin and renin as biological markers in critically ill patients" potx
Bạn đang xem bản rút gọn của tài liệu. Xem và tải ngay bản đầy đủ của tài liệu tại đây (286.39 KB, 8 trang )
Open Access
Available online />R328
October 2004 Vol 8 No 5
Research
Erythropoietin and renin as biological markers in critically ill
patients
Fabienne Tamion
1
, Véronique Le Cam-Duchez
2
, Jean-François Menard
3
, Christophe Girault
1
,
Antoine Coquerel
4
and Guy Bonmarchand
5
1
Intensive Care Consultant, Medical Intensive Care Unit, Rouen University Hospital, Rouen, France
2
Hematologist, Radioanalysis Laboratory and Hematology Laboratory, Rouen University Hospital, Rouen, France
3
Department of Biostatistics, Caen University Hospital, Caen, France
4
Head of Pharmacology, Radioanalysis Laboratory, Rouen University Hospital, Rouen, and Department of Pharmacology, Caen University Hospital,
Caen, France
5
Head of Medical Intensive Care, Medical Intensive Care Unit, Rouen University Hospital, Rouen, France
Corresponding author: Fabienne Tamion,
Abstract
Introduction During sepsis the endocrine, immune and nervous systems elaborate a multitude of
biological responses. Little is known regarding the mechanisms responsible for the final circulating
erythropoietin (EPO) and renin levels in septic shock. The aim of the present study was to assess the
role of EPO and renin as biological markers in patients with septic shock.
Methods A total of 44 critically ill patients with septic shock were evaluated.
Results Nonsurvivors had significantly higher serum EPO levels than did survivors on admission
(median [minimum–maximum]; 61 [10–602] versus 20 [5–369]). A negative relationship between
serum EPO and blood haemoglobin concentrations was observed in the survivor group (r = -0.61; P
< 0.001). In contrast, in the nonsurvivors the serum EPO concentration was independent of the blood
haemoglobin concentration. Furthermore, we observed significant relationships between EPO
concentration and lactate (r = 0.5; P < 0.001), arterial oxygen tension/fractional inspired oxygen ratio
(r = -0.41; P < 0.005), arterial pH (r = -0.58; P < 0.001) and renin concentration (r = 0.42; P < 0.005).
With regard to renin concentration, significant correlations with lactate (r = 0.52; P < 0.001) and
arterial pH (r = -0.33; P < 0.05) were observed.
Conclusion Our findings show that EPO and renin concentrations increased in patients admitted to
the intensive care unit with septic shock. Renin may be a significant mediator of EPO upregulation in
patients with septic shock. Further studies regarding the regulation of EPO expression are clearly
warranted.
Keywords: biological markers, critically ill patients, erythropoietin, renin, septic shock
Introduction
Sepsis is an excessive systemic response to infection leading
to numerous reactions in the host, including release of proin-
flammatory and anti-inflammatory cytokines [1]. During sepsis,
the endocrine, immune and nervous systems produce a multi-
tude of biological responses. Further evaluation of their role in
sepsis is warranted because this may yield insights that could
help us to improve therapeutic outcomes [2].
Use of steroids as an adjunct in septic shock has been pro-
posed [3]. Some studies demonstrated adrenal insufficiency
in septic patients with poor survival where supplementary
Received: 19 December 2003
Revisions requested: 13 February 2004
Revisions received: 7 April 2004
Accepted: 5 June 2004
Published: 9 August 2004
Critical Care 2004, 8:R328-R335 (DOI 10.1186/cc2902)
This article is online at: />© 2004 Tamion et al.; licensee BioMed Central Ltd. This is an Open
Access article: verbatim copying and redistribution of this article are
permitted in all media for any purpose, provided this notice is preserved
along with the article's original URL.
AT
1
= angiotensin II receptor subtype 1; EPO = erythropoietin; FiO
2
= fractional inspired oxygen; MAP = mean arterial pressure; PaO
2
= arterial oxy-
gen tension; SAPS = Simplified Acute Physiology Score.
Critical Care October 2004 Vol 8 No 5 Tamion et al.
R329
steroids were not administered [4,5]. Acute-phase protein
(APP) synthesis represent a non-specific response of the liver
and induce the production of similar proteins [6]. Of the acute-
phase proteins studied in humans, findings with C-reactive
protein have shown that this protein is a particularly useful indi-
cator of progression of various pathological states [7,8].
Erythropoietin (EPO) is a response element that is related to
hypoxic injury [9]. It is also a glycoprotein hormone that is pri-
marily released by the kidney, and which stimulates red blood
cell production in order to increase oxygen transfer and deliv-
ery [10]. In vitro and in vivo evidence suggests that hypoxia
and anaemia are the most important stimuli of increased EPO
production [11]. Reduced arterial oxygen content associated
with anaemia or hypoxia is the predominant stimulus for EPO
production [12,13]. Conditions associated with anaemia usu-
ally result in an exponential increase in EPO synthesis within
minutes to hours [14]. The EPO response to known physiolog-
ical stimuli is blunted in critically ill patients, and so EPO defi-
ciency may contribute to the development of anaemia in these
patients [15]. Abnormally high serum EPO levels appear to be
a negative prognostic indicator in patients suffering from sep-
tic shock [16,17]. However, little is known regarding the
mechanisms responsible for the final level of circulating EPO
in septic shock.
Recently, some authors have emphasized a possible influence
of the renin–angiotensin system on EPO gene expression
[18]. Renin is released by the kidney, and its regulatory mech-
anisms include stimulation by postcapillary output in kidney
perfusion and adrenergic stimulation by β-receptors [19,20].
Current evidence suggests that angiotensin II may be involved
in the regulation of renal EPO production [18]. The signal
appears to be mediated via angiotensin II receptor subtype 1
(AT
1
) receptors [21]. Thus, angiotensin II may be considered
an important physiological modulator of EPO production in
humans.
The aim of the present study was to assess the potential utility
of EPO and renin as biological markers in patients with septic
shock.
Methods
Patients
The present study was approved by the Hospital Ethics Com-
mittee and written informed consent was obtained from each
patient's closest relative. The study included 50 consecutive
patients with septic shock, as defined by the American Col-
lege of Chest Physicians/Society of Critical Care Medicine
Conference Consensus Committee, over 1 year (November
1999–November 2000). Patient inclusion criteria, after opti-
mal volume resuscitation, were as follows (at baseline): mean
arterial pressure (MAP) below 60 mmHg; signs of altered per-
fusion, such as as oliguria (<30 ml/hour) or increased lactate
level; and a cardiac index greater than 3.5 l/min per m
2
.
All patients were included in the study within 24 hours of meet-
ing these criteria. Volume resuscitation was considered opti-
mal when, at a given level, infusion of additional fluids was no
longer accompanied by an increase in cardiac index. After
optimal volume resuscitation, vasopressor agents were admin-
istered according to the therapeutic protocol. For noradrena-
line (norepinephrine), the dose was started at 0.3 µg/kg per
min. The infusion rate was titrated with respect to MAP at 5-
min intervals to achieve a MAP in excess of 80 mmHg with a
stable or increased cardiac index. If necessary, after the first
hour the vasopressor agent was again titrated to achieve the
same MAP. Dobutamine was administrated to patients with
low cardiac index (<2.5 l/min per m
2
).
In addition, a diagnosis of sepsis required confirmation of an
ongoing infectious process, as indicated by one of the follow-
ing criteria: one positive blood culture of a known pathogen;
and suspected or evident source of systemic infection, from
which a known pathogen was cultured.
The Multiple Organ Dysfunction Score was calculated as
described by Marshal and coworkers [22]. The severity of ill-
ness was assessed using the Simplified Acute Physiology
Score (SAPS) II within 24 hours after admission to the medical
intensive care unit. Patients were followed for 28 days after the
start of the study or until death.
Excluded from the study were patients with a previous medical
story of malignant disease (cancer and haematologic malig-
nancy), AIDS, chronic renal failure (measured creatinine clear-
ance <50 ml/min), chronic hepatic insufficiency, severe
chronic obstructive pulmonary disease requiring oxygen ther-
apy, refractory anaemia (iron deficiency, aplastic anaemia) or
acute anaemia (haemolytic anaemia, pulmonary haemorrhage),
or prior administration of EPO or transfusion. To describe spe-
cifically the hormonal response elicited by the sepsis process
itself, we excluded patients with pre-existing diseases that
could be responsible for hormonal dysfunction, particularly in
the hypothalamic–hypophyseal–adrenal axis and the renin–
angiotensin–aldosterone system. Because EPO deficiency
may be expected in acute renal failure, as in chronic renal fail-
ure, we excluded six patients with acute renal failure.
Data and blood sampling and processing
Descriptive data consisting of demographics, diagnosis, clini-
cal data, and severity score were recorded. Blood samples
were collected from patients on admission to the medical
intensive care unit. Then, blood samples were obtained every
24 hours for the following 48 hours. Patients who died were
sampled in this sequence until the time of death. Except for
analyses that were performed immediately (gas pressure, ion-
ogram, haemogram), blood samples were collected in EDTA-
containing tubes, centrifuged for 10 min at 1300 g and stored
in multiple aliquots at -70°C. Plasma samples were thawed at
Available online />R330
37°C once before use in the assays to obtain results among
specific samples of hormone analysis.
Routine laboratory evaluation
Routine laboratory tests were performed at baseline and
included arterial blood gas evaluation, creatinine, bilirubin,
platelets, leucocytes, and the arterial oxygen tension (PaO
2
)/
fractional inspired oxygen (FiO
2
) ratio (hypoxaemia score).
For lactate measurements, arterial blood samples were col-
lected in tubes containing fluoride oxalate. Lactate was meas-
ured using an enzymatic colorimetric method adapted for an
automatic analyzer (Beckman Instruments, Paris, France) and
2 mmol/l was considered the upper limit of the normal range.
Erythropoietin measurement
EPO concentrations were determined using an immunoenzy-
matic assay (R & D Systems, Paris, France). This assay is
highly specific and can detect EPO concentrations as low as
0.25 UI/l. The normal range in healthy adults is 5–25 UI/l. For
values from 10 to 500 UI/l the assay accuracy was better than
7% and 5% during intra-assay and interassay comparisons,
respectively.
Renin measurement
Renin was measured on the basis of its action on angiotensin
in plasma, generating angiotensin I. Renin concentrations
were determined by radioimmunoassay (SANOFI Pasteur,
Paris, France). Normal values in healthy adults range between
7 and 19 ng/l.
Statistical analysis
Qualitative values were analyzed using Fischer's exact test.
Differences between admission values for survivors and non-
survivors were tested for significance using Mann–Whitney U-
test. Correlation between two variables was assessed using
the Spearman rank test. Differences between variables on day
1 and on subsequent days were evaluated using the Wilcoxon
signed rank test. The results of these tests are expressed as
mean ± standard deviation, or as median (range; minimum–
maximum). P < 0.05 was considered statistically significant.
Results
Baseline characteristics of the patients
In the present study a total of 44 patients were followed up
over 1 year. The baseline demographic data for the patients
are shown in Table 1. The mean patient age was 61 ± 10 years
in the survivors and 58 ± 11 in the nonsurvivors. The mean
SAPS II score on admission was 52 ± 10.6 in survivors and
56 ± 9.5 in nonsurvivors. Thirteen out of 44 patients had died
by day 28, two of them in the second day after admission. The
cause of death was sepsis-related multiple organ failure. The
sources of infection leading to study admission are also listed
in Table 1. Thirteen patients had hypoxaemia, defined as par-
tial oxygen saturation below 88%. After optimal volume resus-
citation, vasopressor agents were administered. All patients
received noradrenaline or noradrenaline/dobutamine.
Noradrenaline was administered to 29 patients and noradren-
aline/dobutamine was administered to 15 patients at doses
shown in Table 1. Anaemia developed in all patients, but there
were no significant differences between survivors and nonsur-
vivors at admission or after 24 or 48 hours (Table 2). Blood
haemoglobin concentrations were 10.5 (9.8–11.2) g/dl and
10.2 (9.3–11.3) g/dl, respectively, in survivors and nonsurvi-
vors at admission. No patient received a blood transfusion dur-
ing the study, and none received steroids during this
observational study.
Predictive value of admission parameters
Admission values for patients were stratified according to
whether they survived or died and were compared between
groups (Table 3). Comparisons were made to determine
whether differences in routine parameters could serve as
prognostic indicators. When admission values were stratified
in this manner, three variables (arterial pH, PaO
2
/FiO
2
ratio,
and serum bilirubin) were significantly different between the
two groups.
Time course of erythropoietin and renin levels
The time course of EPO and renin values are shown in Table
2, with patients stratified according to survival. Nonsurvivors
had significantly higher serum EPO levels than did survivors
throughout the study (61 [10–602] UI/l versus 20 [5–369] UI/
l on admission). No significant changes in the survivor patients
were observed from admission to the end of day 2 (admission
20 [5–369] UI/l, 1 day 15 [1–512] UI/l, 2 days 14 [1–191] UI/
l).
On admission, nonsurvivors exhibited high renin levels. How-
ever, this difference did not reach statistical significance in
comparison with survivors (82 [7–1020] mmol/l in nonsurvi-
vors versus 47 [2–1060] mmol/l in survivors). Survivors exhib-
ited a significant decrease from their initial values on day 1 and
day 2, whereas no change was observed in nonsurvivors. The
number of patients, particularly nonsurvivors (n = 13), was lim-
ited, and this may limit the ability to detect significant
relationships.
Correlations between different variables
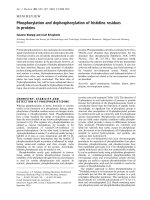
A negative relationship between serum EPO and blood hae-
moglobin concentrations was observed in the survivors (n =
31; r = -0.61; P < 0.001). In contrast, in nonsurvivors (n = 13)
the serum EPO concentration was independent of the blood
haemoglobin concentration (Fig. 1).
On admission there was a significant correlation between
EPO and SAPS score (r = 0.6; P < 0.001). However, serum
renin concentration was independent of SAPS score (r = -
0.005; not significant) on admission (Table 4). On examining
relationships between admission variables and outcome, we
Critical Care October 2004 Vol 8 No 5 Tamion et al.
R331
found the greatest correlation for EPO concentration.
Furthermore, on admission we observed significant relation-
ships between EPO concentration and lactate (r = 0.52; P <
0.001), PaO
2
/FiO
2
ratio (r = -0.41; P < 0.005), arterial pH (r
= -0.58; P < 0.001) and renin concentration (r = 0.42; P <
0.005).
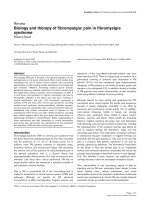
Figure 2 shows the receiver operating characteristic curves for
EPO, renin, lactate and arterial pH on admission. A cutoff point
was determined graphically for each parameter. An EPO con-
centration of 50 UI/l, a renin concentration of 50 ng/l and an
arterial pH of 7.35 were the most sensitive and specific cutoff
points (EPO: sensitivity 77%, specificity 81%; renin: sensitiv-
Table 1
Demographic data for the study population (n = 44)
Parameter Survivors (n = 31) Nonsurvivors (n = 13) P
Age (years) 61 ± 10 58 ± 11 NS
Sex (n)
Male 14 7 NS
Female 17 6 NS
SAPS II 50 ± 10.6 56 ± 9.5 NS
MODS 12 ± 8.4 14 ± 6.9 NS
Length of ICU stay (days) 6.1 (4–21) 7.4 (5–23) NS
Primary site of infection
Lung 15 7 NS
Urinary tract 5 3 NS
Blood 8 2 NS
Skin 3 1 NS
Patients on inotropes
Noradrenaline 20 9 NS
Noradrenaline/dobutamine 11 4 NS
Drug titration (µg/kg per min)
Noradrenaline 0.7 ± 0.45 0.72 ± 0.25 NS
Dobutamine 5 ± 2.2 5.2 ± 1.8 NS
Values are expressed as mean ± standard deviation, or as median (range). ICU, intensive care unit; MODS, Multiple Organ Dysfunction Score;
NS, not significant; SAPS, Simplified Acute Physiology Score.
Table 2
Erythropoietin, renin and haemoglobin values in survivors and nonsurvivors at different times: admission, 24 hours and 48 hours
Parameter Admission 24 hours 48 hours
Erythropoietin (UI/l)
Survivors 20 (5–369) 15 (1–512) 14 (1–191)
Nonsurvivors 61 (10–602)* 100 (7–652)* 35 (13–477)*
Renin (mmol/l)
Survivors 47 (2–1060) 21 (2–442) 20 (3–219)
Nonsurvivors 82 (7–1020) 80 (10–706)* 77 (22–410)*
Haemoglobin (g/dl)
Survivors 10.5 (9.8–11.2) 10.4 (10–10.8) 10.2 (9.3–10.8)
Nonsurvivors 10.2 (9.3–11.3) 10 (9–10.5) 10.3 (9.5–10.5)
Values are expressed as median (range). *P < 0.05 versus survivors.
Available online />R332
ity 70%, specificity 53% [P = 0.20]; lactate: sensitivity 62%,
specificity 68% [P = 0.07]; arterial pH: sensitivity 85%, spe-
cificity 77% [P < 0.001]). This model shows that EPO and
arterial pH on admission predicted outcome optimally (Table
5). On admission, renin and lactate were poor predictors of
prognosis in this model.
For renin, we found significant correlations with lactate (r =
0.52; P < 0.001) and arterial pH (r = -0.33; P < 0.005). No
correlation was found between renin concentration and other
biological parameters.
Discussion
The results presented here indicate that EPO and renin con-
centrations increased in patients admitted to a medical inten-
sive care unit with septic shock. Maximal concentrations of
EPO and renin were also observed in nonsurvivors. A signifi-
cant difference was apparent in EPO and renin levels from
admission to day 2 between patients who survived and those
who died. Furthermore, EPO levels were significantly corre-
lated with disease severity, as determined using clinical scores
(SAPS II, organ score failure score). EPO in critically ill
patients and its relationship with prognosis have previously
been reported [16,23]. Abnormally high serum EPO level
appeared to be a negative prognostic indicator in those
patients. We report here, for the first time, a cutoff value of
EPO that separates survivors and nonsurvivors with good sen-
sitivity and specificity. Analysis of receiver operating character-
istic curves showed that, under the conditions of the present
study, a cutoff for EPO of 50 UI/l on admission was optimal for
predicting death. Our data also suggest that EPO synthesis is
activated to a greater degree in nonsurvivors than in survivors.
The data presented here regarding the prognostic value of
EPO confirm and extend findings of similar, limited studies
conducted in critically ill patients, particularly in children [17].
Erythropoiesis is regulated principally through EPO, a hor-
mone glycoprotein that is produced in the renal peritubular
cells, which is responsible for the maturation and proliferation
of the erythroid cell line [24]. In vivo, plasma EPO concentra-
tions represent a complex interaction between EPO synthesis
and degradation [25]. EPO is metabolized in the liver, under-
goes renal excretion and is probably catabolized after utiliza-
tion in erythropoietic tissues. Increased plasma EPO
concentrations can be observed within 2 hours of exposure of
individuals to acute hypoxic or anaemic conditions [26,27].
Local and circulating substances, including prostaglandin,
arachidonic acid, adenosine, glucocorticoids and cytokines,
are known to modulate EPO production [27]. Cytokines have
been shown to suppress the in vitro synthesis of EPO in
human cell cultures [28,29]. Interleukin-6 upregulates EPO
expression in a dose-dependent manner, whereas interleukin-
1 and tumour necrosis factor downregulate EPO production
[10]. Therefore, control of EPO production in sepsis remains
unclear. These cytokines are thought to play an important role
in blunting the EPO response to anaemia during sepsis
Table 3
Haemodynamic and metabolic variables in the study population on admission
Variable Survivors (n = 31) Nonsurvivors (n = 13) P
MAP (mmHg) 58.2 ± 10 57.3 ± 12 NS
Heart rate (beats/min) 115 ± 35 120 ± 41 NS
PaO
2
/FiO
2
274 ± 116 140 ± 55 0.0005
Arterial pH 7.39 ± 0.10 7.27 ± 0.10 0.0001
Leukocyte count (cells × 103/mm3) 14 ± 11 12 ± 4.1 NS
Platelet count (cells × 10
3
/mm
3
) 167 ± 98 142 ± 86 NS
Serum bilirubin (µmol/l) 22 ± 24 50 ± 35 0.0008
Serum lactate (mmol/l) 4.5 ± 4.4 6.8 ± 4.8 NS
Values are expressed as mean ± standard deviation. MAP, mean arterial pressure; NS, not significant; PaO
2
/FiO
2
, arterial oxygen tension/
fractional inspired oxygen ratio.
Figure 1
Relationship between haemoglobin and erythropoietin (EPO) concen-trations in survivors (S) and nonsurvivors (NS)Relationship between haemoglobin and erythropoietin (EPO) concen-
trations in survivors (S) and nonsurvivors (NS).
Critical Care October 2004 Vol 8 No 5 Tamion et al.
R333
[30,31]. Our immunoassay data indicate that EPO production
is not lowered in septic shock patients, despite the inflamma-
tory response. Several studies have reported that EPO levels
are unexpectedly low in critically ill patients in relation to their
haemoglobin levels, and that could play a role in the
development of anaemia in these patients. In the present
study, serum EPO concentrations were independent of blood
haemoglobin concentration in the nonsurvivors. In contrast, in
survivors the serum EPO concentration was dependent on
blood haemoglobin concentration. The differences between
these studies may be due to the timing of blood samples taken
to determine EPO concentration.
We also demonstrated a significant correlation between
serum EPO concentration and hypoxia score (PaO
2
/FiO
2
ratio) and lactate values. However, these data do not demon-
strate a direct causal relationship between EPO concentration
and hypoxic injury in septic shock. In the absence of anaemia,
EPO is increased by tissue hypoxia induced by extreme phys-
iological conditions and during septic shock [32]. EPO syn-
thesis is subject to regulation by tissue hypoxia with negative
feedback (EPO has a blood half-life of 5 hours) when the
recovery of normal oxygen pressure occurs [33,34]. During
these extreme conditions, hypoxia also induced stress hor-
mone release [35]. In sudden infant death, increased EPO lev-
Figure 2
Receiver operating characteristic curves for (a) erythropoietin (EPO), (b) arterial pH, (c) renin and (d) lactateReceiver operating characteristic curves for (a) erythropoietin (EPO), (b) arterial pH, (c) renin and (d) lactate. The cutoff point for each parameter is
specified in the text.
Available online />R334
els suggested the presence of heavy hypoxic stress before
death [36]. Evidence of the involvement of common mecha-
nisms in controlling hypoxia, and of interleukin-6-dependent
induction of the EPO gene and of several acute-phase protein
genes has been reported [37-39]. Further studies are required
if we are to understand fully the regulation of EPO expression
by hypoxia and inflammatory mediators during septic shock.
Downregulation of adrenergic receptors (AT
1
and AT
2
), which
represents a link between the renin–angiotensin system and
angiotensin II induced adrenal catecholamine secretion, could
be responsible for the lack of endogenous catecholamines
during sepsis [40,41]. It is suggested that this downregulation
of angiotensin II receptors is the main reason for the attenu-
ated responsiveness of blood pressure to angiotensin II. Our
results demonstrate an increased renin level in all patients and
a significant relationship between EPO and plasma renin.
Plasma renin progressively decreased in survivors, but it
remained significantly elevated in the nonsurvivors on day 2. In
a recent report it was suggested that angiotensin II can
increase renal EPO production in humans [42,43]. The influ-
ence of the renin–angiotensin system on EPO production can
be blocked by specific AT
1
receptor antagonists [21]. One
signal for the control of EPO production in humans may be
mediated by angiotensin II (AT
1
) receptors. Thus, angiotensin
II may be considered an important physiological modulator of
EPO production in humans. Renin could potentially be respon-
sible for the final increase in circulating EPO in nonsurviving
patients with septic shock.
In sepsis, the endocrine, immune and nervous systems pro-
duce a multitude of biological responses. High serum EPO
and renin levels appeared to be negative prognostic indicators
in these patients. The mechanisms responsible for the final
increase in circulating EPO in critically ill patients remain
unclear. According to our findings, renin may be considered an
important mediator of EPO upregulation in patients with septic
shock. Nevertheless, further studies of the regulation and the
role played by EPO expression are warranted in patients with
septic shock.
Competing interests
None declared.
Acknowledgements
The authors thank Richard Medeiros, Rouen University Hospital Medical
Editor, for his valuable advice in editing the manuscript.
References
1. Jacobi J: Pathophysiology of sepsis. Am J Health Syst Pharm
2002, Suppl 1:S3-S8.
Table 4
Correlations of related variables with plasma levels of erythropoietin and renin on admission in patients with septic shock
Variable EPO Renin
rP r P
Serum lactate H0 (mmol/l) 0.5 <0.001 0.52 <0.001
PaO
2
/FiO
2
-0.41 <0.005 -0.24 NS
Arterial pH -0.58 <0.001 -0.33 <0.05
Leukocyte count (cells × 10
3
/mm
3
) -0.11 NS -0.003 NS
Platelet count (cells × 10
3
/mm
3
) -0.13 NS 0.02 NS
Serum bilirubin (µmol/l) 0.08 NS 0.08 NS
Serum EPO (mmol/l) 0.42 <0.005
EPO, erythropoietin; NS, not significant; PaO
2
/FiO
2
, arterial oxygen tension/fractional inspired oxygen ratio.
Table 5
Multivariate predictors of outcome to septic shock
Variable Odds ratio 95% CI P
EPO 11.8 2.7–52 0.0001
Renin 2.4 0.8–9 0.2
Arterial pH 15.95 3–74 0.0001
Lactate 3.2 0.9–11 0.07
CI, confidence interval; EPO, erythropoietin.
Key messages
• We found high levels of EPO and renin in serum to be
negative prognostic indicators in patients with septic
shock.
• The mechanisms responsible for the elevated circulat-
ing EPO levels in these critically ill patients are unclear.
• Renin may be considered an important mediator of
EPO upregulation in patients with septic shock
Critical Care October 2004 Vol 8 No 5 Tamion et al.
R335
2. Nylen ES, Alarifi AA: Humoral markers of severity and progno-
sis of critical illness. Best Pract Res Clin Endocrinol Metab
2001, 15:553-573.
3. Annane D: Resurrection of steroids for sepsis resuscitation.
Minerva Anesthesiol 2002, 68:127-131.
4. Annane D: Cortisol replacement for severe sepsis and septic
shock: what should I do? Crit Care Med 2002, 6:190-191.
5. Annane D, Sebille V, Charpentier C, Bollaert PE, François B,
Korach JM, Capellier G, Cohen Y, Azoulay E, Troche G, Chaumel-
Riffaut P, Bellissant E: Effect of treatment with low doses of
hydrocortisone and fludrocortisone on mortality in patients
with septic shock. JAMA 2002, 288:862-871.
6. Steel DM, Whitehead AS: The major acute phase reactants: C-
reactive protein, serum amyloid P component and serum amy-
loid A protein. Immunol Today 1994, 15:81-88.
7. Da-Silva O, Ohlsson A, Kenyon C: Accuracy of leukocyte indices
and C-reactive protein for diagnosis of neonatal sepsis: a crit-
ical review. Pediatr Infect Dis J 1995, 14:362-366.
8. Povoa P: C-reactive protein: a valuable marker of sepsis. Inten-
sive Care Med 2002, 28:235-243.
9. Zhu Y, D-Andrea AD: The molecular physiology of erythropoie-
tin and the erythropoietin receptor. Curr Opin Hematol 1994,
1:113-118.
10. Jelkmann W, Hellwig-Burgel T: Biology of erythropoietin. Adv
Exp Med Biol 2001, 502:169-187.
11. Kendall RG: Erythropoietin. Clin Lab Haematol 2001, 23:71-80.
12. Fisher JW, Nakashima J: The role of hypoxia in renal production
of erythropoietin. Cancer 1992, Suppl 4:928-939.
13. Samaja M: Hypoxia-dependent protein expression:
erythropoietin. High Alt Med Biol 2001, 2:155-163.
14. Wang GL, Semenza GL: Molecular basis of hypoxia-induced
erythropoietin expression. Curr Opin Hematol 1996,
3:156-162.
15. Corwin HL: Anemia in the critically ill: the role of erythropoietin.
Semin Hematol 2001, Suppl 7:24-32.
16. Abel J, Spannbrucker N, Fandrey J, Jelkmann W: Serum erythro-
poietin levels in patients with sepsis and septic shock. Eur J
Haematol 1996, 57:359-363.
17. Krafte_Jacobs B, Levetown ML, Bray GL, Ruttimann VE, Pollack
MM: Erythropoietin response to critical illness. Crit Care Med
1994, 22:821-826.
18. Freudenthaler SM, Schreeb K, Korner T, Gleiter CH: Angiotensin
II increases erythropoietin production in healthy human
volunteers. Eur J Clin Invest 1999, 29:816-823.
19. Skott O: Renin. Am J Physiol Regul Integr Comp Physiol 2002,
282:R937-R939.
20. Unger T: The role of the renin–angiotensin system in the devel-
opment of cardiovascular disease. Am J Cardiol 2002,
89:3A-9A.
21. Freudenthaler SM, Lucht I, Schenk T, Brink M, Gleiter CH: Dose-
dependent effect of angiotensin II on human erythropoietin
production. Pflugers Arch 2000, 439:838-844.
22. Marshal JC, Cook JB, Christou NV, Bernard GR, Sprung CL, Sib-
bald WJ: Multiple Organ Dysfunction Score: a reliable descrip-
tor of a complex clinical outcome. Crit Care Med 1995,
23:1638-1652.
23. Krafte-Jacobs B, Bock GH: Circulating erythropoietin and inter-
leukin-6 concentrations increase in critically ill children with
sepsis and septic shock. Crit Care Med 1996, 24:1455-1459.
24. Yoshimura A, Misawa H: Physiology and function of the erythro-
poietin receptor. Curr Opin Hematol 1998, 5:171-176.
25. Porter DL, Goldberg MA: Physiology of erythropoietin
production. Semin Hematol 1994, 31:112-121.
26. Tong EM, Nissenson AR: Erythropoietin and anemia. Semin
Nephrol 2001, 21:190-203.
27. Jelkmann W: Erythropoietin: structure, control of production,
and function. Physiol Rev 1992, 72:449-489.
28. Faquin WC, Schneider TJ, Goldberg MA: Effect of inflammatory
cytokines on hypoxia-induced erythropoietin production.
Blood 1992, 79:1987-1994.
29. Faquin WC, Schneider TJ, Goldberg MA: Modulators of protein
kinase C inhibit hypoxia-induced erythropoietin production.
Exp Hematol 1993, 21:420-426.
30. Krafte-Jacobs B: Anemia of critical illness and erythropoietin
deficiency. Intensive Care Med 1997, 23:137-138.
31. Rodriguez RM, Corwin HL, Gettinger A, Corwin MJ, Guber D,
Pearl RG: Nutritional deficiencies and blunted erythropoietin
response as causes of the anemia of critical illness. J Crit Care
2001, 16:36-41.
32. Lacombe C, Mayeux P, Casadevall N: Overview of
erythropoietin. Nephrologie 1991, 12:221-226.
33. Lacombe C, Da Silva JL, Bruneval P, Casadevall N, Camilleri JP,
Bariety J, Tambourin P, Varet B: Erythropoietin: sites of synthe-
sis and regulation of secretion. Am J Kidney Dis 1991, Suppl
1:14-19.
34. Varet B, Casadevall N, Lacombe C, Nayeaux P: Erythropoietin:
physiology and clinical experience. Semin Hematol 1990,
Suppl 3:25-31.
35. Schwandt HJ, Heyduck B, Gunga HC, Rocker L: Influence of pro-
longed physical exercise on the erythropoietin concentration
in blood. Eur J Appl Physiol 1991, 63:463-466.
36. Le Cam-Duchez V, Coquerel A, Chevallier F, Vaz E, Menard J, Bar-
ret C, Lahary A, Vannier JP: Erythropoietin blood level is
increased in sudden infant death. Biol Neonate 1999, 76:1-9.
37. Fandrey J, Frede S, Jelkmann W: Role of hydrogen peroxide in
hypoxia-induced erythropoietin production. Biochem J 1994,
303:507-510.
38. Wanner RM, Spielmann P, Stroka DM, Camenish G, Camenish I,
Scheid P, Hoch DR, Bauer C, Ganmann M, Wenger RH: Epolo-
nes induce erythropoietin expression via hypoxia-inducible
factor-1 alpha activation. Blood 2000, 96:1558-1565.
39. Wenger RH, Kvietikova I, Rolfs A, Camenish G, Ganmann M: Oxy-
gen-regulated erythropoietin gene expression is dependent
on a CpG methylation-free hypoxia-inducible factor-1 DNA-
binding site. Eur J Biochem 1998, 253:771-777.
40. Bucher M, Hobbhahn J, Kurtz A: Nitric oxide-dependent down-
regulation of angiotensin II type 2 receptors during experi-
mental sepsis. Crit Care Med 2001, 29:1750-1755.
41. Bucher M, Ittner KP, Hobbhahn J, Taeger K, Kurtz A: Downregu-
lation of angiotensin II type 1 receptors during sepsis. Hyper-
tension 2001, 38:177-182.
42. Hayashi K, Hasegawa K, Kobayashi S: Effects of angiotensin-
converting enzyme inhibitors on the treatment of anemia with
erythropoietin. Kidney Int 2001, 60:1910-1916.
43. Gossmann J, Burkhardt R, Harder S, Lenz T, Sedlmeyer A,
Klinkhardt U, Geiger H, Scheuermann EH: Angiotensin II infusion
increases plasma erythropoietin levels via an angiotensin II
type 1 receptor-dependent pathway. Kidney Int 2001, 60:83-86.