Báo cáo y học: "Saline volume expansion and cardiovascular physiology: novel observations, old explanations, and new questions" pps
Bạn đang xem bản rút gọn của tài liệu. Xem và tải ngay bản đầy đủ của tài liệu tại đây (44.32 KB, 4 trang )
315
CO = cardiac output; Ea = maximal arterial systolic elastance; EDV = end-diastolic volume; EF = ejection fraction; Emax = maximal ventricular sys-
tolic elastance; ESV = end-systolic volume; LV = left ventricular; Pes = end-systolic pressure; RV = right ventricular; SV = stroke volume; Vo = zero
Pes intercept of Emax from a pressure–volume diagram.
Available online />The article by Kumar and coworkers [1] is one of a series of
three papers [2,3] by the authors addressing the acute
hemodynamic events that accompany plasma volume
expansion over 3–5 hours in healthy young adult volunteers.
Taking into account all three reports, the most interesting
finding is that increases in stroke volume (SV) following
saline infusion over 3 hours may be variably related to
increases in left ventricular (LV) end-diastolic volume (EDV)
and/or decreases in LV end-systolic volume (ESV). The
second interesting finding, from one of the reports [3],
Commentary
Saline volume expansion and cardiovascular physiology: novel
observations, old explanations, and new questions
James L Robotham
Professor and Chairman, Department of Anesthesiology, University of Rochester, Rochester, New York, USA
Corresponding author: James L Robotham,
Published online: 1 September 2004 Critical Care 2004, 8:315-318 (DOI 10.1186/cc2944)
This article is online at />© 2004 BioMed Central Ltd
Related to Research by Kumar et al., see issue 8.3, page 201
Abstract
In a clinical investigation, Kumar and coworkers reported the hemodynamic events that accompany
plasma volume expansion over 3 hours in healthy adult volunteers, and found that increases in stroke
volume (SV) may be related to increases in left ventricular (LV)/right ventricular (RV) end-diastolic
volume, as they expected, but also to decreases in LV/RV end-systolic volume. The latter finding
suggests increased contractility and/or decreased afterload, which do not fit with their perception
that clinicians ascribe increases in SV to increases in end-diastolic volume based on Starling’s work.
Increased ejection fraction and decreased vascular resistances were also observed. The same
authors recently reported novel data suggesting that reduced blood viscosity may account for the
observed reduction in vascular resistances with saline volume expansion. However, the variances in
preload and afterload, along with uncertainty in estimates of contractility, substantially limit their ability
to define a primary mechanism to explain decreases in LV end-systolic volume. A focus on using
ejection fraction to evaluate the integrated performance of the cardiovascular system is provided to
broaden this analytic perspective. Sagawa and colleagues described an approach to estimate the
relationship, under clinical conditions, between ventricular and arterial bed elastances (i.e. maximal
ventricular systolic elastance [Emax] and maximal arterial systolic elastance [Ea]), reflecting
ventricular–arterial coupling. I used the mean data provided in one of the reports from Kumar and
coworkers to calculate that LV Emax decreased from 1.09 to 0.96 mmHg/ml with saline volume
expansion, while Ea decreased from 1.1 to 0.97 mmHg/ml and the SV increased (i.e. the increase in
mean SV was associated with a decrease in mean afterload while the mean contractility decreased).
The results reported by Kumar and coworkers invite further studies in normal and critically ill patients
during acute saline-induced plasma volume expansion and hemodilution. If reduced viscosity
decreases afterload, then this raises the questions by what mechanism, and what is the balance of
benefit and harm associated with reduced blood viscosity affecting oxygen delivery? Why the mean
Emax might decrease must be evaluated with respect to benefit in reducing ventricular work or a
negative inotropic effect of saline.
Keywords afterload, cardiovascular physiology, contactility, hemodynamics, preload, ventricular function
316
Critical Care October 2004 Vol 8 No 5 Robotham
involves novel data suggesting that the acute dilution by
reducing blood viscosity may account for a substantial
proportion of the reduction in vascular resistance in the
systemic and pulmonary arterial beds, which was consistently
observed at 3 hours, but diminished after the infusion was
stopped and normal viscosity re-established. The authors did
not investigate possible endothelial mechano-transduction
mechanisms, or determine whether the reduction in systemic
venous resistance that accompanied this decrease in
viscosity might alter the time constant for venous return, thus
enhancing cardiac output (CO).
The fundamental findings (albeit with substantial variability
among the individuals studied) were that 3 l of saline infused
over 3 hours increases the LVEDV, RVEDV, CO, SV and
ejection fraction (EF), whereas the LVESV, and systemic and
pulmonary vascular resistances decreased. Consistent with
many previous reports, changes in RVEDV and LVEDV did
not consistently correlate with changes in ventricular end-
diastolic pressures [2], but the unexpectedly high central
venous and pulmonary capillary wedge pressures reported
[1–3] are consistent with and account for this finding [4].
Multiple measures of LV contractility, which are to varying
degrees load dependent, suggest no change or an increase
in ventricular contractile function. However, the variances in
preload and afterload, along with the uncertainty in estimates
of contractility, substantially limit the ability of the authors to
draw any conclusions with respect to a primary mechanism
underlying the decreases in LVESV.
My comments focus on the Frank–Starling mechanism, which
the authors use as the basis for their argument that clinicians
have incorrectly assumed that increases in SV and CO with
plasma volume expansion were determined by an increase in
the LVEDV. An a priori physiologic analysis of an increase in
plasma volume may place the argument in a broader
perspective. Otto Frank, in 1899, reported the first
experimentally derived ventricular pressure–volume diagrams,
emphasizing that the end-systolic pressure and volume are
determined by events that occur in the immediately
preceding cardiac cycle. Starling never plotted a
pressure–volume relationship based on raw experimental
data, although one of his students did [5]. Starling did plot:
an end-systolic and end-diastolic isovolumic
pressure–volume relationship from Frank’s work; CO against
mean right atrial pressure; and external work against EDV [5].
Starling’s ‘Law of the Heart’ is frequently misunderstood in
interpreting Starling’s use of mean right atrial pressure as
preload. Preload is now more accurately defined as the
ventricular EDV. Thus, using relatively healthy isolated hearts
with ability to control the mean arterial pressure, Starling
found a strong correlation between the mean right atrial
pressure and the SV, with small changes in afterload and
heart rate being relatively unimportant. He did postulate that
a larger ventricular volume permitted a larger chemically
active surface to be exposed, hence increasing the force and
thus the SV, when the afterload was maintained relatively
constant by experimental means.
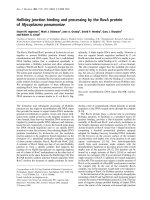
Indeed, years later Sagawa and coworkers [5], using
computer controlled isolated ventricles, demonstrated that
the end-systolic pressure–volume relationship (Pes–ESV)
was a straight line, reflecting the maximum ventricular systolic
elastance (Emax) of the ventricle. Emax served as a load
independent measure of contractility; as the EDV increased,
both ESV and the SV would increase (Fig. 1). The degree to
which the ESV and SV changed with increasing EDV could
be altered by changing the afterload (or more precisely the
impedance, incorporating arterial vascular resistance,
compliance, and inertance) or contractility. Experimentally,
with contractility constant while acutely increasing EDV, one
could first reduce afterload to an extremely low value and
then progressively increase the afterload to limit ejection.
This would yield serial results showing the following: first a
decreased ESV and increased SV; then an increased ∆SV =
increased ∆EDV; and finally an increased ESV = EDV with
SV = 0 when the afterload is sufficient to prevent ejection.
If one uses atrial pressure as a measure of preload (as did
Starling), then the diastolic compliance of the ventricle would
define the volume change, with pericardial constraint (when
present) becoming the dominant factor defining the shape of
the diastolic pressure–volume relationship [4,6,7]. Only by
instantaneously controlling very precisely the vascular input
impedance (afterload) and contractility during a single
cardiac cycle will the increase in EDV equal the increase in
SV [5]. To be noted in passing, radionuclide cineangiography
findings in one of the reports from Kumar and coworkers [2]
showed a statistically significant increase of 10% (8 ml) in
LVEDV and RVEDV with acute volume loading, and a
reasonable correlation of ∆SV respectively with ∆RVEDV and
∆LVEDV. The decrease in ESV in both ventricles was only
2 ml, and four out of 12 individuals exhibited decreases in
RVEDV with volume loading. These findings suggest that
ventricular interdependence is not a dominant factor among
the physiologic mechanisms. However, the unexpected
finding in most of these studies was that the average central
venous pressure was approximately 9.5 mmHg at baseline in
supine individuals who had been NPO overnight, and
increased to an average of 12.5 mmHg, while pulmonary
capillary wedge pressure was 10 mmHg at baseline and
increased on average to 15 mmHg. This strongly suggests
either that the zero calibration position was problematic or
that the individuals’ control states were moderately
hypervolemic, further limiting extrapolation of the results to
hypovolemic patients.
Perhaps the easiest way to evaluate the clinical implications
of acute plasma volume loading in these studies is to
consider the EF. This parameter is widely used, incorrectly by
most, as a measure of ventricular function [8]. It is rather a
fascinating parameter that integrates contractility, preload,
317
afterload, and Vo (the zero pressure intercept of the end-
systolic pressure–volume relationship). If preload, afterload,
and Vo are all maintained constant, then a change in EF is a
measure of ventricular contractility. However, mathematically,
EF will increase if either EDV or Vo increase because of the
following relationship:
EF = ([EDV – ESV]/EDV) – Vo/EDV
This equation can be rewritten as follows:
EF = 1 – (Pes/EDV)(1/Emax) – (Vo/EDV)
Note that EF reflects the influences of preload (EDV),
afterload (Pes), Vo (increases associated clinically with heart
failure), and contractility (Emax). Thus, changes in any or all of
the physiologic parameters that define EF can result in a
myriad of combinations that preclude use of EF as a definitive
measure of change in any one of them under clinical
conditions. Indeed, the widespread application of EF as a
clinical tool is precisely because it integrates all of these
parameters into a single number that reflects the overall
clinical state of the coupled ventricular–arterial systems [8].
However, it is clear that a decreased afterload and/or
increased contractility must be present in the reports from
Kumar and coworkers [1–3] for the LVESV to decrease and
for SV and CO to increase.
Perhaps the most useful insight into use of EF from the
reports from Kumar and coworkers is as follows; if EF
remains relatively constant, even accepting a slight increase
due to the mathematical consequence of increasing EDV,
then the distribution of this increase will be proportional to EF
(i.e. if EF = 0.6, then 60% of the increase in EDV will equal
the increase in SV). Thus, one would predict increases in
EDV, ESV, and SV. At the two extremes, if EF = 0.9 and the
EDV increases 10 ml, then 9 ml will added to the SV and
1 ml to the ESV. Conversely, if EF = 0.1 and the EDV
increases 10 ml, then 1 ml will be added to the SV and 9 ml
to the ESV, assuming constant afterload and contractility.
This raises the serious question as to whether one can
generalize the findings of volume expansion in healthy
volunteers to seriously ill patients who are variably
hypovolumic and vasoconstricted, or septic and vasodilated
with impaired contractility, given the variance in baseline
conditions existing in myocardial and endothelial function as
regulated by neural and humoral factors in addition to
administered pharmaceutical agents in such patients. To my
knowledge, the degree to which a change in viscosity would
further affect afterload or venous return, when the
mechanoreceptor function of the endothelium is markedly
altered during an inflammatory state, has not been studied in
the clinical setting.
Returning to the results of the three reports from Kumar and
coworkers [1–3], including the one published in this journal,
the critical question that remains unanswered is the primary
mechanism that would explain a decrease in ESV that
appears transiently during the time of maximum volume
expansion and hemodilution with saline. The authors focus on
increased EF, and in one report [3] measures of Pes/LVESV
suggest that contractility has increased, although multiple
other estimates of contractility exhibit no change. Overall,
however, the largest consistent changes that they observe
are increases in SV and CO with decreases in pulmonary
and systemic vascular resistances. Although in many
individuals preload increases would appear to account for
much of the increase in SV, given little change in contractility
and a decreased afterload, the series of reports lacks a
rigorous evaluation to address the key questions directly.
It would seem possible that the authors and others who
might replicate this study in normal or critically ill patients
should turn to the classic book by Sagawa and coworkers
published in 1988 [5]. Chapter 5 in that book describes a
relatively straightforward approach to estimating the
relationship under clinical conditions between ventricular and
arterial bed elastances (i.e. Emax and Ea, reflecting
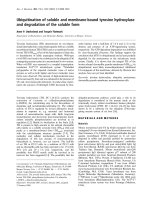
ventricular–arterial coupling). Briefly, by plotting Emax and Ea
with Pes versus SV on pressure–volume axes, the two
straight lines – one with a negative slope and the other with a
positive slope – must intersect at the point where a common
Pes and SV occur (Fig. 2). I used mean data provided in a
prior report from Kumar and coworkers [3] that allow this to
be done. The results were that LV Emax decreased from 1.09
to 0.96 mmHg/ml with saline volume expansion, while Ea
decreased from 1.1 to 0.97 mmHg/ml and the SV increased.
Thus, in that cohort of 32 male volunteers in whom there was
a statistically significant decrease in systemic vascular arterial
resistance, the mean results are consistent with a decrease
Available online />Figure 1
A simplified schematic of a single ventricular pressure–volume loop.
EDV, end-diastolic volume; Emax, maximal ventricular systolic
elastance; ESV, end-systolic volume; Pes, end-systolic pressure; Vo,
zero Pes intercept of Emax from a pressure–volume diagram.
Pes
Volume
Vo
Emax
ESV EDV
318
in systemic afterload rather than an increase in contractility
accounting for the increase in SV and decrease in ESV. Any
statistical significance of this analysis is of course lacking
until the authors derive Emax and Ea for each individual
before and after volume expansion, and then perform a
complete statistical analysis on all of the data.
Bringing this all back to the clinical application of EF [8], the
relationship between Emax and Ea can be derived as follows:
EF = (Emax/[Emax + Ea])(1 – Vo/EDV)
This restates the conclusion that EF is an effective clinical
measure because it provides a single number that is sensitive
to changes in ventricular function, arterial impedance, and the
poorly understood Vo relative to EDV.
In conclusion, the findings presented by Kumar and
coworkers invite further studies in normal and critically ill
patients during acute saline induced plasma volume
expansion or hemodilution. Starling’s Law was derived under
highly controlled experimental circumstances, such that
assumptions that volume expansion should increase SV by
increases in preload alone in a clinical setting requires
consideration of a far more complex (patho)physiological
analysis. If Kumar and coworkers suggested mechanism of
transient lowering of viscosity is correct, then this would
explain a dominant role of reducing afterload on both right
and left ventricles. It would also raise questions regarding the
mechanism that is responsible and regarding the balance of
benefit and harm associated with reduced blood viscosity
affecting oxygen delivery. Why the mean Emax might
decrease must be evaluated with respect to likely benefit in
reducing ventricular work and oxygen consumption, or
reflecting a negative inotropic effect of saline that is masked
by the reduced afterload effect. Furthermore, the possible
role played by reduced viscosity in the resistance to venous
return could be a logical additional consequence if the same
occurs on the arterial side. The door is open for clinicians to
explore these temporal physiologic observations and many
other related questions safely in a wide variety of normal and
pathologic conditions.
Competing interests
The author declares that he has no competing interests.
References
1. Kumar A, Anel R, Bunnell E, Zanotti S, Habet K, Haery C, Marshall
S, Cheang M, Neumann A, Ali A, et al.: Preload-independent
mechanisms contribute to increased stroke volume following
large volume saline infusion in normal volunteers: a prospec-
tive interventional study. Crit Care 2004, 8:R128-R136.
2. Kumar A, Anel R, Bunnell E, Habet K, Zanotti S, Marshall S,
Neumann A, Ali A, Cheang M, Kavinsky C, et al.: Pulmonary
artery occlusion pressure and central venous pressure fail to
predict ventricular filling volume, cardiac performance, or the
response to volume infusion in normal subjects. Crit Care
Med 2004, 32:691-699.
3. Kumar A, Anel R, Bunnell E, Habet K, Neumann A, Wolff D,
Rosenson R, Cheang M, Parrillo JE: Effect of large volume infu-
sion on left ventricular volumes, performance and contractility
parameters in normal volunteers. Intensive Care Med 2004,
30:1361-1369.
4. Hamilton DR, Dani RS, Semlacher RA, Smith ER, Kieser TM,
Tyberg JV: Effects of aortic constriction during experimental
acute right ventricular pressure loading. Further insights into
diastolic and systolic ventricular interaction. Circulation 1995,
92:546-554.
5. Sagawa K, Maughan L, Suga H, Sunagawa K: Cardiac Contrac-
tion and the Pressure–Volume Relationship. Oxford: Oxford
Press; 1988:3-41.
6. Takata M, Mitzner W, Robotham JL: Influence of the peri-
cardium on ventricular loading during respiration. J Appl
Physiol 1990, 68:1640-1650.
7. Takata M, Robotham JL: Ventricular external constraint by the
lung and pericardium during positive end-expiratory pressure.
Am Rev Respir Dis 1991, 143:872-875.
8. Robotham JL, Takata M, Berman M, Harasawa Y: Ejection frac-
tion revisited. Anesthesiology 1991, 74:172-183.
Critical Care October 2004 Vol 8 No 5 Robotham
Figure 2
A simplified schematic of the relationship between Emax (maximal
ventricular systolic elastance) and Ea (maximal arterial systolic
elastance) with the intersection, defining the resulting stroke volume.
Pes, end-systolic pressure.
Pes
Stroke Volume
Emax
Ea