Báo cáo y học: "The effect of interruption to propofol sedation on auditory event-related potentials and electroencephalogram in intensive care patients" pps
Bạn đang xem bản rút gọn của tài liệu. Xem và tải ngay bản đầy đủ của tài liệu tại đây (552.09 KB, 8 trang )
Open Access
Available online />R483
December 200 4 Vol 8 No 6
Research
The effect of interruption to propofol sedation on auditory
event-related potentials and electroencephalogram in intensive
care patients
Heidi Yppärilä
1
, Silvia Nunes
2
, Ilkka Korhonen
3
, Juhani Partanen
4
and Esko Ruokonen
5
1
Department of Clinical Neurophysiology, Kuopio University Hospital, and Department of Applied Physics, University of Kuopio, Kuopio, Finland
2
Department of Anesthesiology and Intensive Care, Division of Intensive Care, Kuopio University Hospital, Kuopio, Finland
3
Professor, VTT Information Technology, Tampere, Finland
4
Professor, Department of Clinical Neurophysiology, Kuopio University Hospital, Kuopio, Finland
5
Department of Anesthesiology and Intensive Care, Division of Intensive Care, Kuopio University Hospital, Kuopio, Finland
Corresponding author: Heidi Yppärilä,
Abstract
Introduction In this observational pilot study we evaluated the electroencephalogram (EEG) and
auditory event-related potentials (ERPs) before and after discontinuation of propofol sedation in
neurologically intact intensive care patients.
Methods Nineteen intensive care unit patients received a propofol infusion in accordance with a
sedation protocol. The EEG signal and the ERPs were measured at the frontal region (Fz) and central
region (Cz), both during propofol sedation and after cessation of infusion when the sedative effects had
subsided. The EEG signal was subjected to power spectral estimation, and the total root mean squared
power and spectral edge frequency 95% were computed. For ERPs, we used an oddball paradigm to
obtain the N100 and the mismatch negativity components.
Results Despite considerable individual variability, the root mean squared power at Cz and Fz (P =
0.004 and P = 0.005, respectively) and the amplitude of the N100 component in response to the
standard stimulus at Fz (P = 0.022) increased significantly after interruption to sedation. The amplitude
of the N100 component (at Cz and Fz) was the only parameter that differed between sedation levels
during propofol sedation (deep versus moderate versus light sedation: P = 0.016 and P = 0.008 for
Cz and Fz, respectively). None of the computed parameters correlated with duration of propofol
infusion.
Conclusion Our findings suggest that use of ERPs, especially the N100 potential, may help to
differentiate between levels of sedation. Thus, they may represent a useful complement to clinical
sedation scales in the monitoring of sedation status over time in a heterogeneous group of
neurologically intact intensive care patients.
Keywords: electroencephalogram, event-related potentials, intensive care, propofol, sedation
Introduction
The majority of mechanically ventilated patients in the intensive
care unit (ICU) require sedation to reduce their anxiety and to
increase their tolerance of the tracheal tube and mechanical
ventilation. The choice of sedative drugs and the way in which
they are administered may have an important impact on patient
outcome and cost of care [1]. Excessively deep sedation will
prolong ventilator dependence and length of stay in the ICU,
Received: 19 May 2004
Revisions requested: 23 August 2004
Revisions received: 7 September 2004
Accepted: 23 September 2004
Published: 22 October 2004
Critical Care 2004, 8:R483-R490 (DOI 10.1186/cc2984)
This article is online at: />© 2004 Yppärilä et al., licensee BioMed Central Ltd.
This is an Open Access article distributed under the terms of the
Creative Commons Attribution License ( />licenses/by/2.0), which permits unrestricted use, distribution, and
reproduction in any medium, provided the original work is cited.
AEP = auditory evoked potential; Cz = central region; EEG = electroencephalogram; ERP = event-related potential; Fz = frontal region; ICU = inten-
sive care unit; MMN = mismatch negativity; RMS = root mean squared; SAS = sedation–agitation scale; SEF95 = spectral edge frequency 95%.
Critical Care December 2004 Vol 8 No 6 Yppärilä et al.
R484
which can be avoided by careful monitoring and interruption to
sedative infusions [2]. Differentiation between adequate com-
fort and excessive sedation requires the use of clinically rele-
vant sedation scales; however, these are not suitable for
application during deep sedation or muscle relaxation. Other
methods to assess the level of sedation in the clinical setting
are therefore needed.
Growing knowledge of the depressive effects of sedative
drugs on the central nervous system has led to increasing
interest in a possible correlation between neurophysiological
indices and the level of sedation. The most commonly used
neurophysiological indices in the assessment of sedation are
electroencephalogram (EEG) and auditory evoked potentials
(AEPs), which measure different aspects of brain functioning.
The evoked potentials show whether the central nervous sys-
tem responds systematically to an auditory stimulus, and they
may thus be considered a direct measure of the responsive-
ness of the brain. In contrast, the EEG signal, if not associated
with a sensory stimulus, will only reflect the ongoing back-
ground electrical activity of the brain. In other words, if the
patient is not stimulated and the level of sedation is measured
using indices derived from the EEG signal, then it can be spec-
ulated that those indices may only be used as predictors of
whether the patient will actually react to a given stimulus, but
they provide no measure of responsiveness. AEPs may there-
fore provide a more accurate tool with which to assess the
level of sedation.
Within the AEPs, the middle-latency AEPs (10–50 ms after
the stimulus) are mainly evoked by the physical features of the
auditory stimulus. Their presence establishes the integrity of
the afferent auditory pathway and confirms that basic auditory
signal processing is taking place in the primary auditory cortex
(Fig. 1a). The long-latency AEPs, or event-related potentials
(ERPs; >50 ms after the stimulus), result from deeper
processing of the auditory stimulus and are generated by
areas of cortex at and beyond the primary projection area.
ERPs may therefore be better indicators of the effect of seda-
tive drugs on the mental state than are middle-latency AEPs.
The most prominent ERP component is N100, which appears
about 100 ms after the onset of stimulus and reflects the
simultaneous activation of several different brain regions, indi-
cating detection of a change in acoustic surroundings (Fig.
1b) [3]. Another ERP component, namely mismatch negativity
(MMN), is elicited by infrequently presented stimuli that differ
in some physical dimension from the standard stimuli and
reflects the brain's automatic auditory change detection mech-
anism, which depends on the integrity of auditory sensory
memory (Fig. 1c) [4]. Appearance of MMN indicates that sev-
eral brain regions are activated simultaneously. The fact that
MMN reflects widespread brain activation may explain why
sedative drug induced changes in the MMN have been shown
to be a better marker of mental state than are the respective
changes in the middle-latency AEPs [5].
ERPs have exhibited graded changes with increasing doses of
sedative drugs in volunteers and surgical patients [6,7], but to
date only few data are available concerning the use of ERPs
for monitoring sedation level in the ICU. Despite the known
superiority of ERP parameters over EEG parameters for mon-
itoring sedation level, in this preliminary pilot study we hypoth-
esized that both ERPs and EEG may be used to assess the
level of sedation in a heterogeneous group of neurologically
intact intensive care patients.
Methods
The study protocol was approved by the local ethical commit-
tee and written informed consent was obtained from each
patient or from the next of kin.
We measured EEG and ERPs in a heterogeneous group (n =
19; 13 males and six females; age 65 ± 11 years) of mechan-
ically ventilated patients presenting with a range of surgical
and medical conditions requiring intensive care but with no
known organic brain dysfunction (Table 1). Patients who were
known to have impaired hearing were excluded from the study.
Sedation was administered following the modified Brook pro-
tocol [1]. Repeated midazolam boluses were initially used to
induce and maintain sedation. If the obtained sedation level
was still considered inadequate, then propofol infusion was
begun and midazolam administration discontinued. The opti-
mal depth of sedation for each patient was determined on clin-
ical grounds, independent of the study, and was assessed
using the sedation–agitation scale (SAS; Table 2) [8].
At the time of the first EEG and ERP recordings, patients were
receiving propofol sedation (infusion rate 1.91 ± 0.88 mg/kg
per hour) and the duration of the infusion had exceeded 8
hours in all patients (31 ± 29 hours). Discontinuation of seda-
tion was then considered necessary so that the patients could
be weaned from the ventilator or so that their neurological sta-
tus could be evaluated. Propofol infusion was interrupted, and
the measurements were repeated once the sedation had sub-
sided and the patients were able to follow commands (i.e. to
open their eyes and squeeze their hand). Apart from propofol,
no sedative drugs other than opioids were allowed during the
8 hours preceding the measurements or during the study
period (Table 1).
Electroencephalogram and event-related potential
recording
The EEG signal was recorded using Ag/AgCl electrodes
placed on the scalp according to the international 10–20 sys-
tem. Two electrode locations (frontal [Fz] and central [Cz])
were used. Both electrodes were referred to the right mastoid,
and the electrode–skin impedances were kept below 5 kΩ.
The EEG signal was amplified and digitized continuously at
Available online />R485
279 Hz using EMMA (ERP measuring machine; developed
and custom-made in the Department of Clinical Neurophysiol-
ogy, Kuopio University Hospital, Kuopio, Finland).
Background EEG was recorded for 5 min during sleep and/or
while the patients lay motionless with their eyes closed. Audi-
tory stimulation was then set to 'on' so that ERPs could be
recorded. The stimulation was applied according to an oddball
paradigm, which consisted of 85% standard (800 Hz) and
15% deviant (560 Hz) stimuli, with an interstimulus interval of
1 s. The duration of each stimulus was 84 ms, including 7 ms
rise and fall times. Altogether 600 stimuli were delivered
through earphones to the right ear for each measurement, cor-
responding to a recording time of about 10 min. The stimulus
intensity was set at 75 dB.
Electroencephalogram analysis
The background EEG, measured before auditory stimulation,
was band pass filtered using a finite impulse response-type fil-
ter employing cutoff frequencies of 0.5 and 32 Hz (Matlab, ver-
sion 6.12; The Mathworks Inc., Natick, MA, USA). Then, the
filtered EEG signal (5 min long) was cut into 5 s epochs with
50% overlap. Serious artifacts were excluded by checking the
maximum amplitude for each epoch; if the amplitude was
greater than 100 µV then the epoch was excluded. The appro-
priateness of artifact rejection was manually confirmed.
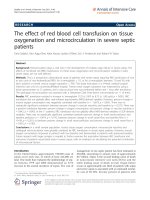
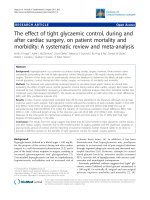
Figure 1
(a) The middle-latency auditory evoked potential (MLAEP) components Na, Pa, and Nb appear 10–50 ms after the onset of auditory stimulus(a) The middle-latency auditory evoked potential (MLAEP) components Na, Pa, and Nb appear 10–50 ms after the onset of auditory stimulus. (b)
N100 is the most prominent event-related potential (ERP) component. The thick line is the N100 for standard stimuli (N100 S) and the thin line is the
N100 for deviant stimuli (N100 D). (c) The mismatch negativity (MMN) curve is obtained as a difference curve N100 D–N100 S. The MMN is the
negative area under the curve between 100 and 250 ms.
Critical Care December 2004 Vol 8 No 6 Yppärilä et al.
R486
For each EEG epoch, first the root mean squared (RMS) total
power was calculated. Then, the epoch was subjected to
power spectral density estimation, using Welsh's averaged
periodogram method [9], and the spectral edge frequency
95% (SEF95) was computed from the power spectral density
using a frequency range of 0.5–32 Hz. The mean of the RMS
and SEF95 values of the accepted epochs were then individ-
ually computed.
Event-related potential analysis
The EEG signal recorded during the auditory stimulation was
first filtered using a finite impulse response-type filter using
cutoff frequencies of 1 and 20 Hz, and then transformed to
epochs from -100 ms to +900 ms relative to the onset of each
stimulus. After removing artifactual epochs (rejection level ±
100 µV), the individual responses to standard and deviant
stimuli were averaged. The N100 component was defined as
a maximum negative deflection appearing 80–150 ms from
the stimulus onset. The amplitude and the latency of the prom-
inent N100 components in response to standard stimuli were
manually scored with respect to the pre-stimulus baseline. The
MMN was obtained by subtracting first the waveform elicited
by the standard stimuli from the one resulting from the deviant
stimuli. The MMN was then computed from the difference
curve (deviant standard) as the mean amplitude between 100
and 250 ms [10].
Table 1
Demographic data, duration and rate of propofol infusion at the time of measurements
Patient
number/sex
Age (years) Length (cm) Weight (kg) Diagnosis Propofol infusion
a
(mg/kg per hour)
Duration of
infusion
b
(hours)
Opioids
c
1/M 59 180 86 Thoracic aorta dissection 1.63 31 Oxycodon 10 mg
2/M 53 180 130 Acute myocardial infarction 0.62 11 Fentanyl 0.100 mg/
hour
3/M 47 173 68 Pneumonia and sepsis
(streptococcal pneumonia)
1.18 13 Oxycodon 3 mg
4/F 47 170 68 Multitrauma (renal rupture, pelvic
fracture)
1.76 20 Oxycodon 10 mg
5/M 61 169 96 Ruptured abdominal aortic
aneurysm
2.08 19 Fentanyl 0.100 mg/
hour
6/M 76 174 73 Acute myocardial infarction and
peritonitis
2.47 66 Fentanyl 0.100 mg/
hour
7/F 72 160 70 Acute lung injury and status
post-AVR+CABG
1.71 10 Oxycodon 5 mg
8/M 66 176 90 Acute lung injury and status
post-CABG
4.44 46 Fentanyl 0.150 mg/
hour
9/M 68 162 79 Wound infection post-CABG 3.04 112 Oxycodon 35 mg
10/M 64 164 65 Peritonitis and septic shock 1.85 13 Fentanyl 0.200 mg
11/F 70 162 89 Acute myocarial infarction and
status post-CABG
0.67 16 Oxacodon 5 mg
12/M 83 167 65 Peritonitis 2.15 19 Fentanyl 0.075 mg
13/M 72 176 96 Sternal dehiscence post-CABG 1.46 14 Oxycodon 36 mg
14/M 76 183 77 Acute myocarial infarction and
pulmonary haemorrhage
1.04 18 Oxycodon 10 mg
15/F 71 162 58 Wound infection post-
CABG+AVR
1.72 19 Fentanyl 0.150 mg,
oxycodon 29 mg
16/M 77 167 73 Acute respiratory distress
syndrome
2.74 69 Fentanyl 0.825 mg,
oxycodon 15 mg
17/F 50 170 75 Low cardiac output (status post-
CABG)
1.60 86 Fentanyl 0.150 mg/
hour
18/F 59 165 60 Acute lung injury and septic
shock
1.67 12 Oxycodon 3 mg
19/M 71 170 80 Acute myocarial infarction and
pulmonary oedema
1.50 14 Oxycodon 18 mg
Mean 65 170 79 - 1.91 31 -
SD 11 7 16 - 0.88 29 -
a
Rate of propofol infusion at the time of measurements.
b
Number of hours of continuous propofol infusion before measurements.
c
Opioid
medication administered during the 12 hours before (total intravenous bolus) and/or during the measurements (infusion rate). AVR, aortic valve
replacement; CABG, coronary artery bypass graft.
Available online />R487
Statistical analysis
We carried out exploratory analyses to determine which EEG
and ERP parameters changed significantly in response to
interruption to sedation. For this purpose, Wilcoxon signed
rank test (nonparametric paired sample test) was applied to
the N100 amplitude and latency values (in response to stand-
ard stimuli), MMN, RMS power and SEF95 values measured
before and after interruption to sedation. Moreover, Kruskal–
Wallis test (nonparametric counterpart of one-way analysis of
variance) was used to test whether the ERP and the EEG
parameters differed among the sedation levels present during
propofol infusion. The effect of the total duration of propofol
infusion on the studied parameters was assessed using
Spearman's correlation coefficient. The recording channels Fz
and Cz were studied separately. Data are expressed as mean
± standard deviation, unless otherwise indicated. All statistical
analyses were done using the SPSS software (SPSS for
Windows, version 11.0; SPAA Inc., Chicago, IL, USA). P <
0.05 was considered statistically significant.
Results
During propofol infusion the sedation level for each patient
was determined on clinical grounds. It varied from deep seda-
tion (SAS score 2) to light sedation (SAS score 4). All patients
were responsive and cooperative (SAS score 4) within 30 min
after discontinuation of propofol. Weaning and extubation
were successful in 10 patients, whereas sedation was elec-
tively restarted in the remaining nine patients.
Of the ERP recordings, 2% and 5% were discarded as artifact
during and after sedation, respectively. Accordingly, 8% and
20% of the background EEG recordings were discarded.
Effect of interruption to propofol infusion
The EEG parameters (RMS power and SEF95) and ERP
parameters (N100 and MMN) measured before and after inter-
ruption to sedation did not differ between those patients who
proceeded to weaning and extubation and those in whom
sedation was restarted. The RMS power increased after inter-
ruption to sedation (Fz and Cz, P < 0.05; Fig. 2a,2b), whereas
the SEF95 values exhibited only a tendency toward a
decrease (not significant; Fig. 2c,2d). The amplitude of the
N100 component (in response to standard stimuli) increased
at both frontal (Fz, P < 0.05) and central recording sites (Fig.
3a,3b). The latency of the N100 component (in response to
standard stimuli) and the MMN did not change in response to
interruption to propofol infusion. The MMN mean amplitude,
which should be a negative value while awake, exhibited both
positive and negative values after sedation had subsided (Fig.
3c,3d).
Effect of sedation level
During propofol infusion, seven patients were deeply sedated
(SAS score 2), seven patients were moderately sedated (SAS
score 3) and five patients were lightly sedated (SAS score 4).
The level of sedation did not influence EEG parameters. The
amplitude of the N100 component (in response to standard
stimuli) differed between sedation levels (Fz and Cz, P <
0.05), in contrast to N100 latency and MMN (Fig. 3). Both
negative and positive MMN mean amplitudes were obtained
independently of sedation level (Fig. 3c,3d).
Patient characteristics and duration or rate of propofol infusion
did not differ among sedation level groups.
Effect of propofol infusion duration
None of the ERP and EEG parameters correlated with the total
duration of propofol infusion.
Discussion
ERPs have exhibited graded changes with increasing doses of
sedative drugs in volunteers and surgical patients [6,7], but to
date no parallel studies have been conducted in severely ill
patients. We assessed ERPs together with EEG parameters
in a heterogeneous group of intensive care patients under
sedation with propofol. The range of doses of sedative and
analgesic drugs varied widely, but despite this our preliminary
data suggest an association between clinical level of sedation
and neurophysiological parameters. Our main findings were
that the amplitude of the standard N100 component differed
among the sedation levels during propofol sedation, and that
the amplitude of the standard N100 in the frontal area as well
as the RMS power increased in response to interruption to
propofol infusion.
We selected RMS power and SEF95 to describe the changes
in the EEG spectrum related to the interruption to propofol
infusion. The RMS power represents the total power of the sig-
nal and the SEF95 is the frequency below which 95% of the
power in the EEG spectrum resides. Sedative doses of propo-
fol have been shown to produce an increase in total, delta and
beta activity in the EEG signal, especially in the Cz and Fz
regions [11-13]. In our study the total power of the EEG signal
was inversely related to sedation, increasing after interruption
to propofol infusion. However, the SEF95 decreased in many
Table 2
The Sedation–Agitation Scale
Score Clinical status
7 Dangerous agitation
6Very agitated
5 Agitated
4 Calm and cooperative
3 Sedated
2Very sedated
1Unarousable
Data from Riker and coworkers [8].
Critical Care December 2004 Vol 8 No 6 Yppärilä et al.
R488
patients under the same circumstances. This suggests that
awakening was not paralleled by a prominent increase in the
high frequency range, probably due to the decrease in beta
activity related to interruption to propofol infusion. Administra-
tion of opioids might also have markedly modified the EEG pat-
tern as compared with that observed during isolated propofol
infusion.
Identifiable ERPs may indicate an increased risk for auditory
perception during general anaesthesia [14,15] and a positive
outcome in coma patients [16,17]. During propofol sedation,
the N100 component has been reported to decrease in ampli-
tude and to delay in latency as compared with recording
before the beginning of propofol infusion [5]. As sedation sub-
sides, the opposite (amplitude increase and latency shorten-
ing) has been observed in surgical patients recovering from
postoperative propofol sedation [7]. In the present study the
N100 amplitude recovered similarly as the level of sedation
subsided, although the amplitude values were markedly
smaller than those of the surgical patients both during seda-
tion and after sedation had subsided. Moreover, the MMN
exhibited a large inter-individual variability and many patients
had a positive MMN mean amplitude (Fig. 3c,3d), suggesting
that MMN was not present or could not be reliably measured.
In our earlier study conducted in surgical patients [7], the
MMN was present at comparable sedation levels.
The small N100 amplitude and the absence of the MMN could
have resulted from the use of medication other than propofol
and opioids during the study period. We cannot exclude the
presence of some level of sedative potentiation or side effects
resulting from this medication, which might have affected the
results. In all patients benzodiazepines were discontinued for
a minimum of 8 hours before measurements were taken. How-
ever, some degree of residual sedative effect due to potentially
impaired metabolism might have influenced our findings. Clif-
ford and Buchman [18] reported that the combination of ben-
zodiazepine and fentanyl affected information processing in
response to novel and standard stimuli in a different manner
than the combination of propofol and fentanyl in intensive care
patients. Nevertheless, both of these drug combinations glo-
bally reduced the amplitudes of the responses to all stimuli as
the sedative drug dose increased, in a manner similar to that in
our study. We also speculate that, because of the short time
allowed after propofol discontinuation, patients were still
under influence of this drug during the later measurements.
Thus, ERP parameters might not have had enough time to
recover, even if the patients were awake and able to follow
simple commands (SAS score 4). We did not study the effect
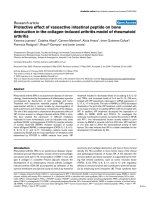
Figure 2
Average and individual root mean squared (RMS) power and spectral edge frequency 95% (SEF95) values during and after discontinuation of pro-pofol infusion in the (a, c) frontal (Fz) and (b, d) central (Cz) regionsAverage and individual root mean squared (RMS) power and spectral edge frequency 95% (SEF95) values during and after discontinuation of pro-
pofol infusion in the (a, c) frontal (Fz) and (b, d) central (Cz) regions. Lines connect values obtained from the same patient; black squares with verti-
cal lines indicate the mean ± standard deviation. Individual sedation levels obtained with the Sedation–Agitation Scale (SAS): white spheres: SAS 4,
gray spheres: SAS 3, black spheres: SAS2. *Significantly different from 'propofol on'.
5
10
15
20
25
30
35
R
M
S
p
o
w
e
r
F
z
(µ
V
2
)
5
10
15
20
25
30
35
R
M
S
p
o
w
e
r
C
z
(µ
V
2
)
5
10
15
20
25
30
35
S
E
F
9
5
F
z
(
H
z
)
5
10
15
20
25
30
35
S
E
F
9
5
C
z
(
H
z
)
propofol on propofol off
propofol on propofol offpropofol on propofol off
propofol on propofol off
*
*
(a)
(b)
(c
)
(d)
Available online />R489
of opioids on the ERPs in more detail because subanaesthetic
doses of fentanyl [19] and remifentanil [20] have been shown
not to attenuate the N100 component.
In the intensive care setting, EEG parameters and ERPs are
influenced not only by the administration of sedative drugs but
also by the underlying illness, which may cause considerable
changes in functioning of the sensory pathways [21]. Diagno-
sis and reason for intensive care varied considerably in our
population. We excluded patients with known organic brain
dysfunction from the study, but it is possible that some of the
patients suffered from mild subclinical neurological deficits.
However, because all patients woke up and were able to fol-
low commands, we believe that possible brain dysfunction did
not have a significant effect on our results. Moreover, no differ-
ences could be found in neurophysiological parameters
between extubated patients and those whose sedation was
continued electively.
The statistical methods we applied deserve comment. We
conducted exploratory analyses to determine which EEG and
ERP parameters changed significantly because of interruption
to sedation. Performing multiple comparisons, as we did, is
known to increase the risk for type I error (i.e. obtaining signif-
icant differences by chance). However, because of both the
exploratory nature of our analysis and the controversy con-
cerning the Bonferroni method, we opted not to use this
adjustment [22,23]. Furthermore, the heterogeneity of our
patient group limits the power of statistical analysis. To over-
come this limitation, we presented individual data points and
used statistical analysis only to show trends in our findings.
Conclusion
In a group of intensive care patients, with heterogeneous diag-
nosis and reasons for intensive care, assessment of the level
of sedation using spectral EEG alone may not be sufficiently
accurate. Concomitant use of ERPs, especially the N100
component, which requires widespread activity and functional
integrity of the brain, may provide better distinction between
sedation levels. Neurophysiological methods may thus be use-
ful complements to clinical sedation scales in the monitoring
of sedation status over time in intensive care patients under
controlled sedative drug administration.
Figure 3
Average and individual N100 standard amplitude and mismatch negativity (MMN) values during and after discontinuation of propofol infusion in the (a, c) frontal (Fz) and (b, d) central (Cz) regionsAverage and individual N100 standard amplitude and mismatch negativity (MMN) values during and after discontinuation of propofol infusion in the
(a, c) frontal (Fz) and (b, d) central (Cz) regions. Lines connect values obtained from the same patient; black squares with vertical lines indicate the
mean ± standard deviation. Individual sedation levels obtained with the Sedation–Agitation Scale (SAS): white spheres: SAS 4, gray spheres: SAS
3, black spheres: SAS2. *Significantly different from 'propofol on'.
-6
-5
-4
-3
-2
-1
0
1
N
1
0
0
s
t
a
n
d
a
r
d
a
m
p
l
i
t
u
d
e
F
z
(
µ
V
)
-6
-5
-4
-3
-2
-1
0
1
N
1
0
0
s
t
a
n
d
a
r
d
a
m
p
l
i
t
u
d
e
C
z
(
µ
V
)
-3
-2
-1
0
1
2
3
M
M
N
F
z
(
µ
V
)
-3
-2
-1
0
1
2
3
M
M
N
C
z
(
µ
V
)
propofol on propofol off
propofol on propofol off
propofol on propofol off
propofol on propofol off
(a) (b)
(c) (d)
*
Critical Care December 2004 Vol 8 No 6 Yppärilä et al.
R490
Competing interests
The author(s) declare that they have no competing interests.
Author's contributions
HYP, SN, IK, JP and ER participated in the interpretation of the
results and writing of the manuscript. HYP and SN performed
data collection, data entry and statistical analysis.
References
1. Brook AD, Ahrens TS, Schaiff R, Prentice D, Sherman G, Shannon
W, Kollef M: Effect of a nursing-implemented sedation protocol
on the duration of mechanical ventilation. Crit Care Med 1999,
27:2609-2615.
2. Kress J, Pohlman A, O'Connor M, Hall J: Daily interruption of sed-
ative infusions in critically ill patients undergoing mechanical
ventilation. N Engl J Med 2000, 342:1471-1477.
3. Näätänen R, Picton T: The N1 wave of the human electric and
magnetic response to sound: a review and an analysis of the
component structure. Psychophysiology 1987, 24:375-425.
4. Näätänen R: Attention and Brain Function Hillsdale, NJ: Lawrence
Erlbaum Associates; 1992.
5. Heinke W, Kenntner R, Gunter T, Sammler D, Olthoff D, Koelsch
S: Sequential effects of increasing propofol sedation on fron-
tal and temporal cortices as indexed by auditory event-related
potentials. Anesthesiology 2004, 100:617-625.
6. Simpson T, Manara A, Kane N, Barton R, Rowlands C, Butler S:
Effect of propofol anesthesia on the event-related potential
mismatch negativity and the auditory-evoked potential N1. Br
J Anaesth 2002, 89:382-388.
7. Yppärilä H, Karhu J, Westeren-Punnonen S, Musialowicz T, Par-
tanen J: Evidence of auditory processing in postoperative pro-
pofol sedation. Clin Neurophysiol 2002, 113:1357-1364.
8. Riker R, Picard J, Fraser G: Prospective evaluation of the seda-
tion-agitation-scale for adult critically ill patients. Crit Care Med
1999, 27:1325-1329.
9. Kay S: Modern Spectral Estimation: Theory and Application Pren-
tice-Hall, Upper Saddle River, NJ; 1988.
10. Sinkkonen J, Tervaniemi M: Towards optimal recording and
analysis of the mismatch negativity. Audiol Neurootol 2000,
5:235-246.
11. Seifert H, Blouin R, Conard P, Gross J: Sedative doses of propo-
fol increase beta activity of the processed
electroencephalogram. Anesth Analg 1993, 76:976-978.
12. Sneyd R, Samra S, Davidson B, Kishimoto T, Kadoya C, Domino E:
Electrophysiological effects of propofol sedation. Anesth Analg
1994, 79:1151-1158.
13. Kishimoto T, Kadoya C, Sneyd R, Samra S, Domino E: Topo-
graphic electroencephalogram of propofol-induced conscious
sedation. Clin Pharmacol Ther 1995, 58:666-674.
14. van Hooff J, de Beer N, Brunia C, Cluitmans P, Korsten H: Event-
related potential measures of information processing during
general anesthesia. Electroenceph Clin Neurophysiol 1997,
103:268-281.
15. Plourde G, Picton T: Long-latency auditory evoked potentials
during general anesthesia: N1 and P3 components. Anesth
Analg 1991, 72:342-350.
16. Fischer C, Morlet D, Bouchet P, Luaute J, Jourdan C, Salord F:
Mismatch negativity and late auditory evoked potentials in
comatose patients. Clin Neurophysiol 1999, 110:1601-1610.
17. Guerit J, Verougstraete D, de Tourtchaninoff M, Debatisse D, Wit-
doeckt C: ERPs obtained with auditory oddball paradigm in
coma and altered states of consciousness: clinical relation-
ships, prognostic value, and origin of components. Clin
Neurophysiol 1999, 110:1260-1269.
18. Clifford J, Buchman T: Sedation modulates recognition of novel
stimuli and adaptation to regular stimuli in critically ill adults.
Crit Care Med 2002, 30:609-616.
19. Veselis R, Reinsel R, Feshchenko V: Drug-induced amnesia is a
separate phenomenon from sedation: electrophysiological
evidence. Anesthesiology 2001, 95:896-907.
20. Hänggi M, Yppärilä H, Takala J, Korhonen I, Luginbuehl M,
Petersen S, Jakob S: Measuring depth of sedation with auditory
evoked potentials during controlled infusion of propofol and
remifentanil in healthy volunteers. Anesth Analg in press.
21. Zauner C, Gendo A, Kramer L, Funk G, Bauer E, Schenk P, Rath-
eiser K, Madl C: Impaired subcortical and cortical sensory
evoked potential pathways in septic patients. Crit Care Med
2002, 30:1136-1139.
22. Bland J, Altman D: Multiple significance tests: the Bonferroni
method. BMJ 1995, 310:170.
23. Perneger T: What's wrong with Bonferroni adjustments. BMJ
1998, 316:1236-1238.
Key messages
• The EGG alone may not be sufficiently accurate in the
assessment of sedation levels in intensive care unit
patients.
• Concomitant use of ERPs, especially the N100 poten-
tial, may help to differentiate between sedation levels.
• Neurophysiological methods may offer a complement
to clinical sedation scales in neurologically intact inten-
sive care patients.