Learning MATLAB Version 6 (Release 12) phần 6 ppt
Bạn đang xem bản rút gọn của tài liệu. Xem và tải ngay bản đầy đủ của tài liệu tại đây (93.68 KB, 29 trang )
Scripts and Functions
6-19
You can see the file with
type rank
Here is the file.
function r = rank(A,tol)
% RANK Matrix rank.
% RANK(A) provides an estimate of the number of linearly
% independent rows or columns of a matrix A.
% RANK(A,tol) is the number of singular values of A
% that are larger than tol.
% RANK(A) uses the default tol = max(size(A)) * norm(A) * eps.
s = svd(A);
if nargin==1
tol = max(size(A)') * max(s) * eps;
end
r = sum(s > tol);
The first line of a function M-file starts with the keyword function. It gives the
function name and order of arguments. In this case, there are up to two input
arguments and one output argument.
The next several lines, up to the first blank or executable line, are comment
lines that provide the help text. These lines are printed when you type
help rank
The first line of the help text is the H1 line, which MATLAB displays when you
use the lookfor command or request help on a directory.
The rest of the file is the executable MATLAB code defining the function. The
variable s introduced in the body of the function, as well as the variables on the
first line, r, A and tol, are all local to the function; they are separate from any
variables in the MATLAB workspace.
This example illustrates one aspect of MATLAB functions that is not ordinarily
found in other programming languages – a variable number of arguments. The
rank function can be used in several different ways.
rank(A)
r = rank(A)
r = rank(A,1.e-6)
6 Programming with MATLAB
6-20
Many M-files work this way. If no output argument is supplied, the result is
stored in ans. If the second input argument is not supplied, the function
computes a default value. Within the body of the function, two quantities
named nargin and nargout are available which tell you the number of input
and output arguments involved in each particular use of the function. The rank
function uses nargin, but does not need to use nargout.
Global Variables
If you want more than one function to share a single copy of a variable, simply
declare the variable as global in all the functions. Do the same thing at the
command line if you want the base workspace to access the variable. The global
declaration must occur before the variable is actually used in a function.
Although it is not required, using capital letters for the names of global
variables helps distinguish them from other variables. For example, create an
M-file called falling.m.
function h = falling(t)
global GRAVITY
h = 1/2*GRAVITY*t.^2;
Then interactively enter the statements
global GRAVITY
GRAVITY = 32;
y = falling((0:.1:5)');
The two global statements make the value assigned to GRAVITY at the
command prompt available inside the function. You can then modify GRAVITY
interactively and obtain new solutions without editing any files.
Passing String Arguments to Functions
You can write MATLAB functions that accept string arguments without the
parentheses and quotes. That is, MATLAB interprets
foo a b c
as
foo('a','b','c')
Scripts and Functions
6-21
However, when using the unquoted form, MATLAB cannot return output
arguments. For example,
legend apples oranges
creates a legend on a plot using the strings apples and oranges as labels. If you
want the legend command to return its output arguments, then you must use
the quoted form.
[legh,objh] = legend('apples','oranges');
In addition, you cannot use the unquoted form if any of the arguments are not
strings.
Constructing String Arguments in Code
The quoted form enables you to construct string arguments within the code.
The following example processes multiple data files, August1.dat,
August2.dat, and so on. It uses the function int2str, which converts an
integer to a character, to build the filename.
for d = 1:31
s = ['August' int2str(d) '.dat'];
load(s)
% Code to process the contents of the d-th file
end
A Cautionary Note
While the unquoted syntax is convenient, it can be used incorrectly without
causing MATLAB to generate an error. For example, given a matrix A,
A =
0 -6 -1
6 2 -16
-5 20 -10
The eig command returns the eigenvalues of A.
eig(A)
ans =
-3.0710
-2.4645+17.6008i
-2.4645-17.6008i
6 Programming with MATLAB
6-22
The following statement is not allowed because A is not a string, however
MATLAB does not generate an error.
eig A
ans =
65
MATLAB actually takes the eigenvalues of ASCII numeric equivalent of the
letter A (which is the number 65).
The eval Function
The eval function works with text variables to implement a powerful text
macro facility. The expression or statement
eval(s)
uses the MATLAB interpreter to evaluate the expression or execute the
statement contained in the text string s.
Scripts and Functions
6-23
The example of the previous section could also be done with the following code,
although this would be somewhat less efficient because it involves the full
interpreter, not just a function call.
for d = 1:31
s = ['load August' int2str(d) '.dat'];
eval(s)
% Process the contents of the d-th file
end
Vectorization
To obtain the most speed out of MATLAB, it’s important to vectorize the
algorithms in your M-files. Where other programming languages might use for
or DO loops, MATLAB can use vector or matrix operations. A simple example
involves creating a table of logarithms.
x = .01;
for k = 1:1001
y(k) = log10(x);
x = x + .01;
end
A vectorized version of the same code is
x = .01:.01:10;
y = log10(x);
For more complicated code, vectorization options are not always so obvious.
When speed is important, however, you should always look for ways to
vectorize your algorithms.
Preallocation
If you can’t vectorize a piece of code, you can make your for loops go faster by
preallocating any vectors or arrays in which output results are stored. For
example, this code uses the function zeros to preallocate the vector created in
the for loop. This makes the for loop execute significantly faster.
r = zeros(32,1);
for n = 1:32
r(n) = rank(magic(n));
end
6 Programming with MATLAB
6-24
Without the preallocation in the previous example, the MATLAB interpreter
enlarges the r vector by one element each time through the loop. Vector
preallocation eliminates this step and results in faster execution.
Function Handles
You can create a handle to any MATLAB function and then use that handle as
a means of referencing the function. A function handle is typically passed in an
argument list to other functions, which can then execute, or evaluate, the
function using the handle.
Construct a function handle in MATLAB using the at sign, @, before the
function name. The following example creates a function handle for the sin
function and assigns it to the variable fhandle.
fhandle = @sin;
Evaluate a function handle using the MATLAB feval function. The function
plot_fhandle, shown below, receives a function handle and data, and then
performs an evaluation of the function handle on that data using feval.
function x = plot_fhandle(fhandle, data)
plot(data, feval(fhandle, data))
When you call plot_fhandle with a handle to the sin function and the
argument shown below, the resulting evaluation produces a sine wave plot.
plot_fhandle(@sin, -pi:0.01:pi)
Function Functions
A class of functions, called “function functions,” works with nonlinear functions
of a scalar variable. That is, one function works on another function. The
function functions include:
• Zero finding
• Optimization
• Quadrature
• Ordinary differential equations
Scripts and Functions
6-25
MATLAB represents the nonlinear function by a function M-file. For example,
here is a simplified version of the function humps from the matlab/demos
directory.
function y = humps(x)
y = 1./((x 3).^2 + .01) + 1./((x 9).^2 + .04) - 6;
Evaluate this function at a set of points in the interval with
x = 0:.002:1;
y = humps(x);
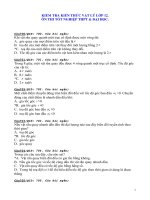
Then plot the function with
plot(x,y)
The graph shows that the function has a local minimum near x = 0.6. The
function fminsearch finds the minimizer, the value of x where the function
takes on this minimum. The first argument to fminsearch is a function handle
to the function being minimized and the second argument is a rough guess at
the location of the minimum.
0 x 1
≤≤
0 0.1 0.2 0.3 0.4 0.5 0.6 0.7 0.8 0.9 1
0
10
20
30
40
50
60
70
80
90
100
6 Programming with MATLAB
6-26
p = fminsearch(@humps,.5)
p =
0.6370
To evaluate the function at the minimizer,
humps(p)
ans =
11.2528
Numerical analysts use the terms quadrature and integration to distinguish
between numerical approximation of definite integrals and numerical
integration of ordinary differential equations. MATLAB’s quadrature routines
are quad and quadl. The statement
Q = quadl(@humps,0,1)
computes the area under the curve in the graph and produces
Q =
29.8583
Finally, the graph shows that the function is never zero on this interval. So, if
you search for a zero with
z = fzero(@humps,.5)
you will find one outside of the interval
z =
-0.1316
Demonstration Programs Included with MATLAB
6-27
Demonstration Programs Included with MATLAB
MATLAB includes many demonstration programs that highlight various
features and functions. For a complete list of the demos, at the command
prompt type
help demos
To view a specific file, for example, airfoil, type
edit airfoil
To run a demonstration, type the filename at the command prompt. For
example, to run the airfoil demonstration, type
airfoil
Note Many of the demonstrations use multiple windows and require you to
press a key in the MATLAB Command Window to continue through the
demonstration.
The following tables list some of the current demonstration programs that are
available, organized into these categories:
• MATLAB Matrix Demonstration Programs
• MATLAB Numeric Demonstration Programs
• MATLAB Visualization Demonstration Programs
• MATLAB Language Demonstration Programs
• MATLAB Differential Equation Programs
• MATLAB Gallery Demonstration Programs
• MATLAB Game Demonstration Programs
• MATLAB Miscellaneous Demonstration Programs
• MATLAB Helper Functions Demonstration Programs
6 Programming with MATLAB
6-28
.
MATLAB Matrix Demonstration Programs
airfoil
Graphical demonstration of sparse matrix from NASA
airfoil.
buckydem
Connectivity graph of the Buckminster Fuller geodesic
dome.
delsqdemo
Finite difference Laplacian on various domains.
eigmovie
Symmetric eigenvalue movie.
eigshow
Graphical demonstration of matrix eigenvalues.
intro
Introduction to basic matrix operations in MATLAB.
inverter
Demonstration of the inversion of a large matrix.
matmanip
Introduction to matrix manipulation.
rrefmovie
Computation of reduced row echelon form.
sepdemo
Separators for a finite element mesh.
sparsity
Demonstration of the effect of sparsity orderings.
svdshow
Graphical demonstration of matrix singular values.
MATLAB Numeric Demonstration Programs
bench
MATLAB benchmark.
census
Prediction of the U.S. population in the year 2000.
e2pi
Two-dimensional, visual solution to the problem
“Which is greater, or ?”
fftdemo
Use of the FFT function for spectral analysis.
fitdemo
Nonlinear curve fit with simplex algorithm.
fplotdemo
Demonstration of plotting a function.
e
π
π
e
Demonstration Programs Included with MATLAB
6-29
funfuns
Demonstration of functions operating on other
functions.
lotkademo
Example of ordinary differential equation solution.
quaddemo
Adaptive quadrature.
qhulldemo
Tessellation and interpolation of scattered data.
quake
Loma Prieta earthquake.
spline2d
Demonstration of ginput and spline in two
dimensions.
sunspots
Demonstration of the fast Fourier transform (FFT)
function in MATLAB used to analyze the variations in
sunspot activity.
zerodemo
Zero finding with fzero.
MATLAB Visualization Demonstration Programs
colormenu
Demonstration of adding a colormap to the current
figure.
cplxdemo
Maps of functions of a complex variable.
earthmap
Graphical demonstrations of earth’s topography.
graf2d
Two-dimensional XY plots in MATLAB.
graf2d2
Three-dimensional XYZ plots in MATLAB.
grafcplx
Demonstration of complex function plots in MATLAB.
imagedemo
Demonstration of MATLAB’s image capability.
imageext
Demonstration of changing and rotating image
colormaps.
MATLAB Numeric Demonstration Programs (Continued)
6 Programming with MATLAB
6-30
lorenz
Graphical demonstration of the orbit around the
Lorenz chaotic attractor.
penny
Several views of the penny data.
vibes
Vibrating L-shaped membrane movie.
xfourier
Graphical demonstration of Fourier series expansion.
xpklein
Klein bottle demo.
xpsound
Demonstration of MATLAB’s sound capability.
MATLAB Language Demonstration Programs
graf3d
Demonstration of Handle Graphics for surface plots.
hndlaxis
Demonstration of Handle Graphics for axes.
hndlgraf
Demonstration of Handle Graphics for line plots.
xplang
Introduction to the MATLAB language.
MATLAB Differential Equation Programs
amp1dae
Stiff DAE from an electrical circuit.
ballode
Equations of motion for a bouncing ball used by
BALLDEMO.
brussode
Stiff problem, modelling a chemical reaction
(Brusselator).
burgersode
Burger's equation solved using a moving mesh
technique.
fem1ode
Stiff problem with a time-dependent mass matrix.
fem2ode
Stiff problem with a time-independent mass matrix.
MATLAB Visualization Demonstration Programs (Continued)
Demonstration Programs Included with MATLAB
6-31
hb1dae
Stiff DAE from a conservation law.
hb1ode
Stiff problem 1 of Hindmarsh and Byrne.
hb3ode
Stiff problem 3 of Hindmarsh and Byrne.
mat4bvp
Find the fourth eigenvalue of the Mathieu’s equation.
odedemo
Demonstration of the ODE suite integrators.
odeexamples
Browse the MATLAB ODE/DAE/BVP/PDE examples.
orbitode
Restricted 3 body problem used by ORBITDEMO.
pdex1
Example 1 for PDEPE.
pdex2
Example 2 for PDEPE.
pdex3
Example 3 for PDEPE.
pdex4
Example 4 for PDEPE.
rigidode
Euler equations of a rigid body without external forces.
shockbvp
The solution has a shock layer near x = 0.
twobvp
BVP that has exactly two solutions.
vdpode
Parameterizable van der Pol equation (stiff for large µ).
MATLAB Gallery Demonstration Programs
cruller
Graphical demonstration of a cruller.
klein1
Graphical demonstration of a Klein bottle.
knot
Tube surrounding a three-dimensional knot.
logo
Graphical demonstration of the MATLAB L-shaped
membrane logo.
MATLAB Differential Equation Programs (Continued)
6 Programming with MATLAB
6-32
modes
Graphical demonstration of 12 modes of the L-shaped
membrane.
quivdemo
Graphical demonstration of the quiver function.
spharm2
Graphical demonstration of spherical surface
harmonic.
tori4
Graphical demonstration of four-linked, unknotted tori.
MATLAB Game Demonstration Programs
fifteen
Sliding puzzle.
life
Conway’s Game of Life.
soma
Soma cube.
xpbombs
Minesweeper game.
MATLAB Miscellaneous Demonstration Programs
chaingui
Matrix chain multiplication optimization.
codec
Alphabet transposition coder/decoder.
crulspin
Spinning cruller movie.
logospin
Movie of the MathWorks logo spinning.
makevase
Demonstration of a surface of revolution.
quatdemo
Quaternion rotation.
spinner
Colorful lines spinning through space.
travel
Traveling salesman problem.
truss
Animation of a bending bridge truss.
MATLAB Gallery Demonstration Programs (Continued)
Demonstration Programs Included with MATLAB
6-33
Getting More Information
The MathWorks Web site (www.mathworks.com) contains numerous M-files
that have been written by users and MathWorks staff. These are accessible by
selecting Downloads. Also, Technical Notes, which is accessible from our
Technical Support Web site (www.mathworks.com/support), contains
numerous examples on graphics, mathematics, API, Simulink, and others.
wrldtrv
Great circle flight routes around the globe.
xphide
Visual perception of objects in motion.
xpquad
Superquadrics plotting demonstration.
MATLAB Helper Functions Demonstration Programs
bucky
Graph of the Buckminster Fuller geodesic dome.
cmdlnbgn
Set up for command line demos.
cmdlnend
Clean up after command line demos.
cmdlnwin
Demo gateway routine for running command line
demos.
finddemo
Command that finds available demos for individual
toolboxes.
helpfun
Utility function for displaying help text conveniently.
membrane
The MathWorks logo.
peaks
Sample function of two variables.
pltmat
Command that displays a matrix in a figure window.
MATLAB Miscellaneous Demonstration Programs (Continued)
6 Programming with MATLAB
6-34
7
Symbolic Math Toolbox
Introduction . . . . . . . . . . . . . . . . . . . . 7-2
Getting Help . . . . . . . . . . . . . . . . . . . . 7-4
Getting Started . . . . . . . . . . . . . . . . . . 7-5
Calculus . . . . . . . . . . . . . . . . . . . . . . 7-16
Simplifications and Substitutions . . . . . . . . . . 7-43
Variable-Precision Arithmetic . . . . . . . . . . . . 7-58
Linear Algebra . . . . . . . . . . . . . . . . . . . 7-63
Solving Equations . . . . . . . . . . . . . . . . . 7-86
7 Symbolic Math Toolbox
7-2
Introduction
The Symbolic Math Toolbox incorporates symbolic computation into
MATLAB’s numeric environment. This toolbox supplements MATLAB’s
numeric and graphical facilities with several other types of mathematical
computation.
The computational engine underlying the toolboxes is the kernel of Maple, a
system developed primarily at the University of Waterloo, Canada, and, more
recently, at the Eidgenössiche Technische Hochschule, Zürich, Switzerland.
Maple is marketed and supported by Waterloo Maple, Inc.
This version of the Symbolic Math Toolbox is designed to work with MATLAB 6
and Maple V Release 5.
The Symbolic Math Toolbox is a collection of more than one-hundred MATLAB
functions that provide access to the Maple kernel using a syntax and style that
is a natural extension of the MATLAB language. The toolbox also allows you to
access functions in Maple’s linear algebra package. With this toolbox, you can
write your own M-files to access Maple functions and the Maple workspace.
Facility Covers
Calculus Differentiation, integration, limits, summation, and
Taylor series
Linear Algebra Inverses, determinants, eigenvalues, singular value
decomposition, and canonical forms of symbolic
matrices
Simplification Methods of simplifying algebraic expressions
Solution of
Equations
Symbolic and numerical solutions to algebraic and
differential equations
Transforms Fourier, Laplace, z-transform, and corresponding
inverse transforms
Variable-Precision
Arithmetic
Numerical evaluation of mathematical expressions
to any specified accuracy
Introduction
7-3
The following sections of this tutorial provide explanation and examples on
how to use the toolbox.
For More Information You can access complete reference information for
the Symbolic Math Toolbox functions from Help. Also, you can print the PDF
version of the complete Symbolic Math Toolbox User’s Guide (tutorial and
reference information) from the Symbolic Math Toolbox roadmap in Help.
Section Covers
“Getting Help” How to get online help for Symbolic Math
Toolbox functions
“Getting Started” Basic symbolic math operations
“Calculus” How to differentiate and integrate symbolic
expressions
“Simplifications and
Substitutions”
How to simplify and substitute values into
expressions
“Variable-Precision
Arithmetic”
How to control the precision of
computations
“Linear Algebra” Examples using the toolbox functions
“Solving Equations” How to solve symbolic equations
7 Symbolic Math Toolbox
7-4
Getting Help
There are several ways to find information on using Symbolic Math Toolbox
functions. One, of course, is to read this chapter! Another is to use online Help,
which contains tutorials and reference information for all the functions. You
can also use MATLAB’s command line help system. Generally, you can obtain
help on MATLAB functions simply by typing
help function
where function is the name of the MATLAB function for which you need help.
This is not sufficient, however, for some Symbolic Math Toolbox functions. The
reason? The Symbolic Math Toolbox “overloads” many of MATLAB’s numeric
functions. That is, it provides symbolic-specific implementations of the
functions, using the same function name. To obtain help for the symbolic
version of an overloaded function, type
help sym/function
where function is the overloaded function’s name. For example, to obtain help
on the symbolic version of the overloaded function, diff, type
help sym/diff
To obtain information on the numeric version, on the other hand, simply type
help diff
How can you tell whether a function is overloaded? The help for the numeric
version tells you so. For example, the help for the diff function contains the
section
Overloaded methods
help char/diff.m
help sym/diff.m
This tells you that there are two other diff commands that operate on
expressions of class char and class sym, respectively. See the next section for
information on class sym. For more information on overloaded commands, see
“Overloading Operators and Functions” in Using MATLAB, which is accessible
from Help.
Getting Started
7-5
Getting Started
This section describes how to create and use symbolic objects. It also describes
the default symbolic variable. If you are familiar with version 1 of the Symbolic
Math Toolbox, please note that version 2 uses substantially different and
simpler syntax.
To get a quick online introduction to the Symbolic Math Toolbox, type demos at
the MATLAB command line. MATLAB displays the MATLAB Demos dialog
box. Select Symbolic Math (in the left list box) and then Introduction (in the
right list box).
Symbolic Objects
The Symbolic Math Toolbox defines a new MATLAB data type called a
symbolic object or sym (for more information on data types, the MATLAB topic
“Programming and Data Types” in Using MATLAB). Internally, a symbolic
object is a data structure that stores a string representation of the symbol. The
Symbolic Math Toolbox uses symbolic objects to represent symbolic variables,
expressions, and matrices.
7 Symbolic Math Toolbox
7-6
Creating Symbolic Variables and Expressions
The sym command lets you construct symbolic variables and expressions. For
example, the commands
x = sym('x')
a = sym('alpha')
create a symbolic variable x that prints as x and a symbolic variable a that
prints as alpha.
Suppose you want to use a symbolic variable to represent the golden ratio
The command
rho = sym('(1 + sqrt(5))/2')
achieves this goal. Now you can perform various mathematical operations on
rho. For example,
f = rho^2 - rho - 1
returns
f =
(1/2+1/2*5^(1/2))^2-3/2-1/2*5^(1/2)
Then
simplify(f)
returns
0
Now suppose you want to study the quadratic function . The
statement
f = sym('a*x^2 + b*x + c')
assigns the symbolic expression to the variable f. Observe that in
this case, the Symbolic Math Toolbox does not create variables corresponding
to the terms of the expression, , , , and . To perform symbolic math
ρ
15+
2
=
fax
2
bx c++=
ax
2
bx c++
a
b
c
x
Getting Started
7-7
operations (e.g., integration, differentiation, substitution, etc.) on f, you need
to create the variables explicitly. You can do this by typing
a = sym('a')
b = sym('b')
c = sym('c')
x = sym('x')
or simply
syms a b c x
In general, you can use sym or syms to create symbolic variables. We
recommend you use syms because it requires less typing.
Symbolic and Numeric Conversions
Consider the ordinary MATLAB quantity
t = 0.1
The sym function has four options for returning a symbolic representation of
the numeric value stored in t. The 'f' option
sym(t,'f')
returns a symbolic floating-point representation
'1.999999999999a'*2^(-4)
The 'r' option
sym(t,'r')
returns the rational form
1/10
This is the default setting for sym. That is, calling sym without a second
argument is the same as using sym with the 'r' option.
sym(t)
ans =
1/10
7 Symbolic Math Toolbox
7-8
The third option 'e' returns the rational form of t plus the difference between
the theoretical rational expression for t and its actual (machine) floating-point
value in terms of eps (the floating-point relative accuracy).
sym(t,'e')
ans =
1/10+eps/40
The fourth option 'd' returns the decimal expansion of t up to the number of
significant digits specified by digits.
sym(t,'d')
ans =
.10000000000000000555111512312578
The default value of digits is 32 (hence, sym(t,'d') returns a number with 32
significant digits), but if you prefer a shorter representation, use the digits
command as follows.
digits(7)
sym(t,'d')
ans =
.1000000
A particularly effective use of sym is to convert a matrix from numeric to
symbolic form. The command
A = hilb(3)
generates the 3-by-3 Hilbert matrix.
A =
1.0000 0.5000 0.3333
0.5000 0.3333 0.2500
0.3333 0.2500 0.2000
By applying sym to A
A = sym(A)
Getting Started
7-9
you can obtain the (infinitely precise) symbolic form of the 3-by-3 Hilbert
matrix.
A =
[ 1, 1/2, 1/3]
[ 1/2, 1/3, 1/4]
[ 1/3, 1/4, 1/5]
Constructing Real and Complex Variables
The sym command allows you to specify the mathematical properties of
symbolic variables by using the 'real' option. That is, the statements
x = sym('x','real'); y = sym('y','real');
or more efficiently
syms x y real
z = x + i*y
create symbolic variables x and y that have the added mathematical property
of being real variables. Specifically this means that the expression
f = x^2 + y^2
is strictly nonnegative. Hence, z is a (formal) complex variable and can be
manipulated as such. Thus, the commands
conj(x), conj(z), expand(z*conj(z))
return the complex conjugates of the variables
x, x-i*y, x^2+y^2
The conj command is the complex conjugate operator for the toolbox. If
conj(x) == x returns 1, then x is a real variable.
To clear x of its “real” property, you must type
syms x unreal
or
x = sym('x','unreal')