intensive insulin therapy in critically ill patients
Bạn đang xem bản rút gọn của tài liệu. Xem và tải ngay bản đầy đủ của tài liệu tại đây (177.03 KB, 9 trang )
The New England
Journal
of
Medicine
Copyright © 2001 by the Massachusetts Medical Society
VOLUME 345
N
OVEMBER
8, 2001
NUMBER 19
N Engl J Med, Vol. 345, No. 19
·
November 8, 2001
·
www.nejm.org
·
1359
INTENSIVE INSULIN THERAPY IN CRITICALLY ILL PATIENTS
G
REET
V
AN
DEN
B
ERGHE
, M.D., P
H
.D., P
IETER
W
OUTERS
, M.S
C
., F
RANK
W
EEKERS
, M.D., C
HARLES
V
ERWAEST
, M.D.,
F
RANS
B
RUYNINCKX
, M.D., M
IET
S
CHETZ
, M.D., P
H
.D., D
IRK
V
LASSELAERS
, M.D., P
ATRICK
F
ERDINANDE
, M.D., P
H
.D.,
P
ETER
L
AUWERS
, M.D.,
AND
R
OGER
B
OUILLON
, M.D., P
H
.D.
A
BSTRACT
Background
Hyperglycemia and insulin resistance
are common in critically ill patients, even if they have
not previously had diabetes. Whether the normaliza-
tion of blood glucose levels with insulin therapy im-
proves the prognosis for such patients is not known.
Methods
We performed a prospective, randomized,
controlled study involving adults admitted to our sur-
gical intensive care unit who were receiving mechan-
ical ventilation. On admission, patients were randomly
assigned to receive intensive insulin therapy (main-
tenance of blood glucose at a level between 80 and
110 mg per deciliter) or conventional treatment (infu-
sion of insulin only if the blood glucose level exceeded
215 mg per deciliter and maintenance of glucose at
a level between 180 and 200 mg per deciliter).
Results
At 12 months, with a total of 1548 patients
enrolled, intensive insulin therapy reduced mortality
during intensive care from 8.0 percent with conven-
tional treatment to 4.6 percent (P<0.04, with adjust-
ment for sequential analyses). The benefit of intensive
insulin therapy was attributable to its effect on mor-
tality among patients who remained in the intensive
care unit for more than five days (20.2 percent with
conventional treatment, as compared with 10.6 per-
cent with intensive insulin therapy; P=0.005). The
greatest reduction in mortality involved deaths due to
multiple-organ failure with a proven septic focus. In-
tensive insulin therapy also reduced overall in-hospital
mortality by 34 percent, bloodstream infections by 46
percent, acute renal failure requiring dialysis or hemo-
filtration by 41 percent, the median number of red-cell
transfusions by 50 percent, and critical-illness poly-
neuropathy by 44 percent, and patients receiving in-
tensive therapy were less likely to require prolonged
mechanical ventilation and intensive care.
Conclusions
Intensive insulin therapy to maintain
blood glucose at or below 110 mg per deciliter reduces
morbidity and mortality among critically ill patients
in the surgical intensive care unit. (N Engl J Med
2001;345:1359-67.)
Copyright © 2001 Massachusetts Medical Society.
From the Department of Intensive Care Medicine (G.V.B., P.W., F.W.,
C.V., M.S., D.V., P.F., P.L.), the Electromyography Laboratory, Depart-
ment of Physical Medicine and Rehabilitation (F.B.), and the Laboratory
for Experimental Medicine and Endocrinology (R.B.), Catholic University
of Leuven, Leuven, Belgium. Address reprint requests to Dr. Van den
Berghe at the Department of Intensive Care Medicine, University Hospital
Gasthuisberg, University of Leuven, B-3000 Leuven, Belgium, or at greta.
RITICALLY ill patients who require inten-
sive care for more than five days have a 20
percent risk of death and substantial mor-
bidity.
1
Critical-illness polyneuropathy and
skeletal-muscle wasting prolong the need for mechan-
ical ventilation.
2-5
Moreover, increased susceptibility
to severe infections and failure of vital organs amplify
the risk of an adverse outcome.
Hyperglycemia associated with insulin resistance
6-8
is common in critically ill patients, even those who
have not previously had diabetes. It has been report-
ed that pronounced hyperglycemia may lead to com-
plications in such patients,
9-13
although data from con-
trolled trials are lacking. In diabetic patients with
acute myocardial infarction, therapy to maintain blood
glucose at a level below 215 mg per deciliter (11.9
mmol per liter) improves the long-term outcome.
14-16
In nondiabetic patients with protracted critical ill-
nesses, high serum levels of insulin-like growth fac-
tor–binding protein 1, which reflect an impaired re-
sponse of hepatocytes to insulin, increase the risk of
death.
17,18
We hypothesized that hyperglycemia or relative
insulin deficiency (or both) during critical illness
may directly or indirectly confer a predisposition to
complications,
11,19,20
such as severe infections, poly-
neuropathy, multiple-organ failure, and death. We per-
formed a prospective, randomized, controlled trial at
one center to determine whether normalization of
blood glucose levels with intensive insulin therapy
reduces mortality and morbidity among critically ill
patients.
C
Copyright © 2001 Massachusetts Medical Society. All rights reserved.
Downloaded from www.nejm.org on April 10, 2006 . This article is being provided free of charge for use in Viet Nam.
1360
·
N Engl J Med, Vol. 345, No. 19
·
November 8, 2001
·
www.nejm.org
The New England Journal of Medicine
METHODS
Study Population
All adults receiving mechanical ventilation who were admitted
to our intensive care unit (which is dedicated primarily but not ex-
clusively to surgical patients) between February 2, 2000, and Jan-
uary 18, 2001, were eligible for enrollment in the study after writ-
ten informed consent had been obtained from the closest family
member. Only 14 patients were excluded: 5 who were participating
in other trials, and 9 who were moribund or for whom there were
do-not-resuscitate orders. The protocol was approved by the in-
stitutional review board.
Four patients had renal failure requiring dialysis before admis-
sion. Among the patients who were admitted to the intensive care
unit after cardiac surgery had been performed, 59 percent had un-
dergone coronary bypass surgery, 27 percent valve replacement,
and 14 percent a combined procedure. On admission, 13 percent
of the patients had a history of diabetes, and 5 percent were re-
ceiving treatment with insulin (Table 1). The blood glucose level
on admission exceeded the upper limit of the normal range after an
overnight fast (110 mg per deciliter [6.1 mmol per liter]) in 75 per-
cent of the patients but was in the nonfasting diabetic range (>200
mg per deciliter [11.1 mmol per liter]) in only 12 percent.
21,22
Study Design
At the time of admission to the intensive care unit, patients were
randomly assigned to receive either intensive or conventional insu-
lin therapy. Assignments to the treatment groups were made with
the use of sealed envelopes, with stratification according to the type
of critical illness (Table 1), and were balanced with the use of per-
muted blocks of 10. In the conventional-treatment group, a contin-
uous infusion of insulin (50 IU of Actrapid HM [Novo Nordisk,
Copenhagen, Denmark] in 50 ml of 0.9 percent sodium chloride),
with the use of a pump (Perfusor-FM, B. Braun, Melsungen, Ger-
many), was started only if the blood glucose level exceeded 215 mg
per deciliter,
8,9
and the infusion was adjusted to maintain the level at
a value between 180 and 200 mg per deciliter (10.0 and 11.1 mmol
per liter).
In the intensive-treatment group, an insulin infusion was started
if the blood glucose level exceeded 110 mg per deciliter, and the in-
fusion was adjusted to maintain normoglycemia (80 to 110 mg per
deciliter [4.4 to 6.1 mmol per liter]). The maximal dose of insulin
was arbitrarily set at 50 IU per hour. When the patient was dis-
charged from the intensive care unit, a conventional approach was
adopted (maintenance of blood glucose at a level between 180 and
200 mg per deciliter).
Adjustments of the insulin dose were based on measurements of
whole-blood glucose in undiluted arterial blood, performed at one-
to four-hour intervals with the use of a glucose analyzer (ABL700,
Radiometer Medical, Copenhagen). The dose was adjusted accord-
ing to a strict algorithm by a team of intensive care nurses, assisted
by a study physician who was not involved in the clinical care of the
patients.
On admission, all patients were fed continuously with intravenous
glucose (200 to 300 g per 24 hours). The next day, total parenter-
al, combined parenteral and enteral, or total enteral feeding was in-
stituted according to a standardized schedule, with 20 to 30 non-
protein kilocalories per kilogram of body weight per 24 hours and
a balanced composition (including 0.13 to 0.26 g of nitrogen per
kilogram per 24 hours and 20 to 40 percent of nonprotein calo-
ries in the form of lipids).
23
Total enteral feeding was attempted
as early as possible.
Data Collection
At base line, demographic and clinical information was obtained,
including information necessary to determine the severity of illness
and use of intensive care resources (Table 1). Scores were calculated
for the Acute Physiology and Chronic Health Evaluation (APACHE
II)
24
and the simplified Therapeutic Intervention Scoring System
(TISS-28).
25,26
Higher scores indicate more severe illness and a high-
er number of therapeutic interventions, respectively. For the TISS-
28 score, each therapeutic intervention is assigned 1 to 4 points,
and the points are summed daily to obtain the overall score.
Because 17 percent of patients were admitted to intensive care
after a median delay of 48 hours, APACHE II scores at the time
of admission were artificially lowered. Moreover, zero points were
usually assigned for the neurologic evaluation, since the majority
*Plus–minus values are means ±SD.
†The body-mass index is the weight in kilograms divided by the square
of the height in meters.
‡APACHE II denotes Acute Physiology and Chronic Health Evaluation.
Higher scores reflect more severe critical illness. The scores in the first 24
hours were artificially lowered because of resuscitative interventions outside
the intensive care unit and because of the assumption of normal conscious-
ness in sedated patients.
§TISS-28 denotes Therapeutic Intervention Scoring System. Each ther-
apeutic intervention is assigned 1 to 4 points, and the points are summed
daily to obtain the overall score. Higher scores indicate a higher number
of therapeutic interventions.
¶To convert the values for glucose to millimoles per liter, multiply by
0.05551.
T
ABLE
1.
B
ASE
-L
INE
C
HARACTERISTICS
OF
THE
P
ATIENTS
.*
C
HARACTERISTIC
C
ONVENTIONAL
T
REATMENT
(N=783)
I
NTENSIVE
T
REATMENT
(N=765)
Male sex — no. (%) 557 (71) 544 (71)
Age — yr 62.2±13.9 63.4±13.6
Body-mass index† 25.8±4.7 26.2±4.4
Reason for intensive care — no. (%)
Cardiac surgery
Noncardiac indication
Neurologic disease, cerebral
trauma, or brain surgery
Thoracic surgery, respiratory
insufficiency, or both
Abdominal surgery or peritonitis
Vascular surgery
Multiple trauma or severe burns
Transplantation
Other
493 (63)
290 (37)
30 (4)
56 (7)
58 (7)
32 (4)
35 (4)
44 (6)
35 (4)
477 (62)
288 (38)
33 (4)
66 (9)
45 (6)
30 (4)
33 (4)
46 (6)
35 (5)
APACHE II score‡
First 24 hr
Median
Interquartile range
Second 24 hr
Median
Interquartile range
Score >9 in first 24 hr — no. (%)
9
7–13
9
6–13
458 (58)
9
7–13
9
6–13
429 (56)
TISS-28 score§
First 24 hr
Median
Interquartile range
Second 24 hr
Median
Interquartile range
43
36–47
38
32–44
43
37–46
38
31–43
Tertiary referral — no. (%) 135 (17) 126 (16)
History of cancer — no. (%) 119 (15) 122 (16)
History of diabetes — no. (%)
Treated with insulin
Treated with oral antidiabetic agent,
diet, or both
103 (13)
33 (4)
70 (9)
101 (13)
39 (5)
62 (8)
Blood glucose — no. (%)¶
>110 mg/dl
>200 mg/dl
598 (76)
101 (13)
557 (73)
81 (11)
Copyright © 2001 Massachusetts Medical Society. All rights reserved.
Downloaded from www.nejm.org on April 10, 2006 . This article is being provided free of charge for use in Viet Nam.
INTENSIVE INSULIN THERAPY IN CRITICALLY ILL PATIENTS
N Engl J Med, Vol. 345, No. 19
·
November 8, 2001
·
www.nejm.org
·
1361
of patients were sedated. This approach was considered most ob-
jective, but it inevitably reduced the APACHE II scores.
27
Blood was obtained on admission and subsequently every four
hours. The blood glucose level was measured on admission and
daily at 6 a.m., and daily maximal and minimal blood glucose levels
were determined. Laboratory staff were unaware of the treatment
assignments.
Blood cultures were obtained whenever the central body temper-
ature exceeded 38.5°C,
28,29
and the results were interpreted by an
investigator who was unaware of the treatment assignments. An
episode of septicemia was defined by the first positive culture in a
series. To identify bacteremia with coagulase-negative staphylococci,
identical strains (compared by antibiogram) in two or more pos-
itive blood cultures were required.
28,29
Weekly electromyographic screening for critical-illness polyneu-
ropathy was performed among patients who remained in the in-
tensive care unit for a week or more. The results were interpreted
by one electrophysiologist, who was unaware of the treatment as-
signments.
For patients who died, the cause of death was confirmed by post-
mortem examination performed by a pathologist who was unaware
of the treatment assignments.
Outcome Measures
The primary outcome measure was death from any cause during
intensive care. Secondary outcome measures were in-hospital death;
the number of days in the intensive care unit and the need for pro-
longed intensive care (more than 14 days) or readmission; the need
for ventilatory support, renal replacement therapy, or inotropic or
vasopressor support; critical-illness polyneuropathy; markers of in-
flammation (the C-reactive protein level, white-cell count, and body
temperature); bloodstream infection and use of antibiotics for more
than 10 days; transfusion requirements; and hyperbilirubinemia.
To minimize the possibility of bias caused by delays in the transfer
of patients to a regular ward because of the unavailability of beds,
patients were considered to be ready for discharge when they no
longer needed vital-organ support and were receiving at least two
thirds of their caloric intake by the normal enteral route. Use of in-
tensive care resources was assessed on the basis of cumulative TISS-
28 scores (the sum of daily scores), indicating the total number of
interventions per patient.
25
Statistical Analysis
We planned to enroll 2500 patients in order for the study to
have the capacity to detect an absolute difference in mortality be-
tween the treatment groups of 5 percent among patients who re-
mained in the intensive care unit for more than five days, and of
2 percent among all patients in intensive care (two-sided alpha
level, <0.05). Interim analyses of overall mortality in the inten-
sive care unit were performed at three-month intervals, with stop-
ping boundaries (two-sided alpha level, <0.01) designed to allow
early termination of the study. The fourth interim analysis indi-
cated that conventional treatment was inferior, and the study was
stopped.
Base-line and outcome variables were compared with the use of
Student’s t-test, the chi-square test, and the Mann–Whitney U test.
Adjustment for the sequential analysis of the primary outcome
variable (death during intensive care) was performed according to
the Lan and DeMets method.
30
Odds ratios were estimated on the
basis of multivariate logistic-regression analysis. The effect of in-
tensive insulin therapy on the time of death was assessed by Kap-
lan–Meier analysis and the Mantel–Cox log-rank test. Patients dis-
charged alive from the hospital were considered to have survived.
Data are presented as means ±SD or as medians with interquartile
ranges, unless otherwise indicated. All analyses were performed on
an intention-to-treat basis.
The sponsors of the study were not involved in the study design,
data collection, analysis or interpretation of the data, or preparation
of the manuscript.
RESULTS
Study Population
A total of 1548 patients were enrolled in the study.
The clinical and demographic characteristics of the
treatment groups were similar at randomization (Ta-
ble 1), and there were no significant differences with
respect to the delay in admission to the intensive care
unit, the presence of renal failure, the type of cardiac
surgery, or rates of preexisting diabetes and hyper-
glycemia at the time of admission.
The mean intake of nonprotein calories was 19.1±
7.1 kcal per kilogram per 24 hours in the conventional-
treatment group and 18.5±7.5 kcal per kilogram per
24 hours in the intensive-treatment group (P=0.2);
the highest intake of nonprotein calories in both
groups was 24±10 kcal per kilogram per 24 hours.
The mean nitrogen intake was 0.15±0.06 g per kil-
ogram per 24 hours in the conventional-treatment
group and 0.14±0.06 g per kilogram per 24 hours in
the intensive-treatment group (P=0.3), and the max-
imal nitrogen intake was 0.19±0.08 g per kilogram
per 24 hours in both groups.
Blood Glucose Control
In the intensive-treatment group, almost all the pa-
tients required exogenous insulin, and the morning
blood glucose level was maintained at a mean value
of 103±19 mg per deciliter (5.7±1.1 mmol per liter)
(Table 2). In the conventional-treatment group, the
morning blood glucose level was maintained at a mean
value of 153±33 mg per deciliter (8.5±1.8 mmol per
liter). Only 39 percent of the patients treated with the
*Plus–minus values are means ±SD. ICU denotes intensive care unit.
†P values were determined with the use of Student’s t-test, the Mann–
Whitney U test, or the chi-square test, as appropriate.
‡Values were calculated only for days on which insulin was given.
§To convert the values for glucose to millimoles per liter, multiply by
0.05551.
T
ABLE
2.
I
NSULIN
T
HERAPY
AND
C
ONTROL
OF
B
LOOD
G
LUCOSE
L
EVELS
.*
V
ARIABLE
C
ONVENTIONAL
T
REATMENT
(N=783)
I
NTENSIVE
T
REATMENT
(N=765)
P
V
ALUE
†
Administration of insulin
— no. (%)
307 (39.2) 755 (98.7) <0.001
Insulin dose — IU/day‡
Median
Interquartile range
33
17–56
71
48–100 <0.001
Duration of insulin use
— % of ICU stay
Median
Interquartile range
67
40–100
100 <0.001
Morning blood glucose
— mg/dl§
All patients
Patients receiving insulin
153±33
173±33
103±19
103±18
<0.001
<0.001
Copyright © 2001 Massachusetts Medical Society. All rights reserved.
Downloaded from www.nejm.org on April 10, 2006 . This article is being provided free of charge for use in Viet Nam.
1362
·
N Engl J Med, Vol. 345, No. 19
·
November 8, 2001
·
www.nejm.org
The New England Journal of Medicine
conventional approach received insulin; their mean
blood glucose level was 173±33 mg per deciliter
(9.6±1.8 mmol per liter), as compared with 140±25
mg per deciliter (7.8±1.4 mmol per liter) in the pa-
tients who did not receive insulin.
Hypoglycemia (defined as a blood glucose level of
40 mg per deciliter [2.2 mmol per liter] or less) oc-
curred in 39 patients in the intensive-treatment group
and in 6 patients in the conventional-treatment group.
In two patients who received intensive insulin therapy,
hypoglycemia was associated with sweating and agi-
tation, but there were no instances of hemodynamic
deterioration or convulsions.
Mortality
Thirty-five patients in the intensive-treatment group
(4.6 percent) died during intensive care, as compared
with 63 patients (8.0 percent) in the conventional-
treatment group, representing an apparent risk reduc-
tion of 42 percent (95 percent confidence interval,
22 to 62 percent) (Table 3 and Fig. 1). However, after
adjustment for repeated interim analyses,
30
the me-
dian unbiased estimate of the reduction in mortality
was 32 percent (adjusted 95 percent confidence in-
terval, 2 to 55 percent; P<0.04). Intensive insulin
therapy also reduced in-hospital mortality; the great-
est reduction involved deaths due to multiple-organ
failure with a septic focus, documented on postmor-
tem examination. The intervention was effective in
almost all subgroups of patients defined according to
the APACHE II and TISS-28 scores in the first 24
hours after admission (Fig. 2), and the results were
similar in patients who had undergone cardiac surgery
and those who had undergone other types of surgery.
The numbers of deaths during the first five days
of intensive care were similar in the two treatment
groups. The proportion of patients who required in-
tensive care for more than five days was similar in the
two groups (27 percent in the intensive-treatment
group and 31 percent in the conventional-treatment
group, P=0.1). Among these patients, the median
APACHE II score for the first 24 hours of intensive
care was the same in the two treatment groups (me-
dian score, 12); two thirds of patients in both groups
were admitted to the intensive care unit for reasons
other than cardiac surgery. The observed reduction in
mortality with intensive insulin therapy occurred ex-
clusively in this long-stay cohort (10.6 percent mortal-
ity in the intensive-treatment group vs. 20.2 percent
in the conventional-treatment group, P=0.005).
In a multivariate logistic-regression model, the inde-
pendent determinants of mortality were an APACHE
II score of 9 or higher for the first 24 hours of in-
tensive care, greater age, an indication for admission
*P values were determined with the use of the chi-square test. For the primary outcome variable (death during intensive
care), the P value has been corrected for the repeated interim analyses, according to the method of Lan and DeMets
30
;
the unadjusted P value is 0.005. Sequential interim analyses were not performed for the other variables, and nominal
(unadjusted) P values are given for these comparisons.
T
ABLE
3.
M
ORTALITY
.
V
ARIABLE
C
ONVENTIONAL
T
REATMENT
(N=783)
I
NTENSIVE
T
REATMENT
(N=765) P V
ALUE
*
Death during intensive care — no./total no. (%)
During first 5 days of intensive care
Among patients receiving intensive care for >5 days
63/783 (8.0)
14/783 (1.8)
49/243 (20.2)
35/765 (4.6)
13/765 (1.7)
22/208 (10.6)
<0.04 (adjusted)
0.9
0.005
Reason for intensive care
Cardiac surgery
Neurologic disease, cerebral trauma, or brain surgery
Thoracic surgery, respiratory insufficiency, or both
Abdominal surgery or peritonitis
Vascular surgery
Multiple trauma or severe burns
Transplantation
Other
25/493 (5.1)
7/30 (23.3)
10/56 (17.9)
9/58 (15.5)
2/32 (6.2)
3/35 (8.6)
1/44 (2.3)
6/35 (17.1)
10/477 (2.1)
6/33 (18.2)
5/66 (7.6)
6/45 (13.3)
2/30 (6.7)
4/33 (12.1)
2/46 (4.4)
0/35
No history of diabetes
No history of diabetes and >5 days of intensive care
History of diabetes
History of diabetes and >5 days of intensive care
57/680 (8.4)
45/218 (20.6)
6/103 (5.8)
4/25 (16.0)
31/664 (4.7)
20/187 (10.7)
4/101 (4.0)
2/21 (9.5)
Cause of death — no.
Multiple-organ failure with proven septic focus
Multiple-organ failure without detectable septic focus
Severe brain damage
Acute cardiovascular collapse
33
18
5
7
8
14
3
10
0.02
In-hospital death — no./total no. (%)
All patients
Patients receiving intensive care for >5 days
85/783 (10.9)
64/243 (26.3)
55/765 (7.2)
35/208 (16.8)
0.01
0.01
Copyright © 2001 Massachusetts Medical Society. All rights reserved.
Downloaded from www.nejm.org on April 10, 2006 . This article is being provided free of charge for use in Viet Nam.
INTENSIVE INSULIN THERAPY IN CRITICALLY ILL PATIENTS
N Engl J Med, Vol. 345, No. 19
·
November 8, 2001
·
www.nejm.org
·
1363
other than cardiac surgery, tertiary referral, and con-
ventional insulin treatment, but not a history of di-
abetes or hyperglycemia at the time of admission to
the intensive care unit.
Morbidity
A history of diabetes or hyperglycemia at the time
of admission did not affect measures of morbidity.
Intensive insulin therapy reduced the duration of in-
tensive care but not the overall length of stay in the
hospital. The rate of readmission to the intensive care
unit was the same in the two groups (2.1 percent).
Significantly fewer patients in the intensive-treatment
group than in the conventional-treatment group re-
quired prolonged ventilatory support and renal re-
placement therapy, whereas the proportion of patients
who needed inotropic or vasopressor support was the
same in the two groups (Table 4). The number of pa-
tients who had hyperbilirubinemia was also signifi-
cantly smaller in the intensive-treatment group than
in the conventional-treatment group.
Intensive insulin treatment reduced episodes of sep-
ticemia by 46 percent (95 percent confidence inter-
val, 25 to 67 percent) (Table 4). Of the episodes of
septicemia in the intensive-treatment group, 34 per-
cent were polymicrobial as compared with 23 percent
in the conventional-treatment group (P=0.2). Caus-
ative pathogens included coagulase-negative staphy-
lococci (accounting for 31.3 percent of all episodes
of septicemia), enterococcus species (14.7 percent),
nonfermenting gram-negative bacilli (14.7 percent),
inducible Enterobacteriaceae (12.6 percent), other En-
terobacteriaceae (8.4 percent), and
Staphylococcus au-
reus (7.7 percent).
Markers of inflammation were less frequently ab-
normal in the intensive-treatment group than in the
conventional-treatment group (P«0.02). The patients
who received intensive insulin therapy were less likely
to require prolonged use of antibiotics than were the
patients who received conventional treatment, an ef-
fect that was largely attributable to the lower rate of
bacteremia in the intensive-treatment group (75 per-
cent of patients who had bacteremia received anti-
biotics for more than 10 days, as compared with 10
percent of patients who did not have bacteremia;
P<0.001). Among patients with bacteremia, those
treated with intensive insulin therapy had a lower mor-
tality rate than those treated conventionally (12.5 per-
cent vs. 29.5 percent), although this difference was not
statistically significant. The use of medications other
than insulin or antibiotics did not differ significantly
between the two treatment groups.
Because intensive insulin therapy reduced the length
of stay in the intensive care unit among patients re-
quiring intensive care for more than five days, fewer
patients in the intensive-treatment group than in the
conventional-treatment group were screened for poly-
neuropathy (20.5 percent vs. 26.3 percent, P=0.007).
Among the patients who were screened, those receiv-
ing intensive insulin therapy were less likely to have
critical-illness polyneuropathy than were those receiv-
ing conventional treatment, and the cases that did
develop resolved more rapidly. In both groups, there
was a positive, linear correlation between the risk of
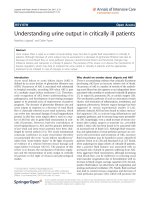
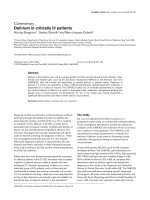
Figure 1. Kaplan–Meier Curves Showing Cumulative Survival of Patients Who Received Intensive In-
sulin Treatment or Conventional Treatment in the Intensive Care Unit (ICU).
Patients discharged alive from the ICU (Panel A) and from the hospital (Panel B) were considered to
have survived. In both cases, the differences between the treatment groups were significant (survival
in ICU, nominal P=0.005 and adjusted P<0.04; in-hospital survival, nominal P=0.01). P values were
determined with the use of the Mantel–Cox log-rank test.
0
100
0160
96
92
88
84
80
20 40 60 80 100120140
Days after AdmissionAB
Conventional treatment
Intensive treatment
Survival in ICU (%)
In-Hospital Survival (%)
0 25050 100 150 200
Days after Admission
Conventional treatment
Intensive treatment
0
100
96
92
88
84
80
Copyright © 2001 Massachusetts Medical Society. All rights reserved.
Downloaded from www.nejm.org on April 10, 2006 . This article is being provided free of charge for use in Viet Nam.
1364 · N Engl J Med, Vol. 345, No. 19 · November 8, 2001 · www.nejm.org
The New England Journal of Medicine
polyneuropathy and the mean blood glucose level.
In a multivariate analysis, independent predictors of
polyneuropathy were conventional insulin treatment
(odds ratio, 2.6; 95 percent confidence interval, 1.6
to 4.2), vasopressor support for more than three days
(odds ratio, 2.5; 95 percent confidence interval, 1.4
to 4.2), bacteremia (odds ratio, 2.3; 95 percent con-
fidence interval, 1.3 to 4.1), and renal replacement
therapy (odds ratio, 1.9; 95 percent confidence inter-
val, 1.0 to 3.8).
The number of patients who received red-cell trans-
fusions did not differ significantly between the two
groups. However, the median number of transfusions
in the intensive-treatment group was only half that
in the conventional-treatment group. This difference
was not due to more liberal use of transfusions in the
conventional-treatment group, as indicated by the low-
er hemoglobin and hematocrit values in that group.
The TISS-28 score on the last day in the intensive
care unit, an indication of how many therapeutic in-
terventions were still needed when patients were sent
to a regular ward, was the same in the two treatment
groups (a median score of 30). However, intensive in-
sulin treatment reduced the median cumulative TISS-
28 score by 23 percent among patients who remained
in the intensive care unit for more than five days.
25
DISCUSSION
The use of intensive insulin therapy to maintain
blood glucose at a level that did not exceed 110 mg
per deciliter substantially reduced mortality in the in-
tensive care unit, in-hospital mortality, and morbidity
among critically ill patients admitted to our intensive
care unit.
The limitations of this study should be noted. First,
it was not feasible to conduct the study in a strictly
blinded fashion because adjustment of the insulin dose
requires blood glucose monitoring. To minimize bias,
we assigned responsibility for adjustment of the in-
sulin dose to a team of nurses and to a study physi-
cian who was not taking part in clinical decisions, with
strictly blinded analysis of important outcome meas-
ures. Furthermore, the two treatment groups did not
differ in the use of medications other than insulin and
antibiotics, the latter most likely a consequence of the
effect of intensive insulin therapy on septicemia. Sec-
ond, since the study involved patients admitted to a
surgical intensive care unit, the results cannot be ex-
trapolated to patients in medical intensive care units or
those with severe illnesses that were not present in the
study population.
Intensive insulin treatment reduced the number of
deaths from multiple-organ failure with sepsis, regard-
less of whether there was a history of diabetes or hy-
perglycemia.
31
Since the introduction of mechanical
ventilation, few intensive care interventions have im-
proved survival. Treatment of sepsis with activated
protein C results in a 20 percent reduction in mor-
tality at 28 days.
32
Glycemic control is a preventive
approach that is more broadly applicable to critically
ill patients and that reduced mortality during inten-
sive care by more than 40 percent.
Intensive insulin therapy also reduced the use of
intensive care resources and the risk of complications
that are common among patients requiring intensive
care, including episodes of septicemia and a corre-
sponding need for prolonged antibiotic therapy. The
higher risk in the conventional-treatment group may
reflect the deleterious effects of hyperglycemia on mac-
rophage or neutrophil function
33-36
or insulin-induced
trophic effects on mucosal and skin barriers. Intensive
insulin treatment also prevented acute renal failure.
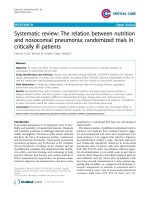
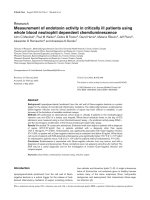
Figure 2. Number of Deaths in the Intensive Care Unit Accord-
ing to the Acute Physiology and Chronic Health Evaluation
(APACHE II) Score (Panel A) and the Simplified Therapeutic In-
tervention Scoring System (TISS-28) Score (Panel B) in the First
24 Hours.
Higher APACHE II scores indicate more severe illness, and high-
er TISS-28 scores indicate a higher number of therapeutic in-
terventions.
0
24
16–23 24–31 32–39 40–47 48–55 56–63
0–7 8–15 16–23 24–31 32–39 40–47
B
A
21
18
15
12
9
6
3
TI
SS
-2
8
Sco
r
e
No. of Deaths
0
30
Conventional treatment
Intensive treatment
25
20
15
10
5
APACHE II Score
No. of Deaths
Copyright © 2001 Massachusetts Medical Society. All rights reserved.
Downloaded from www.nejm.org on April 10, 2006 . This article is being provided free of charge for use in Viet Nam.
INTENSIVE INSULIN THERAPY IN CRITICALLY ILL PATIENTS
N Engl J Med, Vol. 345, No. 19 · November 8, 2001 · www.nejm.org · 1365
*To convert the value for creatinine to micromoles per liter, multiply by 88.4. To convert the value
for urea nitrogen to millimoles per liter, multiply by 0.357. To convert the value for bilirubin to mi-
cromoles per liter, multiply by 17.1.
†P values were determined with the use of the Mann–Whitney U test or the chi-square test, as
appropriate. Nominal (unadjusted) P values are given because sequential interim analyses were not
performed for measures of morbidity.
‡The analysis of the number of transfusions did not take the day of admission into account.
§TISS-28 denotes the Simplified Therapeutic Intervention Scoring System. Higher scores indicate
a higher number of therapeutic interventions.
TABLE 4. MORBIDITY.*
VARIABLE
CONVENTIONAL
T
REATMENT
(N=783)
I
NTENSIVE
T
REATMENT
(N=765) P V
ALUE†
Duration of intensive care — days
All patients
Median
Interquartile range
«5 Days
Median
Interquartile range
>5 days
Median
Interquartile range
3
2–9
2
2–3
15
9–27
3
2–6
2
2–3
12
8–20
0.2
0.2
0.003
Patients requiring >14 days of intensive care
— no. (%)
123 (15.7) 87 (11.4) 0.01
Duration of ventilatory support — days
All patients
Median
Interquartile range
«5 Days of intensive care
Median
Interquartile range
>5 Days of intensive care
Median
Interquartile range
2
1–6
1
1–2
12
7–23
2
1–4
1
1–2
10
6–16
0.06
0.9
0.006
Patients requiring >14 days of ventilatory
support — no. (%)
93 (11.9) 57 (7.5) 0.003
Inotropic or vasopressor treatment — no. (%) 586 (74.8) 574 (75.0) 0.9
Renal impairment — no. (%)
Peak plasma creatinine >2.5 mg/dl
Peak plasma urea nitrogen >54 mg/dl
Dialysis or continuous venovenous
hemofiltration
96 (12.3)
88 (11.2)
64 (8.2)
69 (9.0)
59 (7.7)
37 (4.8)
0.04
0.02
0.007
Hyperbilirubinemia (peak bilirubin >2 mg/dl)
— no. (%)
209 (26.7) 171 (22.4) 0.04
Bloodstream infection — no. (%)
Septicemia during intensive care
Treatment with antibiotics for >10 days
61 (7.8)
134 (17.1)
32 (4.2)
086 (11.2)
0.003
<0.001
Electromyographic evidence of critical-illness
polyneuropathy — no./total no. (%)
At any time
On more than 2 occasions
107/206 (51.9)
39/206 (18.9)
45/157 (28.7)
11/157 (7.0)
<0.001
0.001
Red-cell transfusions
Patients requiring transfusion — no. (%)
No. of transfusions/patient‡
Median
Interquartile range
243 (31.0)
2
1–3
219 (28.6)
1
1–2
0.3
<0.001
Cumulative TISS-28 score§
All patients
Median
Interquartile range
«5 Days of intensive care
Median
Interquartile range
>5 Days of intensive care
Median
Interquartile range
108
76–293
84
67–111
563
329–956
105
76–215
85
68–115
431
271–670
0.2
0.3
<0.001
Copyright © 2001 Massachusetts Medical Society. All rights reserved.
Downloaded from www.nejm.org on April 10, 2006 . This article is being provided free of charge for use in Viet Nam.
1366 · N Engl J Med, Vol. 345, No. 19 · November 8, 2001 · www.nejm.org
The New England Journal of Medicine
Aside from optimization of hemodynamic status, no
other strategy to prevent renal failure has proved ef-
fective.
37-40
The reduced number of transfusions in
the intensive-treatment group may reflect improved
erythropoiesis or reduced hemolysis, since this ben-
efit was associated with a lower incidence of hyper-
bilirubinemia. Alternatively, intensive insulin therapy
may reduce the risk of cholestasis, since adequate pro-
vision of glucose and insulin to hepatocytes is crucial
for normal choleresis.
41,42
The exact cause of critical-illness polyneuropathy
is unknown, but sepsis and the use of neuromuscular
blocking agents, corticosteroids, and aminoglycosides
are thought to have a role.
2-5
The reduction in the risk
of polyneuropathy with intensive insulin therapy, re-
gardless of the concomitant use of these medications,
suggests that hyperglycemia, insulin deficiency, or both
contribute to axonal dysfunction and degeneration.
43
The linear relation between blood glucose levels and
the risk of polyneuropathy suggests that maintenance
of the lowest possible level is necessary. The reduced
need for mechanical ventilation in patients who re-
ceived intensive insulin therapy is explained in part
by the reduced rate of critical-illness polyneuropathy,
though a direct anabolic effect of insulin on respira-
tory muscles
44
may also play a part. However, the ex-
act mechanisms by which morbidity and mortality
were reduced remain largely speculative, since the ef-
fects of glycemic control cannot be distinguished from
those of increased insulin levels.
Prospective studies of the effect of strict blood
glucose control in patients with type 1 or type 2 di-
abetes have not shown a reduction in mortality.
45,46
During pregnancy, however, this approach has been
shown to prevent intrauterine and perinatal death.
47
The results of our study offer a possible explanation
of the failure of growth hormone therapy as anabolic
treatment in patients with prolonged critical illness.
1
Growth hormone substantially aggravates insulin re-
sistance and hyperglycemia and doubles the mortality
rate among critically ill patients, mainly because of
multiple-organ failure and sepsis.
In conclusion, the use of exogenous insulin to main-
tain blood glucose at a level no higher than 110 mg
per deciliter reduced morbidity and mortality among
critically ill patients in the surgical intensive care unit,
regardless of whether they had a history of diabetes.
Supported by the University of Leuven, the Belgian Fund for Scientific
Research, the Belgian Foundation for Research in Congenital Heart Dis-
ease, and an unrestricted grant from Novo Nordisk. Dr. Bouillon holds a
J.J. Servier Diabetes Research Chair.
We are indebted to Ilse Milants, Jenny Gielens, An Andries, My-
riam Vandenbergh, and Viviane Celis for assistance with blood sam-
ples and data collection; to the clinical fellows in the Department of
Physical Medicine and Rehabilitation for electromyographic screen-
ing and to the intensive care fellows for APACHE II scoring; to the
nurses for TISS-28 scoring and excellent compliance with the study
protocol; to Drs. Catherine Ingels, Jan Muller, Lars Desmet, An Wal-
lijn, Herbert Fannes, Heidi Weyns, David Van Roosbroeck, and Car-
ine Van Dijcke for patient care; and to Dr. Annette Schuermans for
assistance with the diagnosis of bloodstream infections.
REFERENCES
1. Takala J, Ruokonen E, Webster NR, et al. Increased mortality associated
with growth hormone treatment in critically ill adults. N Engl J Med 1999;
341:785-92.
2. Zochodne DW, Bolton CF, Wells GA, et al. Critical illness polyneurop-
athy: a complication of sepsis and multiple organ failure. Brain 1987;110:
819-42.
3. Leijten FSS, de Weerd AW. Critical illness polyneuropathy: a review
of the literature, definition and pathophysiology. Clin Neurol Neurosurg
1994;96:10-9.
4. Webb AR, Shapiro MJ, Singer M, Suter PM, eds. Oxford textbook
of critical care. Oxford, England: Oxford University Press, 1999:490-5.
5. Bolton CF. Sepsis and the systemic inflammatory response syndrome:
neuromuscular manifestations. Crit Care Med 1996;24:1408-16.
6. Wolfe RR, Allsop JR, Burke JF. Glucose metabolism in man: responses
to intravenous glucose infusion. Metabolism 1979;28:210-20.
7. Wolfe RR, Herndon DN, Jahoor F, Miyoshi H, Wolfe M. Effect of se-
vere burn injury on substrate cycling by glucose and fatty acids. N Engl J
Med 1987;317:403-8.
8. Shangraw RE, Jahoor F, Miyoshi H, et al. Differentiation between sep-
tic and postburn insulin resistance. Metabolism 1989;38:983-9.
9. Mizock BA. Alterations in carbohydrate metabolism during stress:
a review of the literature. Am J Med 1995;98:75-84.
10. McCowen KC, Malhotra A, Bistrian BR. Stress-induced hyperglyce-
mia. Crit Care Clin 2001;17:107-24.
11. Fietsam R Jr, Bassett J, Glover JL. Complications of coronary artery
surgery in diabetic patients. Am Surg 1991;57:551-7.
12. O’Neill PA, Davies I, Fullerton KJ, Bennett D. Stress hormone and
blood glucose response following acute stroke in the elderly. Stroke 1991;
22:842-7.
13. Scott JF, Robinson GM, French JM, O’Connell JE, Alberti KG, Gray
CS. Glucose potassium insulin infusions in the treatment of acute stroke
patients with mild to moderate hyperglycemia: the Glucose Insulin in
Stroke Trial (GIST). Stroke 1999;30:793-9.
14. Malmberg K, Norhammar A, Wedel H, Ryden L. Glycometabolic
state at admission: important risk marker of mortality in conventionally
treated patients with diabetes mellitus and acute myocardial infarction:
long-term results from the Diabetes and Insulin-Glucose Infusion in Acute
Myocardial Infarction (DIGAMI) study. Circulation 1999;99:2626-32.
15. Malmberg K. Prospective randomised study of intensive insulin treat-
ment on long term survival after acute myocardial infarction in patients
with diabetes mellitus. BMJ 1997;314:1512-5.
16. Malmberg K, Ryden L, Efendic S, et al. A randomized trial of insulin-
glucose infusion followed by subcutaneous insulin treatment in diabetic pa-
tients with acute myocardial infarction (DIGAMI study): effects of mortal-
ity at 1 year. J Am Coll Cardiol 1995;26:57-65.
17. Van den Berghe G, Wouters P, Weekers F, et al. Reactivation of pitu-
itary hormone release and metabolic improvement by infusion of growth
hormone-releasing peptide and thyrotropin-releasing hormone in patients
with protracted critical illness. J Clin Endocrinol Metab 1999;84:1311-23.
18. Van den Berghe G, Baxter RC, Weekers F, Wouters P, Bowers CY,
Veldhuis JD. A paradoxical gender dissociation within the growth hor-
mone/insulin-like growth factor I axis during protracted critical illness.
J Clin Endocrinol Metab 2000;85:183-92.
19. Oritz A, Ziyadeh FN, Neilson EG. Expression of apoptosis-regulatory
genes in renal proximal tubular epithelial cells exposed to high ambient
glucose and in diabetic kidneys. J Investig Med 1997;45:50-6.
20. Said G, Goulon-Goeau C, Slama G, Tchobroutsky G. Severe early-
onset polyneuropathy in insulin-dependent diabetes mellitus: a clinical and
pathological study. N Engl J Med 1992;326:1257-63.
21. Levetan CS, Magee MF. Hospital management of diabetes. Endocrinol
Metab Clin North Am 2000;29:745-70.
22. Alberti KG, Zimmer PZ. Definition, diagnosis and classification of di-
abetes mellitus and its complications. 1. Diagnosis and classification of di-
abetes mellitus provisional report of a WHO consultation. Diabetic Med
1998;15:539-53.
23. Souba WW. Nutritional support. N Engl J Med 1997;336:41-8.
24. Knaus WA, Draper EA, Wagner DP, Zimmerman JE. APACHE II:
a severity of disease classification system. Crit Care Med 1985;13:818-29.
25. Miranda DR, de Rijk A, Schaufeli W. Simplified Therapeutic Interven-
tion Scoring System: the TISS-28 items — results from a multicenter study.
Crit Care Med 1996;24:64-73.
26. Keene AR, Cullen DJ. Therapeutic Intervention Scoring System:
update 1983. Crit Care Med 1983;11:1-3.
Copyright © 2001 Massachusetts Medical Society. All rights reserved.
Downloaded from www.nejm.org on April 10, 2006 . This article is being provided free of charge for use in Viet Nam.
INTENSIVE INSULIN THERAPY IN CRITICALLY ILL PATIENTS
N Engl J Med, Vol. 345, No. 19 · November 8, 2001 · www.nejm.org · 1367
27. Knauss WA. Measuring the Glasgow Coma Scale in the intensive care
unit: potentials and pitfalls. Intensive Care World 1995;11:102-3.
28. Weinstein MP, Towns ML, Quartey SM, et al. The clinical significance
of positive blood cultures in the 1990s: a prospective comprehensive eval-
uation of the microbiology, epidemiology, and outcome of bacteremia and
fungemia in adults. Clin Infect Dis 1997;24:584-602.
29. Weinstein MP, Mirrett S, Van Pelt L, et al. Clinical importance of
identifying coagulase-negative staphylococci isolated from blood cultures:
evaluation of Microscan Rapid and Dried Overnight Gram-Positive panels
versus a conventional reference method. J Clin Microbiol 1998;36:2089-
92.
30. Lan KKG, DeMets DL. Discrete sequential boundaries for clinical tri-
als. Biometrika 1983;70:659-63.
31. Capes SE, Hunt D, Malmberg K, Gerstein HC. Stress hyperglycemia
and increased risk of death after myocardial infarction in patients with and
without diabetes: a systematic overview. Lancet 2000;355:773-8.
32. Bernard GR, Vincent J-L, Laterre P-F, et al. Efficacy and safety of re-
combinant human activated protein C for severe sepsis. N Engl J Med
2001;344:699-709.
33. Rayfield EJ, Ault MJ, Keusch GT, Brothers MJ, Nechemias C, Smith
H. Infection and diabetes: the case for glucose control. Am J Med 1982;
72:439-50.
34. Geerlings SE, Hoepelman AI. Immune dysfunction in patients with
diabetes mellitus (DM). FEMS Immunol Med Microbiol 1999;26:259-
65.
35. Rassias AJ, Marrin CA, Arruda J, Whalen PK, Beach M, Yeager MP.
Insulin infusion improves neutrophil function in diabetic cardiac surgery
patients. Anesth Analg 1999;88:1011-6.
36. Losser M-R, Bernard C, Beaudeux J-L, Pison C, Payen D. Glucose
modulates hemodynamic, metabolic, and inflammatory responses to lipo-
polysaccharide in rabbits. J Appl Physiol 1997;83:1566-74.
37. Australian and New Zealand Intensive Care Society (ANZICS) Clinical
Trials Group. Low-dose dopamine in patients with early renal dysfunction:
a placebo-controlled randomised trial. Lancet 2000;356:2139-43.
38. Lassnigg A, Donner E, Grubhofer G, Presterl E, Druml J, Hiesmayr
M. Lack of renoprotective effects of dopamine and furosemide during car-
diac surgery. J Am Soc Nephrol 2000;11:97-104.
39. Lewis J, Salem MM, Chertow GM, et al. Atrial natriuretic factor in
oliguric acute renal failure. Am J Kidney Dis 2000;36:767-74.
40. Thadhani R, Pascual M, Bonventre JV. Acute renal failure. N Engl J
Med 1996;334:1448-60.
41. Jones RS, Putnam W, Andersen DK, Hanks JB, Lebovitz HE. Insu-
lin’s effect on bile flow and lipid excretion during euglycemia and hypogly-
cemia. Dig Dis Sci 1984;29:33-9.
42. Garcia-Marin JJ, Villanueva GR, Esteller A. Diabetes-induced chole-
stasis in the rat: possible role of hyperglycemia and hypoinsulinemia. Hep-
atology 1988;8:332-40.
43. Sidenius P. The axonopathy of diabetic neuropathy. Diabetes 1982;31:
356-63.
44. Ferrando AA, Chinkes DL, Wolf SE, Matin S, Herndon DN, Wolfe
RR. A submaximal dose of insulin promotes net skeletal muscle protein
synthesis in patients with severe burns. Ann Surg 1999;229:11-8.
45. The Diabetes Control and Complications Trial Research Group. The
effect of intensive treatment of diabetes on the development and progres-
sion of long-term complications in insulin-dependent diabetes mellitus.
N Engl J Med 1993;329:977-86.
46. UK Prospective Diabetes Study (UKPDS) Group. Intensive blood-
glucose control with sulphonylureas or insulin compared with conventional
treatment and risk of complications in patients with type 2 diabetes
(UKPDS 33). Lancet 1998;352:837-53.
47. Hawthorne G, Irgens LM, Lie RT. Outcome of pregnancy in diabetic
women in northeast England and in Norway, 1994-7. BMJ 2000;321:730-1.
Copyright © 2001 Massachusetts Medical Society.
RECEIVE THE JOURNAL’ S TABLE OF CONTENTS
EACH WEEK BY E-MAIL
To receive the table of contents of the
New England Journal of Medicine by e-mail
every Wednesday evening and access our archives
of research articles (>6 months old),
you can sign up through our Web site at:
Copyright © 2001 Massachusetts Medical Society. All rights reserved.
Downloaded from www.nejm.org on April 10, 2006 . This article is being provided free of charge for use in Viet Nam.