Báo cáo khoa học: "Continuously assessed right ventricular end-diastolic volume as a marker of cardiac preload and fluid responsiveness in mechanically ventilated cardiac surgical patients" pdf
Bạn đang xem bản rút gọn của tài liệu. Xem và tải ngay bản đầy đủ của tài liệu tại đây (309.96 KB, 8 trang )
Open Access
Available online />R226
Vol 9 No 3
Research
Continuously assessed right ventricular end-diastolic volume as a
marker of cardiac preload and fluid responsiveness in
mechanically ventilated cardiac surgical patients
Christoph Wiesenack
1
, Christoph Fiegl
2
, Andreas Keyser
3
, Sven Laule
4
, Christopher Prasser
1
and
Cornelius Keyl
5
1
Consultant, Department of Anesthesiology, University Hospital Regensburg, Regensburg, Germany
2
Resident, Department of Anesthesiology, University Hospital Regensburg, Regensburg, Germany
3
Staff Surgeon, Department of Cardiothoracic and Vascular Surgery, University Hospital Regensburg, Regensburg, Germany
4
Staff Anesthesiologist, Department of Anesthesiology, Heart-Center Bad Krozingen, Bad Krozingen, Germany
5
Consultant, Department of Anesthesiology, Heart-Center Bad Krozingen, Bad Krozingen, Germany
Corresponding author: Christoph Wiesenack,
Received: 15 Oct 2004 Revisions requested: 18 Jan 2005 Revisions received: 1 Feb 2005 Accepted: 18 Feb 2005 Published: 1 Apr 2005
Critical Care 2005, 9:R226-R233 (DOI 10.1186/cc3503)
This article is online at: />© 2005 Wiesenack et al; licensee BioMed Central Ltd.
This is an Open Access article distributed under the terms of the Creative Commons Attribution License ( />2.0), which permits unrestricted use, distribution, and reproduction in any medium, provided the original work is properly cited.
Abstract
Introduction Assessing cardiac preload and fluid
responsiveness accurately is important when attempting to
avoid unnecessary volume replacement in the critically ill patient,
which is associated with increased morbidity and mortality. The
present clinical trial was designed to compare the reliability of
continuous right ventricular end-diastolic volume (CEDV) index
assessment based on rapid response thermistor technique,
cardiac filling pressures (central venous pressure [CVP] and
pulmonary capillary wedge pressure [PCWP]), and
transesophageal echocardiographically derived evaluation of
left ventricular end-diastolic area (LVEDA) index in predicting
the hemodynamic response to volume replacement.
Methods We studied 21 patients undergoing elective coronary
artery bypass grafting. After induction of anesthesia,
hemodynamic parameters were measured simultaneously
before (T1) and 12 min after volume replacement (T2) by
infusion of 6% hydroxyethyl starch 200/0.5 (7 ml/kg) at a rate of
1 ml/kg per min.
Results The volume-induced increase in thermodilution-derived
stroke volume index (SVI
TD
) was 10% or greater in 19 patients
and under 10% in two. There was a significant correlation
between changes in CEDV index and changes in SVI
TD
(r
2
=
0.55; P < 0.01), but there were no significant correlations
between changes in CVP, PCWP and LVEDA index, and
changes in SVI
TD
. The only variable apparently indicating fluid
responsiveness was LVEDA index, the baseline value of which
was weakly correlated with percentage change in SVI
TD
(r
2
=
0.38; P < 0.01).
Conclusion An increased cardiac preload is more reliably
reflected by CEDV index than by CVP, PCWP, or LVEDA index
in this setting of preoperative cardiac surgery, but CEDV index
did not reflect fluid responsiveness. The response of SVI
TD
following fluid administration was better predicted by LVEDA
index than by CEDV index, CVP, or PCWP.
Introduction
Accurate evaluation of cardiac performance and preload sta-
tus, and assessment of fluid responsiveness are important
goals in the treatment of critically ill patients. Despite the cur-
rent controversy surrounding the usefulness of and risks asso-
ciated with the pulmonary artery catheter (PAC) [1,2], the PAC
remains more frequently used for monitoring and is preferred
over transesophageal echocardiography (TEE) by cardiovas-
cular anaesthesiologists [3]. However, it has been demon-
strated that PAC-derived filling pressures are of little help
when making decisions regarding adequate volume therapy.
Nevertheless, the majority of intensive care unit (ICU)
CCO = continuous cardiac output; CEDV = continuous right ventricular end-diastolic volume; CI = cardiac index; CO = cardiac output; CVP = central
venous pressure; HR = heart rate; ICU = intensive care unit; LVEDA = left ventricular end-diastolic area; PAC = pulmonary artery catheter; PCWP =
pulmonary capillary wedge pressure; RVEF = right ventricular ejection fraction; RVEDV = right ventricular end-diastolic volume; SV = stroke volume;
SVI
TD
= thermodilution-derived stroke volume index; TEE = transesophageal echocardiography.
Critical Care Vol 9 No 3 Wiesenack et al.
R227
physicians use filling pressures in their decision making
regarding volume replacement to improve hemodynamics.
This accentuates the need for reliable indicators of fluid
responsiveness so that needless or even deleterious volume
replacement associated with increased morbidity and mortal-
ity may be avoided in critically ill patients [4]. Several markers
of ventricular preload, specifically intrathoracic blood volume
[5,6], TEE-derived assessment of left ventricular end-diastolic
area (LVEDA) [7,8], and cyclic fluctuation in arterial pressure
wave that occurs in mechanically ventilated patients [7,9-14],
have been tested as predictors of fluid responsiveness, some
with excellent results. However, apart from pulse contour anal-
ysis, which has never been found in positive-pressure ventila-
tion to reflect actual stroke volume variation [15,16], none of
the techniques for assessing preload can be used continu-
ously or routinely in most patients.
Several studies have emphasized the good correlation
between estimates of right ventricular end-diastolic volume
(RVEDV) by thermodilution-derived right ventricular ejection
fraction (RVEF) and surrogates of stroke volume [17-20].
However, the thermodilution technique for assessing RVEDV
is still intermittent, and the value of RVEDV as a marker of fluid
responsiveness in critically ill patients is controversial [20-22].
A recently available Swan–Ganz catheter with a rapid
response thermistor permits nearly continuous assessment of
cardiac output (CO), RVEF and RVEDV, which should be
more applicable in the ICU. The measurement variability asso-
ciated with the intermittent bolus technique is eliminated by
this catheter, and continuously assessed RVEDV (CEDV)
should be more accurate than RVEDV based on intermittent
thermodilution; therefore, CEDV may be a valuable marker of
cardiac preload and a predictor of fluid responsiveness.
The purpose of the present study was to compare the accu-
racy of CEDV derived using a new right-heart ejection fraction
catheter and commonly used preload parameters (central
venous pressure [CVP], pulmonary capillary wedge pressure
[PCWP], and transesophageal echocardiography [TEE]-
derived assessment of LVEDA) in predicting the response of
stroke volume to volume replacement in mechanically venti-
lated cardiac surgical patients.
Materials and methods
After obtaining approval from the local ethics committee and
written informed consent from all participants, we studied 21
patients (17 male; aged 53–78 years, mean 65.7 years)
undergoing elective coronary artery bypass grafting. Patients
with valvular heart disease, intracardiac shunts, regional myo-
cardial asynchrony, peripheral vascular disease, preoperative
dysrhythmias, and an ejection fraction under 30 % were
excluded from the study. Dynamic variables, such as pulse
pressure variation, were not measured to assess fluid respon-
siveness in our investigation.
All patients received an arterial catheter for continuous moni-
toring of arterial blood pressure (Siemens monitor SC 9000;
Siemens AG, Erlangen, Germany). Anesthesia was induced
with fentanyl (5 µg/kg) followed by etomidate until loss of con-
sciousness and pancuronium (100 µg/kg), and maintained
using 1.5% sevoflurane end-expiratory, supplemented with
bolus doses of fentanyl (up to 20 µg/kg) and pancuronium (50
µg/kg) for neuromuscular blockade. Mechanical ventilation
(without positive end-expiratory pressure) at a constant tidal
volume of 7 ml/kg to an end-tidal partial carbon dioxide tension
of 30–35 mmHg was maintained at a inspired fractional oxy-
gen of 0.5 throughout the study.
After induction of anesthesia, a 7.5 Fr right-heart ejection frac-
tion catheter (CCOmboV 774HF75; Edwards Lifesciences,
Irvine, CA, USA) was inserted via an 8.5 Fr introducer into the
right internal jugular vein and connected to a Vigilance Monitor
system (Edwards Lifesciences) for continuous assessment of
CO (CCO), CEDV and of RVEF, and for determination of CO
using the intermittent thermodilution technique (CO
TD
).
The methodology of CCO measurement, based on the pulsed
warm thermodilution technique, was described previously [23]
and involves the release of small pulses of heat from a thermal
coil mounted on the PAC at the level of the right ventricle. To
reflect sudden changes in CO, the Vigilance Monitor provides
a STAT mode of operation, which has been shown to permit
accurate measurement of CCO [24]. The software algorithm
for STAT CCO does not contain a moving average filter but
depends on some previous data for artifact suppression. With-
out user calibration, CCO is computed from the area under the
thermodilution curve, and every 30–60 s the displayed CCO
is updated.
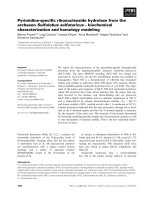
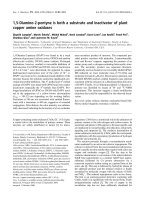
The new CEDV algorithm uses the slaved electrocardiograph
signal and generates a relaxation waveform, which resembles
the bolus thermodilution washout decay curve. The waveform
is based on the repeating on–off CCO input signal and is gen-
erated by accumulating the temperature change for each on
and each off segment of the input signal (Fig. 1). Calculation
of RVEF is based on estimation of the exponential decay time
constant (τ) of this curve and heart rate (HR): RVEF = 1 - exp
(-60/ [τ × HR]). CEDV, which is based on CCO, HR and
RVEF, is calculated as follows: CEDV = (CCO/HR)/RVEF. It
includes the whole range of temperatures of the thermodilu-
tion curve (Fig. 1).
CO
TD
measurements were performed by injection of 10 ml
iced saline solution via the CVP port and subsequent detec-
tion by the thermistor embedded in the PAC. An average of
three measurements, all taken within a 10% range randomly
distributed over the respiratory cycle, was calculated using the
Stewart–Hamilton formula.
Available online />R228
The TEE probe (OmniPlane II probe 21369A and SONOS
5500 Phased Array Imaging System; Philips Medical Systems,
DA Best, The Netherlands) was positioned to obtain a trans-
gastric midpapillary short-axis view of the left ventricle. This
position was maintained over the whole period of data acqui-
sition. Echocardiographic images and electrocardiograms
were recorded together, and end-diastole was defined as the
greatest left ventricular cross-sectional area immediately after
the R-wave peak on the electrocardiogram.
Correspondingly, end-systole was defined as the smallest left
ventricular dimension during the last half of the T wave. An
independent reviewer, who was blinded to the condition of the
trial participants, analyzed TEE images. LVEDA and left ven-
tricular end-systolic area were traced edge to edge, including
the papillary muscles. Fractional area change was calculated
as (LVEDA – left ventricular end-systolic area)/LVEDA. Three
measurements, performed at end-expiration, were analyzed
and averaged.
All hemodynamic parameters were measured simultaneously
after induction of anesthesia, when CCO had stabilized (T1).
A second measurement was performed (T2) 12 min after vol-
ume replacement by infusion of 6% hydroxyethyl starch 200/
0.5 (7 ml/kg) at a rate of 1 ml/kg per min (mean 579 ml). Meas-
urements were taken in a hemodynamically steady state, in the
absence of vasoactive drugs. Patients were classified as
responders to volume loading if the increase in thermodilution-
derived stroke volume index (SVI
TD
) was 10% or greater, or as
nonresponders if the increase in SVI
TD
was under 10%.
Statistical analysis
For statistical analysis, all volume variables were indexed to
body surface area. Statistical analysis was performed using
the SPSS 12.0 software (SPSS Inc., Chicago, IL, USA). After
assessment of normal distribution using the Lilliefors modifica-
tion to the Kolmogorov–Smirnov test, the Student's t-test was
used to compare variables. Because the thermodilution tech-
nique still represents the 'gold standard' for assessment of
cardiac index (CI), we conducted linear regression analyses
between changes in variables that reflect preload (CEDV
index, CVP, PCWP, and LVEDA index) and changes in the
preload-dependent variable SVI
TD
, and between baseline (T1)
values of variables that reflect preload (CEDV index, CVP,
PCWP, and LVEDA index) and the change in SVI
TD
(∆SVI
TD
;
expressed as a percentage). P < 0.05 was considered statis-
tically significant.
Results
Demographic data for the patients included in the present
study are summarized in Table 1.
Except for HR, all hemodynamic parameters changed signifi-
cantly after volume replacement (Table 2). The volume-
induced increase in SVI
TD
was 10% or greater (range 21.8–
93.4%) in 19 patients (responders) and under 10% in two
patients (nonresponders).
Linear regression analysis between changes in CEDV index
(∆CEDV index) and ∆SVI
TD
revealed a significant correlation
(r
2
= 0.55; P < 0.01), but linear regression analysis between
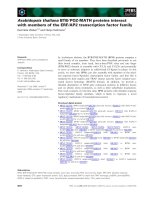
Figure 1
CEDV assessmentCEDV assessment. Shown is a modified algorithm block diagram for continuous right ventricular end-diastolic volume (CEDV) assessment. CCO =
continuous cardiac output; CEDV = continuous right ventricular end-diastolic volume; HR = heart rate; PRBS = Pseudo-Random Binary Sequence;
REF = right ventricular ejection fraction; τ = exponential decay time constant. Courtesy of Edwards Lifesciences, Unterschleissheim, Germany.
Critical Care Vol 9 No 3 Wiesenack et al.
R229
changes in CVP, PCWP and LVEDA index, and ∆SVI
TD
did not
identify any significant correlations among variables. LVEDA
index at baseline and the percentage ∆SVI
TD
were weakly cor-
related (r
2
= 0.38; P < 0.01), but linear regression analysis
between the remaining variables reflecting preload (CEDV
index, CVP, and PCWP) did not reveal any significant relation-
ships (Fig. 2). Variables reflecting systolic function – RVEF
and fractional area change – remained constant, without a sig-
nificant relationship between them.
Discussion
Over recent years numerous studies have been performed to
evaluate the usefulness of thermodilution-derived estimates of
RVEDV index in a variety of clinical situations [17-20,25-28].
Several investigators emphasized the good correlation
between RVEDV index and CI [17-20], suggesting that a vol-
umetric assessment of cardiac preload may provide a more
useful evaluation of ventricular filling than that offered by the
assessment of cardiac filling pressures. A previous study
found that a RVEDV index greater than 138 ml/m
2
was asso-
ciated with lack of response but that RVEDV index below 90
ml/m
2
was associated with a high rate of response to fluid
administration [18]. In contrast to these findings, Wagner and
Leatherman [22] reported a positive response to volume load-
ing in a number of patients with an RVEDV index above 138
ml/m
2
and a lack of response in some patients with an RVEDV
index below 90 ml/m
2
. Furthermore, the response to volume
loading was rather unpredictable when RVEDV index ranged
between these extremes. Based on those findings, no thresh-
old value may be proposed to discriminate between respond-
ers and nonresponders before fluid application [18,21].
Nevertheless, most authors stated that thermodilution-derived
estimates of RVEDV index appeared to be better indicators of
cardiac preload [19,27,29] and can predict preload recruita-
ble increases in SVI more accurately than can cardiac filling
pressures [17,18].
In the present study ∆CEDV index was significantly correlated
with ∆SVI
TD
, whereas there was a lack of correlations between
changes in the remaining preload-indicating variables and
∆SVI
TD
, suggesting that increased cardiac preload is more
reliably reflected by CEDV index than by CVP, PCWP, or
LVEDA index. Some investigators questioned the clinical sig-
nificance of correlation between RVEDV index and continu-
ously assessed CI, but Durham [19] and Nelson [30] and their
groups demonstrated that mathematical coupling does not
account for the relationship between variables.
Table 1
Demographic data and preoperative risk factors
Parameters Value
Demographic data
Age (years) 65.7 ± 6.1
Sex (male/female; % female) 17/4 (19.0%)
BMI (kg/m
2
) 29.1 ± 2.9
LVEF (%) 52.9 ± 13.7
LVEDP (mmHg) 12.9 ± 5.7
Preoperative risk factors (n [%])
Diabetes 8 (38%)
Hypertension 17 (81%)
Smoking 6 (28%)
Hyperlipidemia 13 (62%)
Myocardial infarction 0 (0%)
Obesity 9 (43%)
History of stroke 2 (9.5%)
PVD 4 (19%)
PAH 0 (0%)
COPD 3 (14%)
Renal disease 4 (19%)
Data are expressed as mean ± standard deviation, or as frequency distributions (n) and simple percentages (%). BMI, body mass index; COPD =
chronic obstructive pulmonary disease; LVEDP = left ventricular end-diastolic pressure; LVEF, left ventricular ejection fraction; PAH = pulmonary
arterial hypertension; PVD = peripheral vascular disease.
Available online />R230
Several authors described RVEDV index as a marker of car-
diac preload, indicated by the linear correlation between CI
and RVEDV index [17-20]. Although a linear correlation
between variables seems unlikely because measurements
might have been performed at different operating points on the
nonlinear curve describing the relationship between end-
diastolic volume and stroke volume, the authors stated that
RVEDV index could accurately predict preload recruitable
increase in CI [17,18]. However, validation of a variable as an
indicator of preload requires, in addition to demonstrations
that the variable increases with fluid loading and that the
increase is related to an increase in stroke volume, the demon-
stration that this variable does not change with an intervention
that alters cardiac contractility (e.g. administration of inotropic
agents). In most of studies preload-indicating variables were
not tested in the presence of inotropic drugs, and therefore the
hypothesis that RVEDV index is an accurate indicator of
preload has not yet been proven. Accordingly, assuming that
changes in myocardial contractility or afterload did not occur
during the study period and measurements were performed in
the steep part of the Frank–Starling curve, the significant rela-
tionship between CEDV index and CI in our study may merely
indicate that an increased cardiac preload is reliably reflected
by CEDV index.
It should be noted that the terms 'cardiac preload' and 'fluid
responsiveness' are not exchangeable. The increase in SVI
depends on ventricular function; a decrease in ventricular con-
tractility decreases the slope of the relationship between end-
diastolic volume and stroke volume [31] and moves the Frank–
Starling curve to the right. Therefore, patients with a dilated left
ventricle could still respond to fluid despite increased meas-
ures of static cardiac preload. Consequently, fluid responsive-
ness, defined as the response of SVI to volume challenge [32],
cannot be accurately predicted simply by assessing cardiac
preload.
For this reason, the more relevant question concerns the value
of RVEDV index as an indicator of fluid responsiveness, but
until now only limited and inconsistent information has been
available regarding the value of this variable [20,22]. A variable
is a predictor of fluid responsiveness if there is a relationship
between the baseline value of that variable and changes in SVI
after fluid loading. Reuse and coworkers [20] demonstrated a
weak correlation (r
2
= 0.19; P < 0.01) between the response
to fluid challenge and baseline RVEDV index in 41 critically ill
patients. Wagner and Leatherman [22] found a comparable,
modest correlation among variables (r
2
= 0.19; P < 0.05), but
they stated that RVEDV index was not a reliable predictor of
response to fluid.
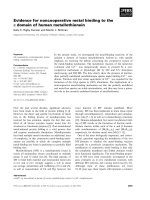
In the present study, baseline values of CEDV index were not
correlated with changes in SVI
TD
(Fig. 2a). Furthermore, using
previously suggested criteria [15], neither a very high (>138
ml/m
2
) nor a very low (<90 ml/m
2
) CEDV index proved to be a
reliable predictor of hemodynamic response to volume chal-
lenge. In accordance with Wagner et al [22], even one patient
with markedly elevated CEDVI (159 ml/m2) was able to
increase SVI in response to a fluid challenge in this study. This
phenomenon may be accounted for by the fact that the left
ventricular response to fluid loading may be predicted by the
right ventricular volume only in a limited manner. The optimal
CEDV index should be determined individually for each
patient. Consequently, patients should not be resuscitated to
an absolute CEDV index, but rather based upon their individual
response of CEDV index and CCI to fluid administration.
A factor that could possibly affect the accuracy of CEDV index
is the presence of a low RVEF [22], because CEDV index is
calculated as the quotient of SVI and RVEF. The mean RVEF
for the patients studied was 30.7 ± 9.1% at baseline, which is
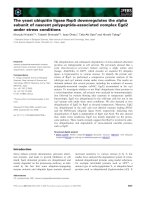
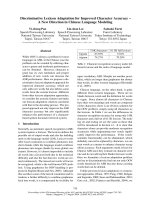
Figure 2
Linear regression analysesLinear regression analyses. Linear regression analysis between (a)
changes in thermodilution-derived stroke volume index (∆SVI
TD
) and
baseline values of continuously assessed right ventricular end-diastolic
volume index (CEDVI), and between (b) ∆SVI
TD
and baseline values of
transesophageal echocardiographically derived left ventricular end-
diastolic area index (LVEDAI).
Critical Care Vol 9 No 3 Wiesenack et al.
R231
markedly lower than in the study conducted by Diebel and
coworkers [18] (38 ± 9%). It is possible that CEDV index is a
better predictor of response to volume in patients with higher
RVEF. Another factor that should be taken into account was
mentioned by Michard and coworkers [21,31]. The increase in
ventricular end-diastolic volumes as a result of fluid challenge
depends on the partitioning of fluid into different cardiovascu-
lar compartments organized in series. When ventricular capac-
itance is increased, volume loading will increase intravascular
blood volume but not necessarily cardiac preload [31].
The results of the present investigation suggest that LVEDA
index is a better predictor of fluid responsiveness than is
CEDV index, and is even better than CVP or PCWP, as indi-
cated by the weak correlation between baseline value of
LVEDA index and the resulting increase in SVI
TD
following fluid
loading (Fig. 2b). These findings are in accordance with those
of other studies [7,13] and emphasize the importance of TEE
in detecting acute changes in hemodynamics. However, the
short-axis view provides only an area, not a volume, and the
assumption that this area correlates with a volume is only valid
when there are no regional contraction abnormalities [28,32].
The findings of recent studies demonstrate a limited relation-
ship between hemodynamic and echocardiographic evalua-
tion of left ventricular performance [33] and the minimal value
of LVEDA index in discriminating responders from
nonresponders [7]. The analysis presented in Fig. 2b shows
the considerable influence of two data points corresponding
to relative increases in SVI of about 77% and 94%. For the
other patients, exhibiting relative increases in stroke volume of
10–40%, LVEDA index could not predict reliably the magni-
tude of this response. Furthermore, echocardiography
requires an experienced investigator, is sometimes impossible
to perform, and its availability as a device for continuous
assessment of hemodynamics in the ICU is limited.
Limitations
Monitoring of CEDV index can be unreliable in the presence of
severe tricuspid valve insufficiency or during conditions of
unsteady or rapid changing blood temperature. Furthermore,
tachycardia at rates in excess of 150 beats/min will prevent
accurate measurement of the patient's R–R interval.
For ethical reasons, assessment of the hemodynamic
response of CEDV index was only be performed by a unidirec-
tional preload change. Therefore, this parameter should be
evaluated additionally under hemorrhage conditions in an ani-
mal experimental setting concerning its relative correctness.
In this setting of preoperative cardiac surgery, characterized
by preoperative fasting, diuretic therapy, and the vasodilatory
effect of sevoflurane, relative hypovolemia is common and
could account for the fact that most of the patients responded
to fluid. The small number of patients in the nonresponder
Table 2
Hemodynamic variables at sample points T1 and T2
Variable T1 T2 p-value
HR (beats/min) 62.2 ± 10.7 60.7 ± 8.4 NS
MAP (mmHg) 70.1 ± 10.9 82.2 ± 9.8 <0.01
CVP (mmHg) 10.9 ± 2.2 13.4 ± 2.3 <0.01
PCWP (mmHg) 11.6 ± 2.6 15.2 ± 2.4 <0.01
MPAP (mmHg) 20.5 ± 2.8 23.9 ± 4.1 <0.01
SVRI (dyne· s/cm
5
·m
2
) 2878 ± 698 2540 ± 394 <0.01
CI
TD
(l/min·m
2
) 1.70 ± 0.20 2.22 ± 0.23 <0.01
SVI
TD
(ml/m
2
) 28.3 ± 6.4 37.2 ± 6.1 <0.01
CCI (l/min·m
2
) 1.71 ± 0.26 2.20 ± 0.23 <0.01
CEDVI (ml/m
2
) 95.4 ± 21.0 122.1 ± 24.4 <0.01
RVEF (%) 30.7 ± 9.1 31.7 ± 8.4 NS
SvO
2
(%) 73.5 ± 4.3 77.1 ± 3.8 <0.01
LVEDAI (cm
2
/m
2
) 11.1 ± 4.1 12.8 ± 4.6 <0.01
FAC (%) 38.2 ± 9.6 37.9 ± 8.4 NS
Times T1 and T2 are before volume replacement and 12 min after volume replacement, respectively. CCI, continuous cardiac index; CEDVI,
continuous right ventricular end-diastolic volume index; CI, cardiac index; CVP, central venous pressure; FAC, fractional area change; HR, heart
rate; LVEDAI, left ventricular end-diastolic area index; MAP, mean arterial pressure; MPAP, mean pulmonary arterial pressure; PCWP, pulmonary
capillary wedge pressure; SVI, stroke volume index; SVRI, systemic vascular resistance index; RVEF, right ventricular ejection fraction; SvO
2
,
mixed venous oxygen saturation.
Available online />R232
group makes any conclusion regarding possible differences in
any of the variables between responders and nonresponders
difficult.
Conclusion
Despite the limitations mentioned above, the results of the
present study demonstrated that an increased cardiac preload
is more reliably reflected by CEDV index than by CVP, PCWP
or LVEDA index in this setting of preoperative cardiac surgery.
However, CEDV index failed to be a variable of fluid respon-
siveness. The response of SVITD subsequent to fluid adminis-
tration is better predicted by LVEDA index than by CEDV
index.
Competing interests
The author(s) declare that they have no competing interests.
Authors' contributions
CW designed the study, processed the data, and wrote the
manuscript. CF collected the clinical data. AK collected the
clinical data and participated in the study design. SL collected
the clinical data. CP designed the study and collected the clin-
ical data. CK performed the statistical analysis and extensively
revised the manuscript. All authors read and approved the final
manuscript.
Acknowledgements
Departmental funding supported this study financially: Department of
Anesthesiology, University Hospital, Regensburg, Germany.
References
1. Richard C, Warszawski J, Anguel N, Deye N, Combes A, Barnoud
D, Boulain T, Lefort Y, Fartoukh M, Baud F, et al.: Early use of the
pulmonary artery catheter and outcomes in patients with
shock and acute respiratory distress syndrome: a randomized
controlled trial. JAMA 2003, 290:2713-2720.
2. Sandham JD, Hull RD, Brant RF, Knox L, Pineo GF, Doig CJ,
Laporta DP, Viner S, Passerini L, Devitt H, et al.: A randomized,
controlled trial of the use of pulmonary-artery catheters in
high-risk surgical patients. N Engl J Med 2003, 348:5-14.
3. Jacka MJ, Cohen MM, To T, Devitt JH, Byrick R: The use of and
preferences for the transesophageal echocardiogram and pul-
monary artery catheter among cardiovascular
anesthesiologists. Anesth Analg 2002, 94:1065-1071.
4. Perel A: The value of functional hemodynamic parameters in
hemodynamic monitoring of ventilated patients. Anaesthesist
2003, 52:1003-1004.
5. Reuter DA, Felbinger TW, Moerstedt K, Weis F, Schmidt C, Kilger
E, Goetz AE: Intrathoracic blood volume index measured by
thermodilution for preload monitoring after cardiac surgery. J
Cardiothorac Vasc Anesth 2002, 16:191-195.
6. Wiesenack C, Prasser C, Keyl C, Rödig G: Assessment of
intrathoracic blood volume as an indicator of cardiac preload:
single transpulmonary thermodilution technique versus
assessment of pressure preload parameters derived from a
pulmonary artery catheter. J Cardiothorac Vasc Anesth 2001,
15:584-588.
7. Tavernier B, Makhotine O, Lebuffe G, Dupont J, Scherpereel P:
Systolic pressure variation as a guide to fluid therapy in
patients with sepsis-induced hypotension. Anesthesiology
1998, 89:1313-1321.
8. Tousignant CP, Walsh F, Mazer CD: The use of transesophageal
echocardiography for preload assessment in critically ill
patients. Anesth Analg 2000, 90:351-355.
9. Perel A: Assessing fluid responsiveness by the systolic pres-
sure variation in mechanically ventilated patients. Anesthesiol-
ogy 1998, 89:1309-1310.
10. Michard F, Boussat S, Chemla D, Anguel N, Mercat A, Lecarpen-
tier Y, Richard C, Pinsky MR, Teboul JL: Relation between respi-
ratory changes in arterial pulse pressure and fluid
responsiveness in septic patients with acute circulatory
failure. Am J Respir Crit Care Med 2000, 162:134-138.
11. Berkenstadt H, Margalit N, Hadani M, Friedman Z, Segal E, Villa Y,
Perel A: Stroke volume variation as a predictor of fluid respon-
siveness in patients undergoing brain surgery. Anesth Analg
2001, 92:984-989.
12. Reuter DA, Felbinger TW, Schmidt C, Kilger E, Goedje O, Lamm
P, Goetz AE: Stroke volume variations for assessment of car-
diac responsiveness to volume loading in mechanically venti-
lated patients after cardiac surgery. Intensive Care Med 2002,
28:392-398.
13. Reuter DA, Kirchner A, Felbinger TW, Weis FC, Kilger E, Lamm P,
Goetz AE: Usefulness of left ventricular stroke volume varia-
tion to assess fluid responsiveness in patients with reduced
cardiac function. Crit Care Med 2003, 31:1399-1404.
14. Marx G, Cope T, McCrossan L, Swaraj S, Cowan C, Mostafa SM,
Wenstone R, Leuwer M: Assessing fluid responsiveness by
stroke volume variation in mechanically ventilated patients
with severe sepsis. Eur J Anaesthesiol 2004, 21:132-138.
15. Pinsky MR: Probing the limits of arterial pulse contour analysis
to predict preload responsiveness. Anesth Analg 2003,
96:1245-1247.
16. Wiesenack C, Prasser C, Rodig G, Keyl C: Stroke volume varia-
tion as an indicator of fluid responsiveness using pulse con-
tour analysis in mechanically ventilated patients. Anesth Analg
2003, 96:1254-1257.
17. Cheatham ML, Nelson LD, Chang MC, Safcsak K: Right ventricu-
lar end-diastolic volume index as a predictor of preload status
in patients on positive end-expiratory pressure. Crit Care Med
1998, 26:1801-1806.
18. Diebel LN, Wilson RF, Tagett MG, Kline RA: End-diastolic vol-
ume. A better indicator of preload in the critically ill. Arch Surg
1992, 127:817-821.
19. Durham R, Neunaber K, Vogler G, Shapiro M, Mazuski J: Right
ventricular end-diastolic volume as a measure of preload. J
Trauma 1995, 39:218-223.
20. Reuse C, Vincent JL, Pinsky MR: Measurements of right ven-
tricular volumes during fluid challenge. Chest 1990,
98:1450-1455.
21. Michard F, Teboul JL: Predicting fluid responsiveness in ICU
patients. Chest 2002, 121:2000-2008.
22. Wagner JG, Leatherman JW: Right ventricular end-diastolic vol-
ume as a predictor of the hemodynamic response to a fluid
challenge. Chest 1998, 113:1048-1054.
23. Yelderman M, Quinn MD, McKown RC: Thermal safety of a fila-
mented pulmonary artery catheter. J Clin Monit 1992,
8:147-149.
24. Lazor MA, Pierce ET, Stanley GD, Cass JL, Halpern EF, Bode RH
Jr: Evaluation of the accuracy and response time of STAT-
mode continuous cardiac output. J Cardiothorac Vasc Anesth
1997, 11:432-436.
25. Groeneveld AB, Berendsen RR, Schneider AJ, Pneumatikos IA,
Stokkel LA, Thijs LG: Effect of the mechanical ventilatory cycle
on thermodilution right ventricular volumes and cardiac
output. J Appl Physiol 2000, 89:89-96.
Key messages
• An increased cardiac preload is more reliably reflected
by CEDV index than by CVP, PCWP or LVEDA index.
• But CEDV index did not reflect fluid responsiveness.
• The terms "cardiac preload" and "fluid responsiveness"
are not exchangeable.
• Fluid responsiveness is better predicted by LVEDA
index than by CEDV index.
Critical Care Vol 9 No 3 Wiesenack et al.
R233
26. Hoeper MM, Tongers J, Leppert A, Baus S, Maier R, Lotz J: Eval-
uation of right ventricular performance with a right ventricular
ejection fraction thermodilution catheter and MRI in patients
with pulmonary hypertension. Chest 2001, 120:502-507.
27. Kraut EJ, Owings JT, Anderson JT, Hanowell L, Moore P: Right
ventricular volumes overestimate left ventricular preload in
critically ill patients. J Trauma 1997, 42:839-845.
28. Yu M, Takiguchi S, Takanishi D, Myers S, McNamara JJ: Evalua-
tion of the clinical usefullness of thermodilution volumetric
catheters. Crit Care Med 1995, 23:681-686.
29. Luecke T, Roth H, Herrmann P, Joachim A, Weisser G, Pelosi P,
Quintel M: Assessment of cardiac preload and left ventricular
function under increasing levels of positive end-expiratory
pressure. Intensive Care Med 2004, 30:119-126.
30. Nelson LD, Safcsak K, Cheatham ML, Block EF: Mathematical
coupling does not explain the relationship between right ven-
tricular end-diastolic volume and cardiac output. Crit Care Med
2001, 29:940-943.
31. Michard F, Reuter DA: Assessing cardiac preload or fluid
responsiveness? It depends on the question we want to
answer. Intensive Care Med 2003, 29:1396.
32. Bendjelid K, Romand JA: Fluid responsiveness in mechanically
ventilated patients: a review of indices used in intensive care.
Intensive Care Med 2003, 29:352-360.
33. Bouchard MJ, Denault A, Couture P, Guertin MC, Babin D, Ouellet
P, Carrier M, Tardif JC: Poor correlation between hemodynamic
and echocardiographic indexes of left ventricular performance
in the operating room and intensive care unit. Crit Care Med
2004, 32:644-648.