Báo cáo khoa học: " In vivo validation of the adequacy calculator for continuous renal replacement therapies" pps
Bạn đang xem bản rút gọn của tài liệu. Xem và tải ngay bản đầy đủ của tài liệu tại đây (616.8 KB, 8 trang )
Open Access
Available online />R266
Vol 9 No 3
Research
In vivo validation of the adequacy calculator for continuous renal
replacement therapies
Zaccaria Ricci
1
, Gabriella Salvatori
2
, Monica Bonello
3
, Tirak Pisitkun
4
, Irene Bolgan
5
,
Giuseppe D'Amico
6
, Maurizio Dan
7
, Pasquale Piccinni
7
and Claudio Ronco
8
1
Consultant, Department of Intensive Care, Policlinico Umberto I, Rome, Italy
2
Research fellow, Department of Nephrology, St Bortolo Hospital, Vicenza, Italy
3
Specialist registrar, Department of Nephrology, St Bortolo Hospital, Vicenza, Italy
4
Research fellow, Department of Nephrology, St Bortolo Hospital, Vicenza, Italy
5
Statistician, Department of Nephrology, St Bortolo Hospital, Vicenza, Italy
6
Research fellow, Department of Intensive Care, Policlinico Umberto I, Rome, Italy
7
Head, Department of Intensive Care, St Bortolo Hospital, Vicenza, Italy
8
Head, Department of Nephrology, St Bortolo Hospital, Vicenza, Italy
Corresponding author: Zaccaria Ricci,
Received: 23 Sep 2004 Revisions requested: 19 Oct 2004 Revisions received: 22 Feb 2005 Accepted: 14 Mar 2005 Published: 7 Apr 2005
Critical Care 2005, 9:R266-R273 (DOI 10.1186/cc3517)
This article is online at: />© 2005 Ricci et al.; licensee BioMed Central Ltd.
This is an Open Access article distributed under the terms of the Creative Commons Attribution License ( />2.0), which permits unrestricted use, distribution, and reproduction in any medium, provided the original work is properly cited.
Abstract
Introduction The study was conducted to validate in vivo the
Adequacy Calculator, a Microsoft Excel-based program,
designed to assess the prescription and delivery of renal
replacement therapy in the critical care setting.
Methods The design was a prospective cohort study, set in two
intensive care units of teaching hospitals. The participants were
30 consecutive critically ill patients with acute renal failure
treated with 106 continuous renal replacement therapies
(CRRT). Urea clearance computation was performed with the
Adequacy Calculator (K
CALC
). Simultaneous blood and effluent
urea samples were collected to measure the effectively
delivered urea clearance (K
DEL
) at the beginning of each
treatment and, during 73 treatments, between the 18th and
24th treatment hour. The correlation between 179 computed
and 179 measured clearances was assessed. Fractional
clearances for urea were calculated as spKt/V (where sp
represents single pool, K is clearance, t is time, and V is urea
volume of distribution) obtained from software prescription and
compared with the delivered spKt/V obtained from empirical
data.
Results We found that the value of clearance predicted by the
calculator was strongly correlated with the value obtained from
computation on blood and dialysate determination (r = 0.97)
during the first 24 treatment hours, regardless of the renal
replacement modality used. The delivered spKt/V (1.25) was
less than prescribed (1.4) from the Adequacy Calculator by
10.7%, owing to therapy downtime.
Conclusion The Adequacy Calculator is a simple tool for
prescribing CRRT and for predicting the delivered dose. The
calculator might be a helpful tool for standardizing therapy and
for comparing disparate treatments, making it possible to
perform large multi-centre studies on CRRT.
Introduction
Acute renal failure (ARF), as a component of the multiple organ
failure syndrome, affects morbidity and mortality in critically ill
patients [1]. This is still the case even though several aspects
of medical care and applied technology in ARF were improved.
Much development in renal replacement therapy (RRT) is
ongoing, concerning new techniques, new membranes, and
new integrated equipment. However, it is still unclear whether
a correlation between treatment dose and outcome exists and
no consensus has been reached on how much treatment is
ARF = acute renal failure; CRRT = continuous renal replacement therapy; CVVH = continuous veno-venous hemofiltration; CVVHD = continuous
veno-venous hemodialysis; CVVHDF = continuous veno-venous hemodiafiltration; K = clearance; K
CALC
= calculator-estimated urea clearance; K
DEL
= delivered clearance evaluated from urea concentrations on simultaneous blood and effluent samples; RRT = renal replacement therapy; spKt/V =
single pool fractional clearance for urea;t = time; V = urea volume of distribution.
Critical Care Vol 9 No 3 Ricci et al.
R267
adequate [2,3]. A long-term, large-scale, multi-center study to
determine how the outcome of critically ill patients is affected
by RRT dose and modality (intermittent or continuous, diffusive
or convective) is still lacking [4,5]. This is in part due to the
complexity of data collection and to the variety of existing
standards in RRT prescription and dose evaluation.
We tested a computer program called 'Adequacy Calculator
for ARF', a simple and manageable tool designed to prescribe
RRT dose and to collect information about the quantity of
delivered treatments. Pisitkun and colleagues [6] have
described this Microsoft excel based program and its algo-
rithms in a previous paper. Once the required parameters are
entered, it calculates urea clearance and fractional clearance,
spKt/V (sp = single pool; K = clearance, t = time, V = urea vol-
ume of distribution) for each continuous RRT (CRRT)
modality.
Materials and methods
We prospectively collected data from 106 consecutive contin-
uous renal replacement treatments administered to 30
patients with acute renal failure in the intensive care unit of St
Bortolo Hospital and Policlinico Umberto I in the period from
March 2003 to November 2004. The decision to start and to
withdraw RRT, anticoagulation and prescription of net ultrafil-
tration rate were left to institutional protocols (Table 1).
Treatments were delivered at different modalities and machine
settings depending on the preference of the prescribing
physician, but a final spKt/V of 1.4 had to be prescribed by
means of the Adequacy Calculator. The plasma filtration frac-
tion, in the case of postfilter reinfusion of replacement solution,
was kept below 20%. By protocol, filters were changed after
24 hours of treatment, or earlier if clotting occurred. The avail-
able membranes were Diacap α (1.2 m
2
, polysulphone, B
Braun) and Aquamax HF 12 (1.2 m
2
; polyethersulphone;
Edwards Lifescience) for 59 and 47 treatments respectively.
Sixty-four treatments were performed with bicarbonate-buff-
ered replacement and dialysate fluids, and 42 with lactate-
buffered fluids. Daily operative treatment times and downtimes
were reported. Intermittent treatments were excluded from the
analysis.
The Adequacy Calculator estimated urea clearance (K
CALC
)
for each different modality and machine setting (Additional file
1). The calculator estimation is founded on the assumption
that urea sieving coefficient is equal to unity for convective
therapies; at the same time the calculator assumes that com-
plete saturation of spent dialysate occurs under continuous
veno-venous hemodialysis (CVVHD) conditions.
To correlate K
CALC
with effectively delivered instantaneous
urea clearance (K
DEL
), simultaneous samples from prefilter
blood and effluent were collected during each treatment, to
measure urea concentration; 106 blood and 106 effluent sam-
ples were withdrawn during the first hour from the start of
RRT; 73 blood-effluent samples were withdrawn between the
18th and 24th hours (in 33 cases treatment was stopped
before the 18th hour). K
DEL
was calculated as described in
Additional file 1. One hundred and six K
DEL
values at treatment
start (T
0
) and 73 values after 18 to 24 hours of treatment (T
18
)
were correlated with 106 and 73 K
CALC
values obtained for the
same treatments.
The calculator prescribed spKt/V
CALC
after K
CALC
, the
expected treatment time and patient's body weight (for
assessment of urea volume of distribution, V; Fig. 1) had been
entered. spKt/V
DEL
was calculated from K
DEL
, V and effective
operative treatment times (Additional file 1).
Statistical analysis
Statistical analysis was performed with the SPSS 11.5 soft-
ware package. Data are reported as means ± standard devia-
tion (SD). Correlations between estimated and measured urea
clearance were performed with the Pearson correlation coeffi-
cients (r). spKt/V, K
CALC
and K
DEL
have no normal distribution,
so we used a Mann-Whitney test (between two samples) or a
Kruskal-Wallis test (between three or more samples) to
indicate whether groups had different locations. P < 0.05 was
considered statistically significant.
Results
A total of 106 RRTs administered to 30 patients were ana-
lysed with the Adequacy Calculator. An average of 3.5 treat-
ment days was examined for each patient. Nineteen post-
dilution continuous veno-venous hemofiltrations (CVVHs), 23
pre-dilution CVVHs, 23 CVVHDs and 41 post-dilution contin-
uous veno-venous hemodiafiltrations (CVVHDF) were pre-
scribed. The duration of each treatment was 17 ± 6 hours. The
daily operative treatment time was 20 ± 3 hours with a down-
time of 3 ± 2 hours. Thirty-three treatments lasted less than 18
hours (16 CVVH and 17 CVVHD); 73 treatments lasted more
than 18 hours (26 CVVH, 6 CVVHD and 41 CVVHDF). Exam-
ined clearances ranged from 15 ml min
-1
to 100 ml min
-1
(Table
2), this wide range being explained by variability in patients'
weights and prescribed treatment times: because the pre-
scribed spKt/V
CALC
was maintained at a constant 1.4, a 35 kg
patient treated for 24 hours with a K
CALC
of 20 ml min
-1
obtained the same fractional clearance as a 98 kg patient dia-
lyzed for 12 hours with a K
CALC
of 100 ml min
-1
.
The difference between K
DEL
and K
CALC
was -1.75 ± 5.9 ml
min
-1
. Applying a Pearson correlation we obtained r = 0.97; a
significant (P = 0.022) decrease in calculator accuracy in pre-
dicting effectively delivered clearance was obtained when
data from the K
CALC
< 60 ml min
-1
subgroup (r = 0.95) were
compared with data from the K
CALC
> 60 ml min
-1
subgroup (r
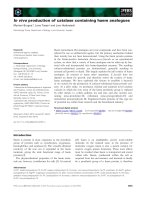
= 0.89). A Bland-Altman analysis (Fig. 2) confirmed high cor-
relation: this result was particularly evident up to an average
clearance ([K
DEL
+ K
CALC
]/2) of 60 ml min
-1
, with the K
DEL
-
K
CALC
difference never exceeding a standard deviation of 5.9
Available online />R268
ml min
-1
, whereas for [K
DEL
+ K
CALC
]/2 > 60 ml min
-1
, the K
DEL
- K
CALC
difference tended to increase. However, we found that
155 of 179 (87%) K
DEL
values fell within a ± 15% K
CALC
error:
in 5 cases the calculator underestimated, and in 19 overesti-
mated, the delivered clearance. No significant K
DEL
- K
CALC
dif-
ference was observed when T
0
and T
18
clearances were
analysed (P = 0.54) and no significant difference (P = 0.394)
was observed when K
CALC
> 60 ml min
-1
in the T
0
subgroup
and K
CALC
> 60 ml min
-1
in the T
18
subgroup were analyzed:
calculator accuracy was not affected by filter lifespan (Table
3).
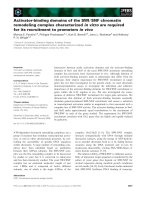
After analysis of each modality group, correlations were still
high: r
CVVHpre
= 0.96, r
CVVHpost
= 0.96, r
CVVHD
= 0.97 and r
CV-
VHDF
= 0.98 (Fig. 3), with no significant difference between
groups (P = 0.099) (Table 3).
Membrane type did not affect the K
DEL
- K
CALC
correlation: r
obtained for Diacap M and Aquamax HF 12 were 0.96 and
0.97 respectively (P = 0.1).
The average spKt/V
DEL
obtained during our treatments was
1.25 ± 0.6; the delivered/prescribed ratio was 0.89 (Table 3);
the delivered fractional clearance was significantly less than
the prescribed spKt/V
CALC
of 1.4 (P = 0.045).
Table 1
Characteristics of patients
Parameter Value (mean ± SD; range)
Total no. of patients 30
Age (years) 58 ± 12
Weight (kg) 73.7 ± 15.7 (35–105)
SAPS II score 38 ± 12
No. of evaluated treatments 106
Examined treatment days 3.5 ± 1.1
Prescribed spKt/V 1.4
Diagnosis
Sepsis/septic shock 8
Bowel perforation 3
Aortic aneurysm repair 3
Pneumonia 5
Hemorrhagic shock 2
Pancreatitis 1
Multiple trauma 5
Cardiogenic shock 3
Urine output at RRT start (ml per 24 h) 150 ± 70
Urea levels at RRT start (mg dl
-1
) 124 ± 55
Urea levels after 24 h from RRT start (mg dl
-1
) 98 ± 50
Urea levels at RRT withold 68 ± 53
Creatinine levels at RRT start (mg dl
-1
)2.9 ± 0.9
Creatinine levels after 24 h from RRT start (mg dl
-1
) 2.4 ± 1.25
Creatinine levels at RRT withold 1.8 ± 0.6
No. of patients receiving heparin < 500 U h
-1
12
No. of patients receiving heparin > 500 U h
-1
11
No. of patients receiving no anticoagulation 7
RRT, renal replacement therapy; SAPS II, Systems Approach Problem Solver II.
Critical Care Vol 9 No 3 Ricci et al.
R269
Discussion
Ideal marker molecules and performance parameters to com-
pare treatment dose in different techniques are difficult to
establish. In spite of its moderate toxicity, urea is currently
used as a marker of RRT adequacy because it is easily meas-
urable and, representing the end of protein metabolism, its
accumulation during kidney failure defines the requirement for
dialysis while its elimination defines the efficiency of treatment.
Because urea is equally distributed at steady state in body
water compartments, its volume of distribution (V) equals total
body water. Urea is therefore a surrogate of the low-molecular-
mass toxins. In chronic hemodialysis, the treatment dose of
RRT is defined as a fractional clearance, Kt/V, where K is the
instantaneous clearance, t is treatment time and V is the vol-
ume of distribution of the marker molecule. This is a dimension-
less parameter that represents the efficacy of treatments, and
allows comparison between different therapies and among dif-
ferent patients. In fact, different instantaneous clearances, rep-
resenting treatment efficiency, can yield comparable results in
terms of efficacy only if correlated with treatment time and the
patient's total body water. A Kt/V value of 1.2 is an established
maker of adequacy that has been shown to be correlated with
morbidity and mortality in patients with end-stage kidney dis-
ease [7-11]. Kt/V has not yet been validated as a marker of
adequacy in patients with acute renal failure, but it seems that
a good rationale exists for its use in continuous therapies. The-
oretically, in its original conception, clearance was thought to
evaluate renal function of disparate individuals whose kidneys
were operating 24 hours per day and blood levels were at
steady state. Similarly, after some days of CRRT, patients' urea
levels approach a real steady state (never obtained with inter-
mittent dialysis) and post-dialysis rebound is not present. It is
thus reasonable to consider urea distribution volume as in a
single-pool kinetic model (spKt/V).
Recently, Brause and colleagues [12] stated that spKt/V is a
valuable tool for evaluating continuous hemofiltration, and
higher values (0.8 versus 0.53) were correlated to improve
uremia control and acid–base balance. Ronco and colleagues
[2] showed an improved outcome with postdilution hemofiltra-
tion delivered at 35 ml h
-1
kg
-1
in a 450-patient population. Set-
ting a spKt/V threshold that could guide clinicians towards
adequate treatments, we should possibly meet the target of 35
ml h
-1
kg
-1
, which, delivered as a 24-hour treatment, may trans-
late into a spKt/V of 1.4 independently of the RRT modality.
We found that the Adequacy Calculator was able to predict
the delivered urea clearance accurately, regardless of which
CRRT modality was selected; the correlation between predic-
tion and effective delivery remained high over a time range of
24 hours. When clearances above 60 ml min
-1
were pre-
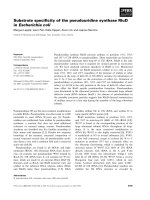
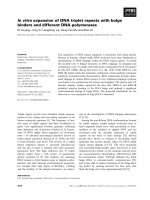
Figure 1
An Adequacy Calculator worksheet: continuous veno-venous hemodiafiltration (CVVHDF) is delivered in a 70 kg patientAn Adequacy Calculator worksheet: continuous veno-venous hemodiafiltration (CVVHDF) is delivered in a 70 kg patient. Post-dilution mode is
selected, machine settings and prescribed treatment time per day are entered on the upper left panel: estimated urea clearance (K
CALC
) and 'daily
Kt/V' (spKt/V
CALC
) are displayed on the right. In the lower left panel it is possible to obtain K
DEL
measure after entering prefilter blood (Cbi) and efflu-
ent (Cdo) urea concentration: in this case, when operative times are entered, 'daily Kt/V' cell displays effectively delivered fractional clearance (spKt/
V
DEL
).
Available online />R270
scribed, the calculator showed a tendency to overestimate
effective clearances: this overestimation remained generally
within an error of 15%.
Considering our results and the dissociation between treat-
ment delivery and calculator estimation when high clearances
are involved, as could occur with low-efficiency extended dial-
ysis or high-volume hemofiltration, a slight correction to
Table 2
Treatments characteristics
Parameter Value
No. of treatments 106
Total no. of examined K
CALC
/K
DEL
(ml min
-1
) 179 (106 T
0
; 73 T
18
)
CVVH
post
38 (19 T
0
; 19 T
18
)
CVVH
pre
30 (23 T
0
; 7 T
18
)
CVVHD 29 (23 T
0
; 6 T
18
)
CVVHDF 82 (42 T
0
; 42 T
18
)
Total prescribed K
CALC
(ml min
-1
) 48.6 ± 24; 18–100
CVVH
post
35.6 ± 16; 16–66
CVVH
pre
48.8 ± 19; 15–83
CVVHD 56.2 ± 28; 20–100
CVVHDF
a
52.2 ± 24; 23–100
Total prescribed net UF (ml h
-1
) 250 ± 100; 0–500
Treatment hours per day 20 ± 3; 8.5–24
Treatment hours per run 17 ± 6; 5–24
Downtime (hours) 3 ± 2
a
During continuous veno-venous hemodiafiltration (CVVHDF) modality, prescribed clearance was delivered with even hemofiltration and
hemodialysis flow rates. Where errors are given, results are means ± SD; ranges follow a semicolon. CVVH, continuous veno-venous
hemofiltration; CVVHD, continuous veno-venous hemodialysis; K
CALC
, calculator-estimated urea clearance; K
DEL
, delivered clearance evaluated
from urea concentrations on simultaneous blood and effluent samples; T
0
, at therapy start; T
18
, after 18 to 24 hours of uninterrupted therapy.
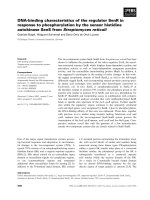
Figure 2
Bland–Altman correlation between urea clearance obtained by two methods: urea clearance calculated with the described software (K
CALC
) and urea clearance obtained by direct measure on prefilter blood and effluent samples (K
DEL
)Bland–Altman correlation between urea clearance obtained by two methods: urea clearance calculated with the described software (K
CALC
) and
urea clearance obtained by direct measure on prefilter blood and effluent samples (K
DEL
). It is possible to distinguish the correlations between K
CALC
and K
DEL
, at therapy start (T
0
) and after 18 to 24 hours of uninterrupted therapy (T
18
).
Critical Care Vol 9 No 3 Ricci et al.
R271
Table 3
Calculated-delivered urea clearance correlation
Parameter K
CALC
- K
DEL
(ml min
-1
) r
Total -1.7 ± 5.9 0.97
CVVH
post
-2 ± 4.3 0.96
CVVH
pre
1.4 ± 6 0.96
CVVHD -4.5 ± 7.7 0.97
CVVHDF -1.8 ± 5.3 0.98
Subgroups
K
CALC
< 60 ml min
-1
0.05 ± 3.3 0.95
K
CALC
> 60 ml min
-1
-5.2 ± 8.2
a
0.89
K
CALC
at T
0
-1.04 ± 6.3 0.97
K
CALC
at T
18
-2.8 ± 5.2 0.96
K
CALC
< 60 ml min
-1
at T
0
0.4 ± 3.6 0.95
K
CALC
> 60 ml min
-1
at T
0
-4.8 ± 9.7
a
0.87
K
CALC
< 60 ml min
-1
at T
18
-0.6 ± 2.9 0.94
K
CALC
> 60 ml min
-1
at T
18
-5.5 ± 6.5
a
0.89
Delivered spKt/V 1.25 ± 0.6
Delivered/prescribed 0.89
a
P < 0.05 (referred to total K
CALC
- K
DEL
difference).
Where errors are given, results are means ± SD. CVVH, continuous veno-venous hemofiltration; CVVHD, continuous veno-venous hemodialysis;
CVVHDF, continuous veno-venous hemodiafiltration; K
CALC
, calculator-estimated urea clearance; K
DEL
, delivered clearance evaluated from urea
concentrations on simultaneous blood and effluent samples; T
0
, therapy start; T
18
, 18 to 24 hours of uninterrupted therapy.
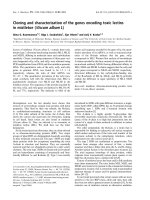
Figure 3
Bland–Altman analysisBland–Altman analysis. The same data as above are used; here it is possible to distinguish between different modalities. Parallel lines indicate stand-
ard deviation. CVVH, continuous veno-venous hemofiltration; CVVHD, continuous veno-venous hemodialysis; CVVHDF, continuous veno-venous
hemodiafiltration; K
CALC
, calculator-estimated urea clearance; K
DEL
, delivered clearance evaluated from urea concentrations on simultaneous blood
and effluent samples.
Available online />R272
prevent the overestimation of effective treatment delivery is
strongly advised. Nevertheless, even in the presence of an
error of up to 15%, which is unlikely to occur, the delivered Kt/
V in 24 hours will always approach the target value of 1.2.
The use of the calculator allowed us to strictly monitor our
treatments during the study period and described an average
10.7% (P < 0.05) decrease in delivery of therapy in
comparison with prescribed dose. The differences between
prescribed and delivered dose in critically ill patients with ARF
undergoing intermittent hemodialysis were analyzed by Evan-
son and colleagues [13]; they found that only 30% of dialysis
delivered a Kt/V of 1.2; high patient weight, male sex and low
blood flow were the limiting factors affecting RRT administra-
tion. In our population, this decrease in delivery was some-
times due to overestimation of K
CALC
by the calculator, and,
more often, to operative treatment time, which was often
shorter than the prescribed treatment time (during bag substi-
tution and filter change the treatment was not administered).
Our observation is consistent with a recent large retrospective
analysis [14]. In this setting, when a 'standardized' downtime
is foreseen, treatment prescription might be adjusted to cor-
rect for the time of zero clearance.
However, all these considerations must be seen in the light of
an absolute lack of any previous attempt to adjust treatment
dose to specific target levels. Furthermore, a clear understand-
ing of adequate levels of renal replacement therapy has yet to
be achieved. In this state of absence of information and of
wide ignorance of the field, the calculator might have the merit
of placing the issue of treatment dose among the priorities of
critical care nephrology: a dose prescription should be made
before embarking on an extracorporeal blood purification tech-
nique, and the delivered treatment dose should be monitored.
The limitations of this study are as follows. A subgroup analy-
sis of net ultrafiltration (UF) prescription, daily treatment length
and downtime difference within different modalities was not
performed: in our opinion these factors do not affect Ade-
quacy Calculator accuracy. Slight subgroup disparities in
K
CALC
prescription within different modalities were present
because prescribing physicians were not asked to modify their
usually preferred modality. The effect of different blood pump
flow rates on error in K
CALC
was not evaluated: higher blood
flow rates might have decreased some K
CALC
- K
DEL
differ-
ences, especially when high-volume treatments were used.
The observational nature of our study did not allow us to ana-
lyse all possible prescriptions systematically: a dedicated
study should be performed. Finally, partial thromboplastin
time, prothrombin time, platelet levels, anticoagulation and
administration of drotrecogin alfa were not taken into consid-
eration; however, our study showed that, during a period of 24
hours, urea sieving coefficient and clearance were not signifi-
cantly affected by treatment duration and, indirectly, by pro-
gressive filter clogging. In our experience, anticoagulation
parameters affect the lifespan of membranes in the first 24
hours but do not affect urea clearance.
Conclusion
We assume that by using simple CRRT parameters and the
Adequacy Calculator it is possible to simply prescribe and
closely monitor the dose of different continuous therapies.
This tool might help in future prospective studies to correlate
different dose prescriptions with different clinical outcomes.
Competing interests
The author(s) declare that they have no competing interests.
Authors' contributions
ZR designed the study, participated in data collection and
drafted the paper. MB, GS, EA and GD participated in data
collection. IB provided statistical expertise. MD and PP revised
the article. CR designed the study and participated in data
interpretation. All authors read and approved the final
manuscript.
Additional files
References
1. Brivet F, Kleinknecht D, Loriat P, Landais P: The French Study
Group on Acute Renal Failure: acute renal failure in intensive
care units – causes, outcome, and prognostic factors on hos-
pital mortality: a prospective, multicenter study. Crit Care Med
1996, 24:192-198.
Key messages
• The Adequacy Calculator is a Microsoft Excel-based
program, designed to assess the prescription and deliv-
ery of renal replacement therapy in the critical care
setting.
• A prospective study was performed in order to evaluate
correlation between calculated and measured
clearances.
• The value of clearance predicted by the calculator was
strongly correlated with the value obtained from deter-
mination on blood and dialysate: the Adequacy Calcula-
tor is a reliable tool for prescribing CRRT and for
predicting the delivered dose.
The following Additional files are available online:
Additional File 1
A pdf file containing Adequacy Calculator algorithms for
urea clearance and single pool fractional clearance
computation is provided.
See />supplementary/cc3517-S1.pdf
Critical Care Vol 9 No 3 Ricci et al.
R273
2. Ronco C, Bellomo R, Homel P, Brendolan A, Dan M, Piccinni P, La
Greca G: Effect of different doses in continuous veno-venous
haemofiltration on outcomes of acute renal failure: a prospec-
tive randomised trial. Lancet 2000, 356:26-30.
3. Gotch FA: Daily hemodialysis is a complex therapy with
unproven benefits. Blood Purif 2001, 19:211-216.
4. Ronco C, Bellomo R: Continuous renal replacement therapy:
evolution in technology and current nomenclature. Kidney Int
1998, 66(Suppl):S160-S164.
5. Clark WR, Ronco C: Renal replacement therapy in acute renal
failure: solute removal mechanisms and dose quantification.
Kidney Int 1998, 66(Suppl):S133-S137.
6. Pisitkun T, Tiranathanagul K, Poulin S, Bonello M, Salvatori G,
D'Intini V, Ricci Z, Bellomo R, Ronco C: A practical tool for deter-
mining the adequacy of renal replacement therapy in acute
renal failure patients. Contrib Nephrol 2004, 144:329-349.
7. Parker T, Husni L, Huang W, Lew N, Lowrie EG: Survival of
hemodialysis patients in the United States is improved with a
greater quantity of dialysis. Am J Kidney Dis 1994, 23:661-669.
8. NKF/DOQI: Clinical practice guidelines for haemodialysis ade-
quacy: updater 2000. Am J Kidney Dis 2001, 37(Suppl
1):S7-S64.
9. Owen WF Jr, Chertow GM, Lazarus JM, Lowrie EG: Dose of
hemodialysis and survival: differences by race and sex. JAMA
1998, 280:1764-1768.
10. Daugirdas JT, Depner TA, Gotch FA, Greene T, Keshaviah P, Levin
NW, Schulman G: Comparison of methods to predict equili-
brated Kt/V in the HEMO pilot study. Kidney Int 1997,
52:1395-1405.
11. Gotch F, Sargent J: A mechanistic analysis of the National
Cooperative Dialysis Study (NCDS). Kidney Int 1985,
28:526-534.
12. Brause M, Neumann A, Schumacher T, Grabensee B, Heering P:
Effect of filtration volume of continuous venovenous hemofil-
tration in the treatment of patients with acute renal failure in
intensive care units. Crit Care Med 2003, 31:841-846.
13. Evanson JA, Himmelfarb J, Wingard R, Knights S, Shyr Y, Schul-
man G, Ikizler TA, Hakim RM: Prescribed versus delivered dialy-
sis in acute renal failure patients. Am J Kidney Dis 1998,
32:731-738.
14. Venkataraman R, Kellum JA, Palevsky P: Dosing patterns for
CRRT at a large academic medical center in the United States.
J Crit Care 2002, 17:246-250.