Tài liệu Báo cáo khoa học: A kinetic model of the branch-point between the methionine and threonine biosynthesis pathways in Arabidopsis thaliana doc
Bạn đang xem bản rút gọn của tài liệu. Xem và tải ngay bản đầy đủ của tài liệu tại đây (455.68 KB, 13 trang )
A kinetic model of the branch-point between the methionine
and threonine biosynthesis pathways in
Arabidopsis thaliana
Gilles Curien, Ste
´
phane Ravanel and Renaud Dumas
Laboratoire de Physiologie Cellulaire Ve
´
ge
´
tale DRDC/CEA-Grenoble, France
This work proposes a model of the metabolic branch-point
between the methionine and threonine biosynthesis path-
ways in Arabidopsis thaliana which involves kinetic compe-
tition for phosphohomoserine between the allosteric enzyme
threonine synthase and the two-substrate enzyme cysta-
thionine c-synthase. Threonine synthase is activated by
S-adenosylmethionine and inhibited by AMP. Cystathio-
nine c-synthase condenses phosphohomoserine to cysteine
via a ping-pong mechanism. Reactions are irreversible and
inhibited by inorganic phosphate. The modelling procedure
included an examination of the kinetic links, the determin-
ation of the operating conditions in chloroplasts and the
establishment of a computer model using the enzyme rate
equations. To test the model, the branch-point was recon-
stituted with purified enzymes. The computer model showed
a partial agreement with the in vitro results. The model was
subsequently improved and was then found consistent with
flux partition in vitro and in vivo. Under near physiological
conditions, S-adenosylmethionine, but not AMP, modulates
the partition of a steady-state flux of phosphohomoserine.
The computer model indicates a high sensitivity of cysta-
thionine flux to enzyme and S-adenosylmethionine concen-
trations. Cystathionine flux is sensitive to modulation of
threonine flux whereas the reverse is not true. The cysta-
thionine c-synthase kinetic mechanism favours a low sensi-
tivity of the fluxes to cysteine. Though sensitivity to
inorganic phosphate is low, its concentration conditions the
dynamics of the system. Threonine synthase and cystathio-
nine c-synthase display similar kinetic efficiencies in the
metabolic context considered and are first-order for the
phosphohomoserine substrate. Under these conditions out-
flows are coordinated.
Keywords: allosteric activation; branch-point; kinetic com-
petition; ping-pong; sensitivity coefficient.
Metabolic branch-points display a very large diversity in
terms of the number of the enzymes involved, the kinetic
mechanisms of the competing enzymes and the number as
well as the nature of the allosteric controls. Whether such
diversity in the organization of the branch-points reflects
differences in the branch-point kinetics is not well known.
Indeed, detailed models that take into account the individ-
ual enzyme kinetic properties in their metabolic context are
scarce. Flux partition at the dividing point of several
pathways has been studied both theoretically [1–3] and
experimentally [2,4–7]. Some studies used the framework of
metabolic control analysis for this purpose [6,7]. However,
the allosteric controls of the branch-point enzymes are not
taken into account in these experimental studies. Also the
occurrence of branch-point two-substrate enzymes and the
consequence of their kinetic mechanisms for the partition of
flux in the systems studied previously have not been
considered.
The present paper proposes a computer model of the
branch-point between the methionine and threonine
biosynthesis pathways in Arabidopsis thaliana (Fig. 1). The
computer model was validated in vitro andusedtoexamine
the branch-point kinetics in detail and to obtain insights into
the kinetic controls of methionine and threonine synthesis in
plants.
The branch-point between the methionine and threo-
nine biosynthesis pathways (Fig. 1) involves a two-substrate
enzyme (cystathionine c-synthase, CGS) and an allosteric
enzyme (threonine synthase, TS). These enzymes compete
kinetically for their common substrate, phosphohomoserine
(Phser), in chloroplasts [9–11]. CGS catalyses the formation
of cystathionine, the precursor of methionine, by condensa-
tion of Phser and cysteine. The reaction follows a ping-pong
mechanism [12]. In the competing branch, TS catalyses the
formation of threonine from Phser. In plants, TS is sti-
mulated in vitro by S-adenosylmethionine (AdoMet) in an
allosteric manner [10,13–16]. AdoMet is a direct derivative
Correspondence to G. Curien, Laboratoire de Physiologie Cellulaire
Ve
´
ge
´
tale DRDC/CEA-Grenoble, 17 rue des Martyrs,
38054 Grenoble Cedex 9, France.
Fax:+33438785091,Tel.:+33438782364,
E-mail:
Abbreviations: AdoMet, S-adenosylmethionine; CGS, cystathionine
c-synthase; Phser, phosphohomoserine; TS, threonine synthase.
Enzymes:cystathioninec-synthase (EC 4.2.99.9; Swiss Prot entry
P55217); cystathionine b-lyase (EC 4.4.1.8; Swiss Prot entry P53780);
homoserine kinase (EC 2.7.1.39; Swiss Prot entry Q8L7R2); threonine
deaminase (EC 4.2.1.16; Swiss Prot entry Q9ZSS6); threonine synthase
(EC 4.2.99.2; Swiss Prot entry Q9S7B5); lactate dehydrogenase
(EC 1.1.1.27, Swiss Prot entry P13491).
Note: The mathematical model described here has been submitted to
the Online Cellular Systems Modelling Database and can be accessed
at free of
charge.
(Received 2 September 2003, accepted 23 September 2003)
Eur. J. Biochem. 270, 4615–4627 (2003) Ó FEBS 2003 doi:10.1046/j.1432-1033.2003.03851.x
of methionine (Fig. 1) and can be considered as the end-
product of the pathway. AdoMet binding to TS increases the
enzyme’s catalytic constant and decreases the Michaelis–
Menten constant for the Phser substrate [15]. CGS and TS
activities are inhibited by inorganic phosphate (P
i
), a by-
product of the reaction [12,17]. TS activity is inhibited by
AMP in vitro [16,17] and AMP competes with AdoMet for its
binding site on the enzyme [16].
Although the individual properties of CGS and TS are
known in detail and equation rates are available [12,15], the
equivalent data for when CGS and TS compete for their
common substrate in a metabolic context remain to be
determined. For example, the effect on branch-point
partition of TS activity modifiers, AdoMet (allosteric
activation) and AMP (inhibition) and the concentration
ranges exhibiting this effect are unknown. We also ignore
how cysteine, the second substrate for CGS, modulates
Phser distribution and to what extent changes in the
concentration of the inhibitor P
i
alters the Phser flux
partition. Due to the numerous interactions in the system, a
mathematical model of the branch-point could be instru-
mental in finding answers to these questions. Such a model
could be built without any assumptions as detailed enzyme
rate equations and kinetic parameters are known.
In this paper we first describe the procedure followed to
build a mathematical model of the branch-point. The model
was then validated in vitro. For this purpose, the branch-
point was reconstituted with purified enzymes and partition
of a constant flux of Phser was measured as a function of the
concentration of AdoMet under conditions as close as
possible to those thought to prevail in vivo in the chloroplast
of an illuminated leaf cell. The model was subsequently
improved and used to calculate the sensitivity of the fluxes
to the different input variables using the framework of
metabolic control analysis. The computer model was finally
used to examine the consequences of TS allosteric activa-
tion, P
i
inhibition and CGS ping-pong mechanism on the
branch-point properties. The analysis provides insights into
the mechanisms of control of methionine and threonine
syntheses in plants.
The mathematical model described here has been
submitted to the Online Cellular Systems Modelling Data-
base and can be accessed at />database/curien/index.html free of charge.
Materials and methods
Chemicals
ATP, Hepes, homoserine, NADH, AdoMet, lactate dehy-
drogenase (Rabbit Muscle type IV) were from Sigma.
Cysteine was from Fluka. Phser was prepared according to
[14] and AdoMet was purified as reported in [15].
Proteins
Arabidopsis CGS, TS, cystathionine b-lyase and threonine
deaminase were purified to homogeneity as described
previously [12,15,18,19]. Mature Arabidopsis homoserine
kinase devoid of its transit peptide sequence was cloned,
overexpressed in Escherichia coli and purified to homogen-
eity for the present work (G. Curien and R. Dumas,
unpublished results). Purified protein concentration was
determined by absorbance measurements at 205 nm [20].
Protein concentrations are expressed on a monomer basis.
Modelling procedure
Figure 1 maps all the kinetic links identified from previous
studies carried out in vitro on the enzymes of the aspartate-
derived amino acid pathway in plant. This map indicates
that (a) homoserine kinase, which provides Phser, catalyses
an irreversible reaction [21] and is not inhibited by its
product Phser in planta [22]; (b) CGS and TS catalyse
irreversible reactions [9,13]; (c) CGS activity depends on the
concentration of Phser and cysteine and is not subject to
allosteric control in the plant [12]; (d) TS activity is
stimulated by AdoMet [10,13–15] and inhibited by AMP
in vitro [16,17]; (e) P
i
inhibits the activity of both CGS and
TS [12,17]; (f) the enzymatic products cystathionine and
threonine do not inhibit the activities of CGS [9,12] and TS
[13,16] and (g) finally and importantly, Phser is not an
allosteric effector of upstream enzymatic activity. Indeed,
the concentration of Phser was shown to vary to a large
extent (20-fold increase) in transgenic plants with reduced
levels of CGS [23]. Therefore, the concentration of Phser
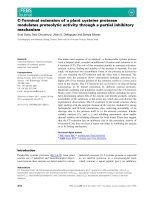
Fig. 1. Phser branch-point in the aspartate-derived amino acid biosyn-
thetic pathway in plants. In plants and microorganisms, aspartate
serves as a precursor for the synthesis of lysine, methionine and thre-
onine. Threonine is a precursor for isoleucine synthesis and methionine
is a direct precursor of S-adenosylmethionine (AdoMet). In plants, the
branching between the methionine and threonine biosynthesis path-
ways occurs at the level of phosphohomoserine (Phser) and involves
cystathionine c-synthase (CGS) and threonine synthase (TS). CGS is a
two-substrate enzyme that catalyses the condensation of Phser and
cysteine. The production of the aspartate-derived amino acid in plants
is thought to be controlled by numerous allosteric controls identified
in vitro and represented in the figure as dotted lines. The dashed square
indicates the limits of the Phser branch-point system analysed in the
present paper. In microorganisms branching between the methionine
and threonine biosynthesis pathways occurs at the level of homoserine
and involves different enzymes and different allosteric patterns [8].
4616 G. Curien et al. (Eur. J. Biochem. 270) Ó FEBS 2003
depends exclusively on the flux of Phser and on CGS and TS
activity. As a consequence it is possible to model the branch-
point kinetics if one knows the CGS and TS rate equations,
Phser flux rates and the concentrations of AdoMet, cysteine,
P
i
and the two enzymes in a metabolic context.
To determine the values of the input variables, we
considered the metabolic state of an illuminated plant leaf
cell chloroplast. Some data were already available from
previous studies and these were completed with data from
the present work. Assuming a homogeneous distribution in
Arabidopsis leaf cells, concentrations of about 20 l
M
for
AdoMet (averaged from [24] and [25]), and about 15 l
M
for
cysteine [26] can be calculated. The concentration of P
i
in
the spinach chloroplast stroma was shown to be about
10 m
M
[27]. We assumed a similar concentration for
Arabidopsis. The concentration of CGS in the chloroplast
can be estimated as follows: CGS represents 1/11000 of the
soluble proteins in the spinach chloroplast [28], the soluble
protein content in the chloroplast is about 400 mgÆmL
)1
[29], the content of CGS monomer is thus approximately
36 lgÆmL
)1
,thatis0.7l
M
(on a 52-kDa monomer mass
basis). Such data are lacking for TS, however, the ratio
[CGS]/[TS] can be calculated as follows: ELISA assays were
carried out using rabbit antibodies raised against the
recombinant proteins [12,14] and purified proteins as
standards. We measured that an extract of soluble proteins
from Arabidopsis contains 1500 ng TS and 210 ng CGS per
mg protein (data not shown), corresponding to a [CGS]/
[TS] ratio of about 1/7. Thus, [TS] is approximately 5 l
M
in
the chloroplast stroma (7 · 0.7 l
M
). The value of the flux of
Phser in vivo is unknown for Arabidopsis and thus data from
Lemna [30] were used. In this plant, cystathionine and
threonine flux rates are about 1 and 7.9 nmol per frond per
doubling time, respectively. As Phser has no other fate in
plant than the synthesis of cystathionine and threonine [31],
Phser flux rate is about 8.9 nmol per frond per doubling
time. With a doubling time of 41 h [30], a mean frond
cellular volume of 0.509 lL [32] and assuming that Phser is
restricted to the chloroplast (9.5% of cellular volume [33]),
where it is produced and used, a value of 1 l
M
Æs
)1
can be
calculated for the flux of Phser.
Modelling of the Phser branch-point at steady-state
The rate equations of CGS and TS published in [12] and [15]
required to model the branch-point kinetics are expressed
here as hyperbolic functions of Phser concentration. These
forms are equivalent to those previously published but they
suit our modelling purpose better (see later).
The CGS rate equation is defined by Eqn (1):
m
cystathionine
¼
k
app
catCGS
Á½CGSÁ½Phser
K
app
mCGS
þ½Phser
ð1Þ
Where, [CGS] is the CGS monomer concentration, k
app
catCGS
is the apparent catalytic constant for CGS (Eqn 2) and
K
app
mCGS
is the apparent Michaelis–Menten constant for CGS
with respect to Phser (Eqn 3).
k
app
catCGS
¼
k
catCGS
1 þ
K
Cys
mCGS
Â
Cys
Ã
ð2Þ
K
app
mCGS
¼
K
Phser
mCGS
1 þ
K
Cys
mCGS
Â
Cys
Ã
Á 1 þ
½P
i
K
P
i
iCGS
!
ð3Þ
Where, [P
i
] is the concentration of P
i
.P
i
competitively
inhibits Phser binding to CGS [12,17] and K
Pi
iCGS
in Eqn (3)
is the CGS inhibition constant for P
i
.
An equivalent mathematical form of the CGS rate
equation can also be derived (Eqn 4) and will be used in the
Discussion. In this equation, the enzyme velocity is
expressed as a function of [Cys] instead of [Phser].
m
cystathionine
¼
k
appCys
catCGS
Á½CGSÁ½Cys
K
appCys
mCGS
þ½Cys
ð4Þ
Expressed in this form, apparent kinetic parameters k
appCys
catCGS
and K
appCys
mCGS
are defined as functions of [Phser] and [P
i
]by
Eqn (5) and Eqn (6), respectively:
k
appCys
catCGS
¼
k
catCGS
1 þ
K
Phser
mCGS
Â
Phser
Ã
Á 1 þ
½P
i
K
P
i
iCGS
ð5Þ
K
appCys
mCGS
¼
k
Cys
mCGS
1 þ
K
Phser
mCGS
Â
Phser
Ã
Á 1 þ
Â
P
i
Ã
K
P
i
iCGS
ð6Þ
TS catalytic rate depends hyperbolically on the concen-
tration of Phser at any concentration of AdoMet [15]
(Eqn 7).
m
Thr
¼
½TSÁk
app
catTS
Á½Phser
K
app
mTS
þ½Phser
ð7Þ
Where, [TS] is TS monomer concentration, k
app
catTS
is the TS
apparent catalytic constant and K
app
mTS
is the apparent
Michaelis–Menten constant for TS with respect to Phser.
k
app
catTS
and K
app
mTS
are complex functions depending on the
concentration of AdoMet [15] as defined by Eqn (8) and
Eqn (9), respectively.
k
app
catTS
¼
k
noAdoMet
catTS
þ k
AdoMet
catTS
Á
½AdoMet
2
K
1
K
2
1 þ
½AdoMet
2
K
1
K
2
0
@
1
A
ð8Þ
K
app
mTS
¼
250 Á
1þ
½AdoMet
0:5
1þ
½AdoMet
1:1
1 þ
½AdoMet
2
140
0
B
@
1
C
A
Á 1 þ
½P
i
K
Pi
iTS
!
ð9Þ
Where, k
noAdoMet
catTS
and k
AdoMet
catTS
are the TS catalytic constant
in the absence and presence of a saturating concentration of
AdoMet, respectively. K
1
K
2
is the product of the binding
constants for the association of the first and the second
molecule of AdoMet with the TS dimer.
P
i
competitively inhibits Phser binding to TS [17]. K
Pi
iTS
is
the TS inhibition constant for P
i
. K
Pi
iTS
is independent of the
concentration of AdoMet (G. Curien and R. Dumas,
unpublished results). Numerical values in the expression of
K
app
mTS
(expressed in l
M
) correspond to groups of kinetic
constants explaining the effect of AdoMet when present at
Ó FEBS 2003 An Arabidopsis phosphohomoserine branch-point model (Eur. J. Biochem. 270) 4617
low concentrations (< 2 l
M
[15]). Values of the kinetic
parameters for CGS and TS are summarized in Table 1.
The mechanism of inhibition of TS by AMP is unclear,
and some kinetic parameters are lacking. However, as will
be shown below (Results), the AMP effect on partition is
negligible under physiological conditions and for this reason
the inhibition was not taken into account in the present
model.
A simple mathematical procedure was developed to
simulate the steady-state of a two-enzyme branch-point [2].
Three conditions allowed us to use this procedure for the
simulation of the Phser branch-point kinetics. First, the
enzymes homoserine kinase, CGS and TS catalyse irrevers-
ible reactions. Second, Phser flux is an external variable
(Phser concentration does not determine Phser flux, see
above) and third, Phser substrate saturation curves for CGS
and TS are hyperbolic (Eqns 1 and 7). The mathematical
treatment of LaPorte et al. [2] is reproduced here for the
Phser branch-point.
When the branch-point is in steady-state, the flux of Phser
(J
Phser
) is equal to the sum of the flux of cystathionine
(J
cystathionine
) and the flux of threonine (J
Thr
) (Eqn 10).
J
Phser
¼ J
cystathionine
þ J
Thr
ð10Þ
J
cystathionine
and J
Thr
in Eqn (10) can be replaced by CGS
and TS Michaelis–Menten equations (Eqns 1 and 7)
yielding the following quadratic equation (Eqn 11).
½Phser
2
ðJ
Phser
À k
app
catCGS
À k
app
catTS
Þ
þðK
app
mCGS
ðJ
Phser
À k
app
catTS
Þ
þ K
app
mTS
ðJ
Phser
À k
app
catCGS
ÞÞ½Phser
þðJ
Phser
K
app
mCGS
K
app
mTS
Þ¼0 ð11Þ
Solving Eqn (11) yields an expression for [Phser]
steady-state
that can be introduced back into Eqns (1 and 7) yielding
expressions for the output fluxes at steady-state. Such
calculations, based on the integration of independent kinetic
data, are authorized because the initial velocity measure-
ments of purified CGS and TS were carried out under
similar physicochemical conditions (30 °C, pH 7.5–8).
The simulations were carried out with
KALEIDAGRAPH
(Abelbeck Software, Reading, PA, USA). A series of
constant or changing values were generated for the different
input variables and the calculations were done using the
appropriate equations.
Reconstitution of the branch-point
A constant flux of Phser was obtained with purified
homoserine kinase in the presence of saturating concentra-
tions of ATP and homoserine. Two different coupling
systems were used in order to measure threonine and
cystathionine flux. Threonine flux was measured using
purified threonine deaminase and commercial lactate dehy-
drogenase. Threonine deaminase transforms threonine into
oxobutyrate that is further reduced by lactate dehydroge-
nase in the presence of NADH. Cystathionine flux was
measured with cystathionine b-lyase and lactate dehydro-
genase. Cystathionine b-lyase transforms cystathionine into
homocysteine and pyruvate. Pyruvate is reduced by lactate
dehydrogenase in the presence of NADH. The achievement
of the steady-states can be followed with a spectrophoto-
meter (decrease in absorbance at 340 nm). Steady-state
fluxes can be determined in the two branches in independent
reactions containing either threonine deaminase or cysta-
thionine b-lyase mixed with homoserine kinase, CGS, TS
and lactate dehydrogenase.
Experiments were carried out in a thermoregulated quartz
cuvette (30 °C) and in a total volume of 150 lL. Twenty
microlitres of protein mix (0.15 l
M
homoserine kinase,
0.7 l
M
CG, 5 l
M
TS, 2 l
M
lactate dehydrogenase, and 2 l
M
threonine deaminase or 0.7 l
M
cystathionine b-lyase) were
added to a 120-lL solution containing: 50 m
M
Hepes KOH
(pH 8.0), 10 m
M
KP
i
(pH 8.0), 2 m
ML
-homoserine, 200 l
M
NADH, 250 l
ML
-cysteine and 0–100 l
M
AdoMet (final
concentrations). The reaction was started by addition of
ATP-Mg (10 lL, final concentration 2 m
M
ATP, 10 m
M
Mg-Acetate). In the absence of threonine deaminase or
cystathionine b-lyase, the rate of NADH oxidation was
undetectable. Background NADH oxidation was negligible
in the presence of threonine deaminase when homoserine or
ATP were omitted. However, cystathionine b-lyase was
shown to catalyse the degradation of cysteine into pyruvate.
Though certainly a minor quantitative contribution in vivo
where the concentration of cysteine is low (15 l
M
), this
reaction contributed significantly to the production of
pyruvate under our conditions, where the concentrations of
cysteine and cystathionine b-lyase are high. Thus, a correc-
tion had to be made to obtain the actual flux of cystathionine.
The side reaction of cystathionine b-lyase exhibited first-
order kinetic behaviour with respect to cysteine concentra-
tion under our conditions (not shown). The rate was
calculated with the following relation, v ¼ k.[Cystathionine
b-lyase] [Cys] with k ¼ 2.2 10
)4
l
M
)1
Æs
)1
. The concentration
of cysteine at each time point was estimated to be equal to the
initial concentration of cysteine minus the concentration of
NAD
+
at time, t. A small error is made in this calculation as
a consequence of the time delay in the enzymatic chain.
Subtraction of the rate of the cystathionine b-lyase side
reaction from the total rate of NADH oxidation yielded the
actual rate of cystathionine production.
Results
Modelling procedure
In order to model the branch-point between the methionine
and threonine biosynthesis pathways in Arabidopsis the
following procedure was used.
Firstly, the kinetic links inside the branch-point and
between the branch-point system and the rest of the pathway
were identified explicitly. We used some of our previous
results concerning CGS and TS enzymes as well as other
works for this purpose (Fig. 1 and Materials and methods).
Table 1. CGS and TS kinetic parameters.
CGS kinetic parameters TS kinetic parameters
k
catCGS
30 s
)1
k
catTS
noAdoMet
0.42 s
)1
K
mCGS
Cys
460 l
M
k
catTS
AdoMet
3.5 s
)1
K
mCGS
Phser
2500 l
M
K
1
K
2
73 l
M
2
K
iCGS
Pi
2000 l
M
K
iTS
Pi
1000 l
M
4618 G. Curien et al. (Eur. J. Biochem. 270) Ó FEBS 2003
Secondly, as the model aimed to describe a physiological
situation, we characterized the in vivo operating conditions
of the system in terms of input flux, enzyme concentrations
and external metabolite concentrations (AdoMet, cysteine,
P
i
, AMP). We chose to consider the metabolic state of an
illuminated chloroplast leaf cell as many data were available
for this state in Arabidopsis or other plants that can be
considered equivalent. We also determined the in vivo
concentration of CGS and TS in A. thaliana.Details
concerning the sources of the information and the calcula-
tions can be found in Methods. Results are shown in
Table 2.
Thirdly, the rate equations of CGS and TS [12,15] were
used to create a computer model of the steady-state in the
branch-point. The mathematical procedure published pre-
viously for the study of the isocitrate branch-point in E. coli
[2] was adapted to model the Phser branch-point kinetics
(see Materials and methods). Finally, prior to its use for the
examination of branch-point kinetics, the model was
validated in vitro.
Validation of the computer model
The model was derived from initial velocity measurements
carried out with low enzyme concentrations and high
substrate concentrations, that is, under conditions exactly
opposite to those found in the physiological situation. In
order to estimate the validity of the computer model, the
branch-point was reconstituted with purified enzymes and
allowed to reach a steady-state, under conditions as close
as possible to those thought to occur in vivo.Phserwas
delivered in flux by the ÔupstreamÕ enzyme (homo-
serine kinase). The fluxes of cystathionine and threonine
(J
cystathionine
and J
Thr
) were measured with the enzymes
that occur downstream of CGS and TS, namely cystathi-
onine b-lyase and threonine deaminase, respectively,
coupled to lactate dehydrogenase. Under these conditions,
CGS and TS were operating in vitro at physiological
concentration, with Phser concentration set by the system
and in the presence of the reaction products, neighboring
enzymes and salts (K
+
and Mg
2+
). Phser flux had to be
set at one third of its estimated value in the chloroplast of
an illuminated leaf cell to minimize substrate consump-
tion. In addition, the concentration of cysteine was set at
250 l
M
rather than 15 l
M
(physiological concentration).
Indeed, it was difficult to achieve a constant concentration
of cysteine. However, as will be detailed later, CGS
velocity was saturated by cysteine in these conditions and
J
cystathionine
was not affected by the consumption of
cysteine. The time courses of the reactions in the presence
of 20 l
M
AdoMet are displayed in Fig. 2A, showing that
the fluxes reached a steady-state in about 600 s. Results in
Fig. 2A confirmed that CGS was saturated by cysteine
throughout the time course of the reactions, otherwise
Table 2. Estimated values of the input variables in a leaf cell chloroplast.
The values of the input variables were derived as indicated in Materials
and methods from measurements carried out on illuminated photo-
synthetic leaf tissue.
Input
variable
J
Phser
(l
M
Æs
)1
)
Concentration (l
M
)
Concentration
(m
M
)[P
i
]
[CGS] [TS] [AdoMet] [Cys]
1 0.7 5 20 15 10
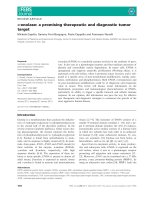
Fig. 2. Phser branch-point kinetic behaviour in vitro. (A) establishment
of the steady-state. The flux of cystathionine (lower curve) was
measured with cystathionine b-lyase and lactate dehydrogenase and
threonine flux (upper curve) was measured with threonine deaminase
and lactate dehydrogenase. The flux of Phser was generated with
homoserine kinase in conditions where substrates were saturating.
Phser flux, 0.3 l
M
Æs
)1
;AdoMet,20l
M
; cysteine, initial concentration,
250 l
M
;P
i
,10m
M
;CGS,0.7l
M
;TS,5l
M
. The rate of NADH oxi-
dation at each time point was calculated from the absorbance time
curves (A
340
)withaDt of 20 s. (B) Steady-state flux of cystathionine
(m) and threonine (d) in the reconstituted branch-point as a function
of the concentration of AdoMet. Experimental conditions were as in
(A). The total flux (h) is the sum of the fluxes of cystathionine and
threonine at steady-state. The experimental points were fitted to Hill
equations. The thick curves are flux values calculated with the com-
puter model using CGS and TS mechanistic equations. Input variables
were set at the value they have in the experiment. (C) The experimental
results in (B) were compared with the predictions using the improved
version of the numerical model (bold curves; details in the text).
Ó FEBS 2003 An Arabidopsis phosphohomoserine branch-point model (Eur. J. Biochem. 270) 4619
steady-state fluxes could not have been obtained. The
experiment was carried out for different AdoMet concen-
trations and outflow values measured at steady-state were
plotted as a function of AdoMet concentration (Fig. 2B).
J
cystathionine
and J
Thr
summed to a constant value, thus
confirming that steady-state had been reached. (For
[AdoMet] < 5 l
M
, the time constant of the system was
high and steady-state may not be entirely reached.)
Figure 2B shows that J
cystathionine
and J
Thr
are strongly
dependent on the AdoMet concentration, in the range
0–100 l
M
. The fluxes showed a sigmoidal dependence on
the concentration of AdoMet with J
cystathionine
decreasing
and J
Thr
increasing as the concentration of AdoMet was
increased. Half changes in J
cystathionine
and J
Thr
are
obtained for a concentration in AdoMet of about
15 l
M
, i.e. for a value close to the estimated cellular
concentration.
In order to determine whether the properties of isolated
CGS and TS, as defined by their mechanistic equations
(Eqns 1–9, Materials and methods), could explain the
observed behaviour in Fig. 2B, the computer model
described in the Materials and methods was used to
calculate J
cystathionine
and J
Thr
as a function of the concen-
tration of AdoMet with the remaining input variables set at
the experimental values used to obtain Fig. 2B. As shown in
Fig. 2B, the experimental fluxes depend on the concentra-
tion of AdoMet in a manner similar to that predicted by the
computer model. [The small bumps in the theoretical curves
barely discernable at low AdoMet concentration originate
from the complex dependence of TS K
m
for Phser on
AdoMet at low concentration (Eqn 9). This effect is either
too subtle to be detected in the present experiments or
irrelevant to the present experimental conditions.] However,
despite good agreement, the model was not entirely
satisfying. Indeed, when experimental and predicted curves
are fitted with Hill equations, the Hill number thus obtained
is much higher in the first case (n
H
¼ 2.7) than in the second
(1.8).
Improvement of the computer model
We anticipated that the discrepancy between the computer
model and the experimental data originated from an
inadequacy of the TS mechanistic equation. This equation
correctly describes the interaction between TS and AdoMet
in the presence of high concentrations of Phser [15].
However, the model indicates that when TS operates at
the branch-point, Phser concentration is low ([Phser] <<
K
app
mTS
). Moreover, the presence of P
i
prevents the binding of
Phser on the enzyme and contributes to a decrease in the
concentration of the enzyme-substrate complex. Under
these conditions, AdoMet binds on the enzyme which is
virtually free of substrate. We showed previously [15] that a
synergy exists between Phser and AdoMet for their binding
to TS. The Hill number calculated for the free enzyme/
AdoMet binding curve was about three and only about two
for the enzyme–substrate/AdoMet binding curve. As a
consequence, a new equation had to be derived for AdoMet
binding to TS under the present conditions where the
enzyme-substrate complex concentration was low. For this
purpose, it was first observed that, when TS operates at the
branch-point, the calculated concentration of Phser ranged
from 1000 l
M
(no AdoMet) to 5 l
M
(100 l
M
AdoMet)
(Fig. 4C). Under these conditions we observed graphically
(not shown) that TS catalytic rate at the branch-point is
approximately first-order with respect to Phser concentra-
tion at any AdoMet concentration. So the complicated
mathematical expression of TS velocity (Eqns 7–9) could be
simplified to a linear equation for Phser concentration
(Eqn 12).
m
Thr
¼½TS
k
TS
1 þ
½P
i
K
P
i
iTS
½Phserð12Þ
where, k
TS
is TS apparent specificity constant for Phser
(k
app
catTS
=K
app
mTS
). k
TS
is a function of the concentration of
AdoMet that can be determined experimentally. In order
to obtain this function, TS velocity (TS alone) was
measured as a function of the concentration of AdoMet
in the physicochemical environment of the experiments of
Fig. 2. Threonine deaminase and lactate dehydrogenase
were used as the coupling system and TS activity was
measured in the presence of a low concentration of Phser
(500 l
M
). The experimental results (not shown) were fitted
to a Hill equation thus giving the following empirical
equation for k
TS
(Eqn 13).
k
TS
¼ 5:4 Â 10
À5
þ
6:210
À3
½AdoMet
2:9
32
2:9
þ½AdoMet
2:9
ð13Þ
When the branch-point behaviour was simulated with Eqns
(12 and 13) instead of the TS mechanistic equations
(Eqns 7–9) the computer model was in much better
agreement with the experimental results (Fig. 2C). These
results confirm that TS velocity is first-order with respect to
Phser concentration. Moreover the agreement indicates that
the branch-point behaviour is fully explained by the
individual enzyme’s kinetic properties. More complex
phenomena such as protein–protein interactions, need not
be invoked to explain the behaviour of the system in
response to changes in AdoMet concentration.
AMP inhibition does not affect partition
As a kinetic mechanism for the inhibition of TS activity by
AMP is unclear, and kinetic parameters are lacking, it was
of special interest to use the in vitro system to test the effect
of AMP on the partition of the flux of Phser under
physiological conditions. The partition was measured in
the conditions of Fig. 2B in the presence of 20 l
M
AdoMet
and a physiological concentration of AMP (100 l
M
[34]).
Under these conditions, we observed that the partition was
the same whether AMP was present or not (result not
shown) indicating that AMP was efficiently displaced in
these conditions. [Measurements of TS initial catalytic rate
showed that the binding of AMP to TS is efficiently
displaced by AdoMet and P
i
(G. Curien and R. Dumas,
unpublished observations)]. Our results suggest that the
presence of AMP in vivo does not have any quantitative
consequence on the partition of the flux of Phser, at least
under the physiological operating conditions defined in
Table 2. As a consequence, the inhibitory effect is not
taken into account in the model.
4620 G. Curien et al. (Eur. J. Biochem. 270) Ó FEBS 2003
Consistency with data collected in planta
Measurements in planta [32] indicated that J
cystathionine
and
J
Thr
represent 11% and 89% of the flux of Phser,
respectively. The numerical model using the simplified TS
equation (Fig. 2C) or the in vitro model give a value of 20–
30% for J
cystathionine
(and 70–80% for J
Thr
)at20l
M
AdoMet. Considering that flux partition is highly sensitive
to the concentrations of AdoMet and of the competing
enzyme concentrations (see later) and thus to small errors in
the estimation of their physiological values, the consistency
is satisfying. The in vitro and numerical models are
consistent with J
Thr
being larger than J
cystathionine
in the
metabolic condition of a leaf cell. Also, a Phser concentra-
tion of about 80 l
M
in A. thaliana leaf chloroplast can be
derived from the measurements in planta, in good agreement
with the model which predicts a value of about 128 l
M
.The
Phser content in A. thaliana leaves is about 6.6 nmolÆg
)1
fresh weight [23]. The concentration was calculated assu-
ming that Phser is restricted to the chloroplast (60 lLÆmg
)1
chlorophyll [33] and 1.3 mg chlorophyll per gram fresh
weight [34]). Together, these data indicate that the model of
the Phser branch-point is relevant to at least one metabolic
situation and therefore provides a realistic, detailed descrip-
tion of the branch-point between the methionine and
threonine biosynthesis pathways. In the following the model
is used to investigate the sensitivity of the two-enzyme
system to the different input variables and to explain the
behaviour of the branch-point in terms of the kinetic
properties of CGS and TS.
Sensitivity analysis
In a first analysis, fluxes of cystathionine and threonine
(Fig. 3) were calculated as a function of each input
variable. The fixed input variables were set at their
physiological values (Table 2). Although the curves in
Fig. 3 are displayed for a large range of the changing
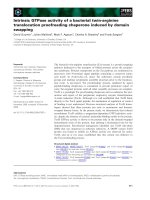
Fig. 3. Calculated fluxes in the vicinity of the physiological operating point. The steady-state fluxes were calculated with the improved version of the
computer model in which the TS equation was the simplified empirical equation (Eqn 12). All input variables but one (indicated beneath the graphs
abscissa) were set at their values in an illuminated leaf cell chloroplast (Table 2). The dotted lines in the graphs indicate the value of the changing
input variable in the physiological context considered. The flux response coefficients were calculated from these curves and are indicated in Table 3.
Ó FEBS 2003 An Arabidopsis phosphohomoserine branch-point model (Eur. J. Biochem. 270) 4621
input variables, the analysis has to be limited to the
vicinity of the physiological operating point, especially
when a high sensitivity to the changing variable is
predicted. Indeed, the values of the input variables
in vivo for a metabolic context that is very different from
the one indicated in Table 2 are unknown. In order to
describe the sensitivity of the system at the physiological
operating point in quantitative terms, the results in Fig. 3
were used to calculate the flux response coefficients as
defined in the framework of metabolic control analysis
[35–40]. The results are displayed in Table 3. The changes
in flux and their sensitivities are explained by variations in
the concentration of Phser. For this reason, the concen-
tration of Phser calculated for each of the situations
analysed are indicated in Fig. 4.
From the results in Table 3 one can verify that the
summation relationship [35] between control coefficients is
satisfied in the three enzyme system, thus, showing an
internal consistency of the model. Indeed
R
Jcystathionine
CGS
þ R
Jcystathionine
TS
þ R
Jcystathionine
JPhser
¼ 1
(R
Jcystathionine
JPhser
is the homoserine kinase control coefficient
over cystathionine flux). The same relation is obtained
for J
Thr
.
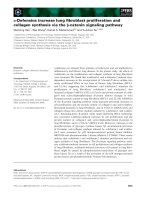
Fig. 4. Calculated Phser concentration for changing input variables. Phser concentrations corresponding to the steady-state conditions calculated in
Fig. 3 are plotted as a function of the changing input variable with the other input variables set at their physiological values. The dotted lines in the
graphs indicate the value of the changing input variable in the physiological context considered.
Table 3. Flux response coefficients. The values of the flux response
coefficients (R
J i
I
¼ (DJ/J)/(DI/I)) where J stands for flux and I for input
variable) were calculated using the curves in Fig. 3 for the estimated
physiological environment of the Phser branch-point in Arabidopsis
leaf chloroplast. R
J
I
¼ a means that a 1% change in I around a given
value promotes an a percent change in flux J. A negative value means
that input variable and flux vary in opposite directions.
Input
variable
(I)
Input variable
physiological value
(illuminated leaf cell) R
I
Jcystathionine
R
JThr
I
AdoMet 20 l
M
)1.55 0.25
Cys 15 l
M
0.18 )0.03
P
i
10 m
M
0.06 )0.007
[CGS] 0.7 l
M
0.89 )0.1
[TS] 5 l
M
)0.7 0.11
J
Phser
1 l
M
Æs
)1
0.81 1.03
4622 G. Curien et al. (Eur. J. Biochem. 270) Ó FEBS 2003
Next, we analysed the sensitivity of the flux of cystathi-
onine and threonine to P
i
, cysteine, AdoMet, CGS and TS
concentrations as well as to Phser input flux in the three
enzyme system.
Sensitivity to P
i
. The sensitivity of the system to P
i
was
considered because the concentration of P
i
in the chloroplast
is high and variable (from 5 to 30 m
M
depending on the
physiological state of the cell [27]). The calculations indicate
that the flux response coefficients for P
i
are very low
(Table 3). Figure 3A also shows that J
cystathionine
and J
Thr
are virtually unmodified despite important changes in the
concentration of P
i
. Indeed, K
iP
i
values for CGS and TS are
similar and lower than the physiological concentration of P
i
.
Note that the linear dependence of Phser concentration on
the concentration of P
i
(Fig. 4A) is due to the competitive
nature of the inhibition.
Sensitivity to cysteine. An advantage of the computer
model is the possibility to vary the concentration of cysteine
around the estimated physiological concentration (15 l
M
).
This was not possible in the experiments used for Fig. 2B
(see above). Table 3 indicates that the flux response
coefficients for the cystathionine and threonine fluxes at
15 l
M
cysteine are low (0.18 and )0.03, respectively). Also,
Fig. 3B shows that when the concentration of cysteine is
increased above 15 l
M
, the fluxes are modified only slightly.
This result indicates that the partition experimentally
determined in Fig. 2B at 20 l
M
AdoMet would not have
been different if cysteine concentration had been set at
15 l
M
instead of 250 l
M
. Figure 3B also explains why
cysteine consumption left J
cystathionine
unaffected in the
experiments described in Fig. 2B. This response of the
system to cysteine will be related to the kinetic mechanism of
CGS later.
Sensitivity to AdoMet. Figure 3C indicates that the con-
centration of AdoMet determines Phser flux partition in a
much more sensitive manner than do cysteine and P
i
.At
20 l
M
AdoMet, J
Thr
is larger than J
cystathionine
in accordance
with the in vivo situation (see above). Therefore, although
AdoMet-mediated changes in J
Thr
promote quantitatively
equivalent opposite changes in J
cystathionine
, relative changes
(flux response coefficient), are larger for J
cystathionine
than for
J
Thr
(Table 3). In the model, J
cystathionine
is about six times
more sensitive to AdoMet than J
Thr
for AdoMet at 20 l
M
.
These calculations highlight an asymmetry in the branch-
point. J
Thr
and J
cystathionine
are not equivalent with respect to
changes in the concentration of AdoMet.
Sensitivity to the concentration of CGS and TS. In the
model, an increase or a decrease in the concentration of one
of the branch-point enzymes promotes an increase or a
decrease in the flux in the corresponding branch and a
quantitatively equivalent but opposite change in the flux in
the other branch (Fig. 3D,E). However, as observed for
AdoMet, and as a consequence of the flux imbalance, an
asymmetry in the response is observed. As indicated in
Table 3, J
Thr
presents a low sensitivity to changes in the
concentration of the enzymes (for TS % 5 l
M
and
CGS % 0.7 l
M
). By contrast, J
cystathionine
is about six times
more sensitive in the same conditions.
Sensitivity to J
Phser
. Individual output fluxes are expected
to present a different sensitivity on J
Phser
depending on the
absolute and relative degree of saturation of CGS and TS by
the common substrate Phser. Figure 3F indicates that the
flux of threonine depends in a quasi-linear manner on J
Phser
whereas the flux of cystathionine displays a slight downward
curvatureforthesamerangeofJ
Phser
values. When a larger
range for J
Phser
is considered (not shown) the curve for
threonine flux displays an upward curvature. Accordingly,
the sensitivity of J
Thr
is slightly higher than unity (1.03,
Table 3), and the sensitivity of J
cystathionine
is lower
(R
J cystathionine
J Phser
¼ 0.8) for the physiological state considered.
Figure 4F indicates that the Phser steady-state concentra-
tion depends in a quasi-linear manner on J
Phser
.Usinga
larger scale for the abscissa (not shown) would reveal an
upward curvature. Indeed, [Phser]
steady-state
increases hyper-
bolically and reaches infinity as J
Phser
gets closer to the sum
of CGS and TS maximal catalytic rates. In the next part this
response of the system to J
Phser
will be related to the enzyme
individual properties, but the important point here is the
following: Fig. 3F indicates that, as J
Phser
is increased and
the concentration of Phser increases (Fig. 4F), the outflows
are modified in the same sense and to a similar extent. The
model thus predicts that changes in Phser flux in the range
0–2 l
M
Æs
)1
taking place with no changes in the other input
variables, would not modify partition. In other words,
changes of the output fluxes are coordinated in these
conditions. Note that as the simulations indicate that
partition is not a sensitive function of the flux of Phser,
small errors in the estimation of its in vivo value would not
change the conclusions. Also partition measured in Fig. 2
with Phser flux set at 0.3 l
M
Æs
)1
would not be different at
1 l
M
Æs
)1
.
Comparison of CGS and TS kinetic efficiencies under
physiological operating conditions
In order to detail the characteristics of the branch-point in
terms of the individual enzyme properties, the kinetic
efficiencies of CGS and TS (v/[E]) were calculated for the
physiological context considered (Table 2). Results in Fig. 5
show that, under these conditions, using either the mech-
anistic or the simplified rate equations for TS (details in Fig.
legends), the saturation curves of CGS and TS by Phser are
very similar in the concentration range investigated. The
concentration of Phser in the stroma is about 80 l
M
(see
above). Under these conditions, the model suggests that
CGS and TS have similar kinetic efficiencies in the in vivo
context. Moreover, both enzymes (and not only TS as
indicated previously) operate in the first-order range for
Phser concentrations under physiological conditions. These
two features explain the response of the system to the
modifications of the flux of Phser as indicated in Fig. 3F.
Consequences of CGS ping-pong kinetic mechanism
on the branch-point kinetic properties
As CGS follows a ping-pong mechanism, its specificity
constant for Phser, in marked difference with a sequential
mechanism, does not depend on the second substrate
(cysteine) concentration (Eqns 2 and 3). Therefore, as the
concentration of cysteine is increased, CGS velocity curve
Ó FEBS 2003 An Arabidopsis phosphohomoserine branch-point model (Eur. J. Biochem. 270) 4623
for low concentrations of Phser is not modified and thus
remains similar to the TS velocity curve as indicated in
Fig. 5.
Another property of the ping-pong mechanism is the
hyperbolic dependence of the apparent K
m
for one substrate
on the concentration of the other substrate (Eqns 3 and 6).
This explains why the flux of cystathionine is saturated for
low concentrations of cysteine (Fig. 3B). Indeed, as the
concentration of Phser is low in the physiological conditions
considered, the K
m
for cysteine is low. For example, at
80 l
M
Phser the apparent K
m
for cysteine is 2.5 l
M
. Thus, at
15 l
M
cysteine (6 · K
m
), CGS velocity is virtually maximal
(Fig. 6). Though a similar relation exists for the apparent
K
m
for Phser and cysteine concentration (Eqn 3), the
situation is not symmetrical from a quantitative point of
view for two reasons: firstly, the maximal K
m
for cysteine
is lower than for Phser (K
Cys
mCGS
¼ 460 l
M
and
K
Phser
mCGS
¼ 2500 l
M
, Table 1); Secondly, this difference is
amplified in the presence of P
i
which increases the apparent
K
m
for Phser and decreases the apparent K
m
for cysteine
(Eqns 3 and 6). Therefore, in the physiological context
considered, CGS operates in the first-order range with
respect to Phser (Fig. 5), but is virtually saturated by
cysteine in the same range of concentration (Fig. 6).
Time-constant of the branch-point system
Physiological changes in the concentration of P
i
do not
modify the partition (Fig. 3A). However, the presence of P
i
considerably affects the dynamics of the system. Indeed, in
the presence of 10 m
M
P
i
, the model indicates that the
catalytic rates of CGS and TS are divided by a factor of 6
and 11, respectively, compared to a situation without P
i
.
One can therefore calculate that the time constant [41] of the
branch-point system (s) is about 20 times higher in the
presence of 10 m
M
P
i
(102 s) than in its absence (4.8 s) [In
the physiological operating condition considered, CGS and
TS are first-order with respect to their common substrate
(Fig. 5). Thus, the time constant of the branch-point (s)is
defined by the following equation:
s ¼
1
k
CGS
Á½CGSþk
TS
Á½TS
where, k
CGS
and k
TS
are CGS and TS specificity
constants. Considering that following a perturbation
the steady-state is reached after approximately 5· s [41],
methionine and threonine metabolisms are rather slow,
with the kinetic controls potentially operating in a time
scale of at least 10 min].
Discussion
Prior to the present study, the only model available for the
branch-point between the methionine and threonine bio-
synthesis pathways in the plant was the qualitative model
shown in Fig. 1. The allosteric interaction of TS with
AdoMet was observed in vitro with the enzyme isolated
from the other enzymes of the system [10,13–16], suggesting
that the allosteric interaction had a function in the control of
Phser partition in vivo. However, no experimental results,
whether in vivo or in complete systems in vitro, supported
this assumption [31]. As TS activity is inhibited by AMP
in vitro some authors denied a physiological importance for
the allosteric activation of TS by AdoMet [16]. In addition
to this controversy, the quantitative influences of the
inhibitor phosphate and cysteine (CGS second substrate)
on the branch-point kinetics have never been considered.
In order to solve these questions we established a
computer model of the branch-point and validated it
in vitro. A satisfying but imperfect agreement of the
predictions with the experimental results lead us to improve
the model with a simplification of the TS mechanistic
equation. The improved version of the numerical model was
in a very good agreement with the in vitro results and
consistent with threonine and cystathionine syntheses
in vivo. Our results show that although AMP is an inhibitor
of TS in vitro [16,17], this general metabolite has no effect on
the partition of the flux of Phser in the branch-point when
present at a physiological concentration. This result thus
Fig. 6. CGS velocities calculated as a function of cysteine concentration.
P
i
concentration is 10 m
M
and Phser concentration is as indicated. The
dotted vertical line indicates the physiological operating condition (leaf
chloroplast).
Fig. 5. Comparison of the kinetic efficiencies of CGS and TS. CGS and
TS velocities as a function of Phser concentration. v/[CGS] (thin line)
was calculated using Eqns (1–3). v/[TS] was calculated using either the
mechanistic equation (Eqns 7–9), thick line, or TS empirical simplified
equation (Eqn 12), thick dotted line. For the calculations [cys-
teine] ¼ 15 l
M
, [AdoMet] ¼ 20 l
M
and [P
i
] ¼ 10 m
M
.Underthese
conditions, K
app
mCGS
¼ 474 l
M
, k
app
catCGS
¼ 0.95 s
)1
, K
app
mTS
¼ 1526 l
M
and k
app
catTS
¼ 3.02 s
)1
. The dotted vertical line indicates the physiolo-
gical operating condition (leaf chloroplast).
4624 G. Curien et al. (Eur. J. Biochem. 270) Ó FEBS 2003
strongly suggests that TS allosteric activation by AdoMet is
physiologically significant. Our results validate the qualit-
ative model in Fig. 1 and strongly suggest that there is
indeed a single allosteric control at the Phser branch-point
in plants. The concentration of AdoMet determines the
partition of flux between the cystathionine and threonine
synthesis pathways. However, the model shows that, as a
consequence of an imbalance in the partition of Phser flux
(threonine flux is much more important than cystathionine
flux), the cystathionine flux (but not threonine flux) is highly
sensitive to changes in AdoMet concentration. The interac-
tion of AdoMet with TS is therefore consistent with
AdoMet being part of a negative feedback mechanism for
methionine synthesis, as an increase in AdoMet concentra-
tion decreases cystathionine flux in a highly sensitive
manner. Nevertheless, a definitive answer concerning the
function of the allosteric activation of TS can still not be
given. Indeed, in the three-enzyme system of the present
study (in vitro and in the computer model) homoserine
kinase is not inhibited by its product [22] and therefore
necessarily controls the overall flux (J
cystathionine
+ J
Thr
).
This is however, not true in the complete system of the
aspartate pathway where AdoMet and threonine potentially
control the flux of Phser (Fig. 1). These molecules act,
respectively, on lysine/AdoMet-sensitive aspartate kinase
[42] and on threonine-sensitive aspartate kinase-homoserine
dehydrogenase [43]. Sensitivities of the fluxes of cystathio-
nine and threonine to AdoMet may thus be modified when
the branch-point is embedded in the aspartate system. Two
scenarios were previously proposed [31]: in the first, the
activating interaction of AdoMet with TS may attenuate
the changes in the flux of threonine due to a modification of
the level of AdoMet. Indeed, upon an increase in the level of
AdoMet, TS is activated but Phser flux may simultaneously
decrease via the inhibition of AdoMet/lysine-sensitive
aspartate kinase by AdoMet. In the second more frequently
proposed scenario, AdoMet mediates an indirect negative
feedback for the synthesis of methionine, via the activation
of TS by AdoMet, followed by the inhibition of bifunctional
aspartate kinase-homoserine dehydrogenase by threonine.
In this case, it is implicitly assumed that the interaction of
AdoMet with AdoMet/lysine-sensitive aspartate kinase
does not control Phser flux. If one assumes that regulatory
mechanisms need to be sensitive to be efficient, the low
sensitivity of the threonine flux to AdoMet indicated by our
model together with the existence of a large pool of
threonine in plant cell (about 1 m
M
) may argue against the
indirect negative feedback mechanism scenario. As in vivo
experiments [31] failed to distinguish between the two
scenarios, a computer model taking into account the
properties of the enzymes upstream the Phser branch-point
is required to solve this question definitively.
An issue of interest with respect to flux partition at a
branch-point concerns the relative degree of dependence of
the diverging pathways. The model shows that cystathio-
nine flux is sensitive to threonine flux but that the reverse is
not true. Therefore, the model suggests that threonine flux is
relatively independent of what happens on the cystathionine
side. The Phser branch-point combines the divergence of
two fluxes (fluxes of cystathionine and threonine) with the
convergence of two fluxes (fluxes of Phser and cysteine).
Interestingly, the properties of CGS are such that the flux of
cystathionine and, as a consequence the flux of threonine,
present a low sensitivity to the CGS second substrate
cysteine. According to the model, a large increase in the
concentration of cysteine, to sustain a larger demand for
glutathione for example, may occur without major effects
on the fluxes of cystathionine and threonine. CGS proper-
ties thus confer independence between the cysteine and the
cystathionine/threonine fluxes. The nature of the kinetic
mechanism of CGS (a ping-pong mechanism) is particularly
favourable to such an effect. For a sequential mechanism
(ternary complex mechanism) the apparent K
m
for one
substrate does not stringently depend on the concentration
of the second substrate. The same performance with a two-
substrate enzyme following a sequential mechanism would
therefore require either a very high concentration of cysteine
oraverylowK
m
for cysteine. The constraints imposed by
two-substrate enzyme kinetic mechanisms may thus be
important to consider when one plans to modify or create a
branch-point in a living organism for industrial purposes.
In addition to the control of partition due to kinetic
interactions, the model shows that partition is determined
by the relative abundance of CGS and TS enzymes. At
20 l
M
AdoMet, the imbalance of the fluxes results only
from the difference in protein concentrations, as CGS and
TS catalytic efficiencies are similar (Fig. 5). Partition is thus
determined in these conditions by the regulatory processes
which control the enzymes’ abundance. Interestingly,
whereas no mechanisms that would change the concentra-
tion of TS could be identified in planta, AdoMet was shown
to control CGS mRNA abundance in plants [31,44–47].
This mechanism involves the N-terminal part of CGS. The
time constant of this control is unknown. If this time
constant is much larger than the time constant of the kinetic
controls (about 100 s) then the separation of the kinetic and
genetic controls (an implicit assumption in our model)
would be justified.
The characteristics of the Phser branch-point described in
Fig. 5 clearly distinguishes this branch-point from the
isocitrate branch-point in E. coli [2,4,5]. In the latter,
isocitrate dehydrogenase is saturated by the common
substrate isocitrate whereas the competing enzyme (isocitrate
lyase) exhibits first-order kinetics for this substrate concen-
tration. This organization allows the isocitrate branch-point
to operate as a switch. Upon growth on acetate, the flux of
isocitrate increases and isocitrate dehydrogenase is inhibited
by phosphorylation. The flux through isocitrate lyase thus
increases 300-fold, switching on the glyoxylate shunt. The
Phser branch-point with its two enzymes operating in the
first-order range with respect to the common substrate
concentration cannot display such a switch property, but
instead allow flux coordination. Outflows may increase to a
similar extent as Phser flux increases. Such a change in the
input flux with the other variables left unchanged may
correspond to an increase in carbon supply in vivo (upon
increase in light intensity for example).
The extent to which the Phser branch-point can serve as a
model for the other two-partner branch-points is hard to
establish. It would be necessary to determine the physiol-
ogical operating conditions and obtain kinetic data of
physiological significance before a valid comparison is
possible. However, one can hypothesize that the enzyme
kinetic properties in the other two-partner branch-points of
Ó FEBS 2003 An Arabidopsis phosphohomoserine branch-point model (Eur. J. Biochem. 270) 4625
the aspartate-derived amino-acids pathway and aromatic
amino-acids pathway in plant and in microorganisms are
such that flux coordination could also be obtained. The
distribution of the carbon skeleton toward the various end-
products would not be affected when supply increases or
decreases in these conditions. If this is true then, as shown
here for TS, limited in vitro kinetic characterization of the
allosteric enzymes involved at these branch-point would be
required to obtain equations and parameters to model the
behaviour of the branch-points. This possibility may be of
special interest to simplify the characterization of branch-
points where the enzyme activities are controlled by
numerous allosteric interactions.
Acknowledgements
We wish to thank Marie-Christine Butikofer and Vale
´
rie Verne for the
ELISA assays. We thank Pr. Roland Douce and Dr Michel Matringe
and Mickae
¨
la Hoffman for critical reading of the manuscript. Special
thanks to Maighread Gallagher for the correction of the English. This
work was supported by BayerCropScience 14–20 Rue Pierre Baizet
69263 Lyon cedex 09 (France).
References
1. Kacser,H.(1983)Thecontrolofenzymesystemsin vivo: elasticity
analysis of the steady state. Biochem. Soc. Trans. 11, 35–40.
2. LaPorte, D.C., Walsh, K. & Koshland, D.E. (1984) The branch
point effect. Ultrasensitivity and subsensitivity to metabolic con-
trol. J. Biol. Chem. 259, 14068–14075.
3. Brown, G.C., Hafner, R.P. & Brand, M.D. (1990) A Ôtop-downÕ
approach to the determination of control coefficients in metabolic
control theory. Eur. J. Biochem. 188, 321–325.
4. Walsh, K. & Koshland, D.E. (1984) Determination of flux
through the branch point of two metabolic cycles. The tri-
carboxylic acid cycle and the glyoxylate shunt. J. Biol. Chem. 259,
9646–9654.
5. Walsh, K. & Koshland, D.E. (1985) Branch point control by the
phosphorylation state of isocitrate dehydrogenase. A quantitative
examination of fluxes during a regulatory transition. J. Biol.
Chem. 260, 8430–8437.
6. Ainscow, E.K. & Brand, M.D. (1999) Top-down control analysis
of ATP turnover, glycolysis and oxidative phosphorylation in rat
hepatocytes. Eur. J. Biochem. 263, 671–685.
7. Hoefnagel, M.H., Starrenburg, M.J., Martens, D.E., Huge-
nholtz, J., Van Kleerebezem, M., Van Swam, I.I., Bongers, R.,
Westerhoff, H.V. & Snoep, J.L. (2002) Metabolic engineering of
lactic acid bacteria, the combined approach: kinetic modelling,
metabolic control and experimental analysis. Microbiology 148,
1003–1013.
8. Saint-Girons, I., Parsot, C., Zakin, M.M., Barzu, O. & Cohen,
G.N. (1988) Methionine biosynthesis in Enterobacteriaceae:bio-
chemical, regulatory, and evolutionary aspects. CRC Crit. Rev.
Biochem. 23, S1–S42.
9. Datko,A.H.,Giovanelli,J.&Mudd,S.H.(1974)Homocysteine
biosynthesis in green plants. O-phosphorylhomoserine as the
physiological substrate for cystathionine gamma-synthase. J. Biol.
Chem. 249, 1139–1155.
10. Madison, J.T. & Thompson, G.H. (1976) Threonine synthase from
higher plants: stimulation by S-adenosylmethionine and inhibition
by cysteine. Biochem. Biophys. Res. Commun. 71, 684–691.
11. Wallsgrove, R.M., Lea, P.J. & Miflin, B.J. (1983) Intracellular
localisation of aspartate kinase and the enzymes of threonine and
methionine biosynthesis in green leaves. Plant Physiol. 71, 780–
784.
12. Ravanel, S., Gakiere, B., Job, D. & Douce, R. (1998) Cystathio-
nine gamma-synthase from Arabidopsis thaliana:purificationand
biochemical characterization of the recombinant enzyme over-
expressed in Escherichia coli. Biochem. J. 331, 639–648.
13. Giovanelli, J., Veluthambi, K., Thompson, G.H., Mudd, S.H. &
Datko, A.H. (1984) Threonine synthase of Lemna paucicostata
Hegelm. 6746. Plant Physiol. 76, 285–292.
14. Curien, G., Dumas, R., Ravanel, S. & Douce, R. (1996) Char-
acterization of an Arabidopsis thaliana cDNA encoding an
S-adenosylmethionine-sensitive threonine synthase. Threonine
synthase from higher plants. FEBS Lett. 390, 85–90.
15.Curien,G.,Job,D.,Douce,R.&Dumas,R.(1998)Allosteric
activation of Arabidopsis threonine synthase by S-adeno-
sylmethionine. Biochemistry 37, 13212–13221.
16. Laber, B., Maurer, W., Hanke, C., Grafe, S., Ehlert, S., Mess-
erschmidt, A. & Clausen, T. (1999) Characterization of
recombinant Arabidopsis thaliana threonine synthase. Eur. J.
Biochem. 263, 212–221.
17. Giovanelli, J., Mudd, S.H., Datko, A.H. & Thompson, G.H.
(1986) Effects of orthophosphate and adenosine 5¢-phosphate on
threonine synthase and cystathionine gamma-synthase of Lemna
paucicostata Hegelm. 6746. Plant Physiol. 81, 577–583.
18. Ravanel, S., Job, D. & Douce, R. (1996) Purification and prop-
erties of cystathionine beta-lyase from Arabidopsis thaliana over-
expressed in Escherichia coli. Biochem. J. 320, 383–392.
19. Wessel, P.M., Graciet, E., Douce, R. & Dumas, R. (2000) Evi-
dence for two distinct effector-binding sites in threonine deaminase
by site-directed mutagenesis, kinetic, and binding experiments.
Biochemistry 39, 15136–15143.
20. Scopes, R.K. (1974) Measurement of protein by spectroscopy at
205 nm. Anal. Biochem. 59, 277–282.
21. Burr, B., Walker, J., Truffa-Bachi, P. & Cohen, G.N. (1976)
Homoserine kinase from Escherichia coli K12. Eur. J. Biochem. 62,
519–526.
22. Aubert, S., Curien, G., Bligny, R., Gout, E. & Douce, R. (1998)
Transport, compartmentation, and metabolism of homoserine in
higher plant cells. Carbon-13- and phosphorus-31-nuclear mag-
netic resonance studies carbon-13- and phosphorus-31-nuclear
magnetic resonance studies. Plant Physiol. 116, 547–557.
23. Gakiere, B., Ravanel, S., Droux, M., Douce, R. & Job, D. (2000)
Mechanisms to account for maintenance of the soluble methionine
pool in transgenic Arabidopsis plants expressing antisense
cystathionine gamma-synthase cDNA. C. R. Acad. Sci. III 323,
841–851.
24. Bartlem, D., Lambein, I., Okamoto, T., Itaya, A., Uda, Y., Kij-
ima, F., Tamaki, Y., Nambara, E. & Naito, S. (2000) Mutation in
the threonine synthase gene results in an over-accumulation of
soluble methionine in Arabidopsis. Plant Physiol. 123, 101–110.
25. Shen,B.,Li,C.&Tarczynski,M.C.(2002)Highfree-methionine
and decreased lignin content result from a mutation in the Ara-
bidopsis S-adenosyl-
L
-methionine synthetase 3 gene. Plant J. 29,
371–380.
26. Noji, M., Inoue, K., Kimura, N., Gouda, A. & Saito, K. (1998)
Isoform-dependent differences in feedback regulation and sub-
cellular localization of serine acetyltransferase involved in cysteine
biosynthesis from Arabidopsis thaliana. J. Biol. Chem. 273, 32739–
32745.
27. Bligny, R., Gardestrom, P., Roby, C. & Douce, R. (1990)
31
P
NMR studies of spinach leaves and their chloroplasts. J. Biol.
Chem. 265, 1319–1326.
28. Ravanel, S., Droux, M. & Douce, R. (1995) Methionine bio-
synthesis in higher plants. I. Purification and characterization of
cystathionine gamma-synthase from spinach chloroplasts. Arch.
Biochem. Biophys. 316, 572–584.
29. Douce, R. & Joyard, J. (1979) Structure and function of the plastid
envelope. Adv. Bot. Res. 7, 1–116.
4626 G. Curien et al. (Eur. J. Biochem. 270) Ó FEBS 2003
30. Giovanelli, J., Mudd, S.H. & Datko, A.H. (1988) In vivo regula-
tion of threonine and isoleucine biosynthesis in Lemna paucicos-
tata Hegelm. 6746. Plant Physiol. 86, 369–377.
31. Giovanelli, J. (1990) Regulatory aspects of cysteine and methio-
nine biosynthesis. In Sulfur Nutrition and Sulfur Assimilation in
Higher Plants. (Rennenberg, H., Brunold, C., DeDok, L.J. &
Stulen, I., eds), pp. 33–48. SLDP Academic Public, The Hague.
32. Datko, A.H. & Mudd, S.H. (1984) Responses of sulfur-containing
compounds in Lemna paucicostata Hegelm. 6746 to changes in
availability of sulfur sources. Plant Physiol. 75, 474–479.
33. Winter, H., Robinson, D.G. & Heldt, H.W. (1994) Subcellular
Volumes and metabolite concentrations in spinach leaves. Planta
193, 530–535.
34. Stitt, M., Lilley, R.M.C. & Heldt, H.W. (1982) Adenine nucleotide
levels in the cytosol, chloroplasts, and mitochondria of wheat leaf
protoplasts. Plant Physiol. 70, 971–977.
35. Kacser, H. & Burns, J.A. (1973) The control of flux. Symp Soc.
Exp. Biol. 27, 65–104.
36. Rapoport, T.A., Heinrich, R., Jacobasch, G. & Rapoport, S.
(1974) A linear steady-state treatment of enzymatic chains. A
mathematical model of glycolysis of human erythrocytes. Eur. J.
Biochem. 42, 107–120.
37. Kell,D.&Westerhoff,H.V.(1986)Metaboliccontroltheory:its
role in microbiology and biotechnology. FEMS Microbiol. Rev.
39, 305–320.
38. Fell, D.A. (1992) Metabolic control analysis: a survey of its
theoretical and experimental development. Biochem. J. 286 (2),
313–330.
39. Cornish-Bowden, A. & Cardenas, M.L. (1990) Control of meta-
bolic processes. NATO ASI Series A: Life Sciences. Plenum Press,
New York.
40. Fell, D.A. (1997) Understanding the Control of Metabolism.
Portland Press, London.
41. Easterby, J.S. (1981) A generalized theory of the transition time
for sequential enzyme reactions. Biochem. J. 199, 155–161.
42. Rognes, S.E., Lea, P.J. & Miflin, B.J. (1980) S-adeno-
sylmethionine-a novel regulator of aspartate kinase. Nature 287,
357–359.
43. Paris, S., Viemon, C., Curien, G. & Dumas, R. (2003) Mechanism
of control of Arabidopsis thaliana aspartate kinase-homoserine
dehydrogenase by threonine. J. Biol. Chem. 278, 5361–5366.
44. Chiba, Y., Ishikawa, M., Kijima, F., Tyson, R.H., Kim, J.,
Yamamoto, A., Nambara, E., Leustek, T., Wallsgrove, R.M. &
Naito, S. (1999) Evidence for autoregulation of cystathionine
gamma-synthase mRNA stability in Arabidopsis. Science 286,
1371–1374.
45. Suzuki, A., Shirata, Y., Ishida, H., Chiba, Y., Onouchi, H. &
Naito, S. (2001) The first exon coding region of cystathionine
gamma-synthase gene is necessary and sufficient for down-
regulation of its own mRNA accumulation in transgenic Arabi-
dopsis thaliana. Plant Cell Physiol. 42, 1174–1180.
46. Hacham, Y., Avraham, T. & Amir, R. (2002) The N-terminal
region of Arabidopsis cystathionine gamma-synthase plays an
important regulatory role in methionine metabolism. Plant Phy-
siol. 128, 454–462.
47. Chiba, Y., Sakurai, R., Yoshino, M., Ominato, K., Ishikawa, M.,
Onouchi, H. & Naito, S. (2003) S-adenosyl-
L
-methionine is an
effector in the posttranscriptional autoregulation of the cysta-
thionine gamma-synthase gene in Arabidopsis. Proc.NatlAcad.
Sci. USA. 100, 10225–10230.
Ó FEBS 2003 An Arabidopsis phosphohomoserine branch-point model (Eur. J. Biochem. 270) 4627