Báo cáo khoa học: "Performance of prognostic models in critically ill cancer patients – a review" pot
Bạn đang xem bản rút gọn của tài liệu. Xem và tải ngay bản đầy đủ của tài liệu tại đây (137.89 KB, 6 trang )
Open Access
Available online />R458
Vol 9 No 4
Research
Performance of prognostic models in critically ill cancer patients –
a review
Sylvia den Boer
1
, Nicolette F de Keizer
2
and Evert de Jonge
1
1
Intensivist, Department of Intensive Care, Academic Medical Center, Universiteit van Amsterdam, Amsterdam, Netherlands
2
Informatician, Department of Medical Informatics, Academic Medical Center, Universiteit van Amsterdam, Amsterdam, Netherlands
Corresponding author: Evert de Jonge,
Received: 27 Apr 2005 Revisions requested: 26 May 2005 Revisions received: 2 Jun 2005 Accepted: 16 Jun 2005 Published: 8 Jul 2005
Critical Care 2005, 9:R458-R463 (DOI 10.1186/cc3765)
This article is online at: />© 2005 den Boer et al.; licensee BioMed Central Ltd.
This is an Open Access article distributed under the terms of the Creative Commons Attribution License ( />2.0), which permits unrestricted use, distribution, and reproduction in any medium, provided the original work is properly cited.
Abstract
Introduction Prognostic models, such as the Acute Physiology
and Chronic Health Evaluation (APACHE) II or III, the Simplified
Acute Physiology Score (SAPS) II, and the Mortality Probability
Models (MPM) II were developed to quantify the severity of
illness and the likelihood of hospital survival for a general
intensive care unit (ICU) population. Little is known about the
performance of these models in specific populations, such as
patients with cancer. Recently, specific prognostic models have
been developed to predict mortality for cancer patients who are
admitted to the ICU. The present analysis reviews the
performance of general prognostic models and specific models
for cancer patients to predict in-hospital mortality after ICU
admission.
Methods Studies were identified by searching the Medline
databases from 1994 to 2004. We included studies evaluating
the performance of mortality prediction models in critically ill
cancer patients.
Results Ten studies were identified that evaluated prognostic
models in cancer patients. Discrimination between survivors and
non-survivors was fair to good, but calibration was insufficient in
most studies. General prognostic models uniformly
underestimate the likelihood of hospital mortality in oncological
patients. Two versions of a specific oncological scoring systems
(Intensive Care Mortality Model (ICMM)) were evaluated in five
studies and showed better discrimination and calibration than
the general prognostic models.
Conclusion General prognostic models generally
underestimate the risk of mortality in critically ill cancer patients.
Both general prognostic models and specific oncology models
may reliably identify subgroups of patients with a very high risk
of mortality.
Introduction
Advances in oncological and supportive care have led to
improved prognosis and extension of survival time in cancer
patients. However, such advances have often been achieved
through aggressive therapies and support, at high expense.
Some of these patients require admission to the intensive care
unit (ICU) for acute concurrent illness, postoperative care, or
complications of their cancer or its therapy. Recent studies [1-
6] suggest that mortality of cancer patients in the ICU is com-
parable with that of patient groups suffering from other severe
diseases, but others reported a poor prognosis with much
higher mortality rates [7]. Efforts have been made to identify
parameters that are associated with poor prognosis and to
develop scoring models for predicting hospital mortality at ICU
admission of cancer patients.
Different prognostic systems, such as the Acute Physiology
and Chronic Health Evaluation (APACHE) II or III [8,9], the
Simplified Acute Physiology Score (SAPS) II [10], and the
Mortality Probability Models (MPM) II [11], have been devel-
oped to predict the outcome of critically ill patients admitted to
the ICU. Although these models perform well in predicting the
mortality of the general ICU patient population, they may well
under- or overestimate mortality in selected patient subpopu-
lations that were not well represented in the original cohort on
which the model was developed. Therefore, new models were
APACHE = Acute Physiology and Chronic Health Evaluation; AUC, area under the curve; ICCM = ICU Cancer Mortality Model; ICU, intensive care
unit; MPM = Mortality Probability Model; ROC = receiver operating curve; SAPS = Simplified Acute Physiology Score; SMR = standardized mortality
rate.
Critical Care Vol 9 No 4 den Boer et al.
R459
designed for specific populations, such as cancer patients
[12,13]. By including variables specific to oncology such as
disease progression/recurrence, performance status and type
of treatment, they were expected to perform better than the
general models. The aim of this review is to evaluate the per-
formance of the general severity-of-illness scores (APACHE II
and III, SAPS II, MPM II) and the specific oncological scoring
systems in cancer patients requiring admission to the ICU.
Methods and materials
Sources and selection criteria
The information in this review is based on results of a Medline
search for recent studies published between 1994 and 2004.
The key words used included "Severity of illness scores",
"Acute Physiology and Chronic Health Evaluation (APACHE)",
"Simplified Acute Physiology Score (SAPS)", "Mortality Prob-
ability Model II", "Cancer", "Oncology", "Critical care", "Prog-
nosis and outcome" and "Hospital mortality". Based on the
title and abstract of the publication, we selected English-lan-
guage articles containing information on the performance of
prognostic models in cancer patients admitted to ICUs. The
references of all selected reports were cross-checked for
other potentially relevant articles. It was envisaged that the
studies would be too heterogeneous to combine for a formal
meta-analysis and therefore a narrative synthesis was
undertaken.
Results
Performance of the prognostic models
Although several measures exist for evaluating the perform-
ance of prognostic models, all identified studies used receiver
operating characteristic (ROC) curves and the area under the
curve (AUC) [14] to evaluate discrimination and the Hosmer-
Lemeshow goodness-of-fit H- or Ĉ-statistics [15] to evaluate
the calibration of the prognostic models.
'Discrimination' refers to a model's ability to distinguish survi-
vors from non-survivors. The AUC represents the probability
that a patient who died had a higher predicted probability of
dying than a patient who survived. An AUC of 0.5 indicates
that the model does not predict better than chance. The dis-
crimination of a prognostic model is considered perfect if AUC
= 1, good if AUC >0.8, moderate if AUC is 0.6 to 0.8, and
poor if AUC <0.6 [16]. The AUC of a model gives no indication
of how close the predicted probabilities are to the observed
outcome. To take this aspect of a model's performance into
account, we have to look at the calibration and accuracy of the
prognostic models.
'Calibration' refers to the agreement between predicted prob-
abilities and the 'true probabilities'. Of course, the true proba-
bility of a patient's outcome is not known, otherwise there
would be no need to develop prognostic models. However,
the true probabilities can be approximated by taking the mean
of the observed outcomes within predefined groups of
patients. The selected studies used Hosmer-Lemeshow H- or
Ĉ-statistics. Both H- and Ĉ-statistics compare the observed
mortality in a group with the predicted mortality of that group.
A disadvantage of the Hosmer-Lemeshow tests is that the
value of the statistic is sensitive to the choice of the cut-off
points that define the groups. The H- and Ĉ-statistics differ in
the way the groups of patients are composed [15]. Grouping
for the H-statistic is based on partitioning of the probability
interval (0–1) into ten equally sized ranges. The Ĉ goodness-
of-fit statistic sorts observations according to their expected
probability and partitions the observations into ten groups of
equal size. A high H or Ĉ relates to a small p value, implying
significant difference between observed and predicted mortal-
ity, and thus indicates a lack of fit of the model. It is a generally
known weakness of the Hosmer-Lemeshow goodness-of-fit
statistics that the sample size has a major influence on the
measured calibration. Using small samples will result in an
apparently good fit, using large samples will result in an appar-
ently poor fit [17,18].
Discrimination and calibration describe the overall predictive
power of a model. This is important when analyzing the mortal-
ity risk of a population, for example, to determine performance
of an ICU by measuring the standardized mortality ratio (SMR:
observed mortality divided by predicted mortality) as mortality
adjusted for severity-of-illness. When caring for an patient, it is
more important that a model can reliably predict the likelihood
of an outcome of an individual patient; this is called 'accuracy'.
Accuracy refers to the difference between predictions and
observed outcomes at the level of individuals. The mean
squared error (MSE), also called Brier score, is an example of
an accuracy measure [19]. None of the selected studies eval-
uated accuracy measures. However, some studies notify that
when caring for an individual patient, it is more important that
a model can reliably identify patients with a very high risk of
dying. Therefore, they evaluated the performance of prognos-
tic models at specific cut-off points, dividing high-risk patients
from low-risk patients.
Discrimination
Nine studies reported on discriminating ability of general prog-
nostic models in ICU patients with cancer (Table 1) [12,16,20-
26]. The APACHE II score was evaluated in six studies and
showed poor to good discriminating value with areas under
the ROC curve between 0.60 and 0.78 [16,20-22,25,26].
Discrimination of the SAPS II model was fair to good with
areas under the ROC curve between 0.67 and 0.83 [20-
23,25,26]. The MPM II model showed poor discrimination in
one study [12], but good discrimination in another [26]. Dis-
crimination of all models differed importantly between studies.
All models showed fair to good discrimination in the study by
Soares [26] and poor discrimination in the study by Sculier
[20]. This may be related to differences in casemix of patients;
whereas most patients in the latter trial had metastatic or dis-
Available online />R460
seminated haematological disease, most patients in the study
by Soares had locoregional cancer or cancer in remission only.
In 1998, Groeger and others developed a model specific for
cancer patients [12]. It included physiological data, disease-
related variables (allogeneic bone marrow transplantation and
recurrent or progressive cancer), and performance status
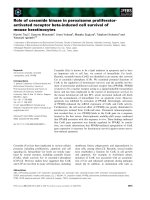
Table 1
Overall predictive performance of prognostic models in ICU patients with cancer
Mortality%
Study N Solid/metastatic/haematological
malignancies
Prognostic score ROC Hosmer-Lemeshow goodness-
of-fit H or test p value
Pred Obs SMR
Sculier [20] 261 APACHE II 0.60 0.001 (H) 26.5 33 1.25
solid 77% SAPS II 0.67 0.001 26.1 1.26
metastatic 62%
haematological 23%
Groeger [12] 805 MPM II 0.63 <0.001 (
Ĉ)22411.86
230 ICMM 0.81 0.310 ng 1.02
solid and haematological
Groeger [13] 415 ICMM at 72 h 0.82 0.354 (Ĉ)ngng1.0
solid and haematological
Schellongowki [21] 242 APACHE II 0.78 0.058 (Ĉ)ng441.05
solid 45% SAPS II 0.83 0.066 ng
haematological 55% ICMM (2) 0.70 0.115 42
Berghmans [22] 247 APACHE II 0.65 0.002 (H) 32 34 1.06
solid 80.5% SAPS II 0.72 <0.0001 24 1.42
metastatic 62% ICMM (2) 0.79 0.060 28 1.21
haematological 19.5%
Guiguet [23] 94 SAPS II 0.78 0.750 (H) ng 60 1
solid 44.7%
haematological 55.3%
Staudinger [24] 414 APACHE III 0.75 ng ng 47
solid 42%
haematological 58%
Benoit [25] 124 SAPS II 0.77 0.60 (Ĉ)ng54
haematological 100% APACHE II 0.71 0.39 ng
Afessa [16] 112 APACHE III 0.70 0.584 (H) 42 46 1.09
haematological 100% APACHE II ng ng 44 1.03
Soares [26] 542 SAPS II 0.82 <0.001 (H) 47.9 58.7 1.23
solid 88.8% APACHE III 0.81 <0.001 42.6 1.38
haematological 11.2% ICMM (2) 0.80 <0.001 78.7 0.75
excluding scheduled MPM II 24 h 0.79 <0.001 37.7 1.56
surgical patients APACHE II 0.75 <0.001 38.2 1.54
MPM II 0 h 0.73 <0.001 25.0 2.35
Shown are areas under ROC, p value belonging to Hosmer-Lemeshow goodness-of-fit H- or Ĉ- statistics and SMRs for individual mortality
prediction models. APACHE, Acute Physiology and Chronic Health Evaluation; ICMM, ICU Cancer Mortality Model; MPM, Mortality Probability
Model; ROC, receiver operating curve; SAPS, Simplified Acute Physiology Score; SMR, standardized mortality rate; ng, not given.
Critical Care Vol 9 No 4 den Boer et al.
R461
before hospitalization. Tested on an independent set of
patients, the model showed good discriminating power with
an area under the ROC curve of 0.81. Good discriminating
ability was confirmed in two other studies [22,26]. In 2003,
Groeger et al. developed another specific model with good
discriminating performance (AUC = 0.82) that predicts in-hos-
pital mortality in cancer patients at 72 h after ICU admission
[13].
Calibration
As shown in Table 1, most studies showed poor calibration for
APACHE II and III, SAPS II and MPM II [12,20,22,26]. The
studies that have good H- or Ĉ-statistics (p>0.05) are very
small. Poor calibration resulted in a uniform underestimation of
the mortality risk using the general prognostic models. Hence,
the observed mortality was uniformly higher than the predicted
mortality (SMR>1). In contrast with the general prognostic
models, the specific models for cancer patients showed good
calibration with SMR of 1.0 to 1.05 [12,13,21] or poor calibra-
tion resulting in a uniform overestimation of mortality risk (SMR
0.75 [26]).
Identification of subgroups at (very) high risk
It may be particularly important to identify patients at very high
risk of dying. Patients with limited life expectancy do not nec-
essarily prefer life-extending treatment over care focused on
relieving pain and discomfort. The willingness to receive life-
sustaining treatment depends on the burden of treatment, the
outcome and the likelihood of the outcome [27]. In patients
aged 65 years and older, the willingness to receive cardiopul-
monary resuscitation if they suffered a cardiac arrest
decreased from 41 to 22% after learning the probability of sur-
vival (10 to 17%) [28].
Although none of the selected studies report on accuracy
measures, some studies report on the performance of prog-
nostic models at specific cut-off points for predicted mortality.
Results are summarized in Table 2. High predicted mortality by
the general prognostic models as well as the specific ICU
Cancer Mortality Model (ICCM) was associated with very high
observed mortality rates. For example, in a study by Staudinger
and others, 7% of the studied population had more than 79
APACHE III points, and all of these patients died before hos-
pital discharge [24]. In another study by Sculier and others,
5.4% of patients had a predicted mortality of >70% according
to the APACHE II model. In these patients, the actual observed
mortality was 86% [20]. Thus, in a limited number of cancer
patients, a very high mortality chance after ICU admission may
be predicted. It may be speculated that some patients would
prefer not to undergo intensive care treatment if their pre-
dicted mortality is very high, for example, more than 80 or
90%. Providing prognostic information to patients, their rela-
tives and physicians could help to provide intensive care that
is more in accordance to patients' own preferences.
Discussion
The general prognostic models for ICU patients generally
underestimate the risk of dying for cancer patients admitted to
ICUs. This is important when interpreting SMRs of different
ICUs, since ICUs with relatively more cancer patients will have
a higher SMR. However, these models are able to identify sub-
groups of patients with a very high mortality risk. Thus, they
may have a role in giving information about the prognosis to
patients and their relatives.
Only a few models exist that were specifically designed for
cancer patients and which include data about type and stage
of cancer, and functional status of patients. These models
showed better discrimination and calibration than the general
models. Thus, they may have a role in comparing SMRs of can-
cer patient populations in the ICU. However, they have been
validated in relatively few patients and new larger studies are
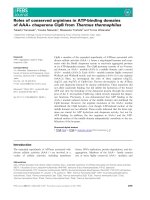
Table 2
Positive predictive value of prognostic models at specific cut-off values for predicted mortality by severity-of illness models
Study Prognostic model and cut-off probability of mortality Observed Mortality, %
Sculier [20] APACHE II >70% 86
SAPS II >60% 67
Berghmans [22] APACHE II >60% 78
SAPS II >60% 86
ICMM >40% 67
Staudinger [24] APACHE III ≥ 79* 100
Kroschinsky [29] SAPS II ≥ 80* 95
Groeger [13] ICCM
72
>70% 83
Groeger [12] ICCM >80% 91
*Severity of illness scoring points, not predicted mortality. APACHE, Acute Physiology and Chronic Health Evaluation; ICCM, ICU Cancer
Mortality Model; ICCM
72
, ICU Cancer Mortality Model at 72 h; SAPS, Simplified Acute Physiology Score.
Available online />R462
required to confirm the value of these models. Most studies
had a retrospective design and limited number of patients, and
the moderate differences among the scoring systems do not
allow conclusion of the superiority of one of them. Because of
large variations in their design (type of patients, observed mor-
tality (33 to 60%), mix of H- and Ĉ-statistics), it is difficult to
perform meaningful comparisons between them. Different
casemixes, national or regional patient populations and critical
care management can lead to different outcomes.
A limitation of all models is the fact that they do not take into
account that better treatments may become available and that
prognosis may improve over time. Indeed, it has been shown
that survival of patients after haematopoietic stem cell trans-
plantation who received mechanical ventilation, improved from
lower than 10% in the period before 1990 to 25 to 50% in the
period 1994 to 2000 [16]. Thus, prognostic information
should be interpreted cautiously. Nevertheless, patients and
physicians need optimal information about the likelihood of a
beneficial outcome of intensive care treatment. Prognostic
models do at least contribute to this information.
Conclusion
The general prognostic models for ICU patients generally
underestimate the risk of dying for cancer patients admitted to
ICUs. Models specific for cancer patients show better calibra-
tion and discrimination than the general models. Both general
models and specific oncology models may reliably identify
subgroups of patients with a very high mortality risk and thus
may be useful to inform patients and their relatives about the
likelihood of a beneficial outcome.
Competing interests
The authors declare that they do not have competing interests.
Authors' contributions
SdB and EdJ acquired and interpreted the data. NFdK inter-
preted the data. All authors contributed in preparing the man-
uscript. All authors read and approved the final manuscript.
References
1. Baumann WR, Jung RC, Koss M, Boylen CT, Navarro L, Sharma
OP: Incidence and mortality of adult respiratory distress syn-
drome: a prospective analysis from a metropolitan hospital.
Crit Care Med 1986, 14:1-4.
2. Sussman NL, Lake JR: Treatment of hepatic failure 1996: cur-
rent concepts and progress toward liver dialysis. Am J Kidney
Dis 1996, 27:605-621.
3. Krafft P, Fridrich P, Pernerstorfer T, Fitzgerald RD, Koc D, Schnei-
der B, Hammerle AF, Steltzer H: The acute respiratory distress
syndrome: definitions, severity and clinical outcome. An anal-
ysis of 101 clinical investigations. Intensive Care Med 1996,
22:519-529.
4. Marik PE, Craft M: An outcomes analysis of in-hospital cardiop-
ulmonary resuscitation: the futility rationale for do not resusci-
tate orders. J Crit Care 1997, 12:142-146.
5. The British Thoracic Society Research Committee and The Public
Health Laboratory Service: The aetiology, management and out-
come of severe community-acquired pneumonia on the inten-
sive care unit. Respir Med 1992, 86:7-13.
6. Massion PB, Dive AM, Doyen C, Bulpa P, Jamart J, Bosly A, Installe
E: Prognosis of hematologic malignancies does not predict
intensive care mortality. Crit Care Med 2002, 30:2260-2270.
7. Sculier JP, Markiewicz E: Medical cancer patients and intensive
care. Anticancer Res 1991, 11:2171-2174.
8. Knaus W, Draper E, Wagner D, Zimmerman J: APACHE II: a
severity of disease classification system. Crit Care Med 1985,
13:818-829.
9. Knaus W, Wagner D, Draper E, Zimmerman J, Bergner M, Bastos
P, Sirio C, Murphy D, Lotring T, Damiano A, Harrel F: The APACHE
III prognostic system. Risk prediction of hospital mortality for
critically ill hospitalised adults. Chest 1991, 100:1619-1636.
10. Le Gall J-R, Lemeshow SS, Saulnier F: A new Simplified Acute
Physiology score (SAPS II) based on a European/North Amer-
ican multicenter study. JAMA 1993, 270:2957-2963.
11. Lemeshow S, Teres D, Klar J, Avrunin JS, Gehlbach SH, Rapoport
J: Mortality Probability Models (MPMII) based on an interna-
tional cohort of intensive care unit patients. JAMA 1993,
270:2478-2486.
12. Groeger JS, Lemeshow S, Price K, Nierman DM, White P Jr, Klar
J, Granovsky S, Horak D, Kish SK: Multicenter outcome study of
cancer patients admitted to the intensive care unit: a probabil-
ity of mortality model. J Clin Oncol 1998, 16:761-770.
13. Groeger JS, Glassman J, Nierman DM, Wallace SK, Price K, Horak
D, Landsberg D: Probability of mortality of critically ill cancer
patients at 72 h of intensive care unit (ICU) management. Sup-
port Care Cancer 2003, 11:686-695.
14. Hanley JA, McNeil BJ: The meaning and use of the area under
a receiver operating characteristic (ROC) curve. Radiology
1982, 143:29-36.
15. Hosmer DW, Lemeshow S: Applied logistic regression New York:
John Wiley & Sons; 2000.
16. Afessa B, Tefferi A, Dunn WF, Litzow MR, Peters SG: Intensive
care unit support and Acute Physiology and Chronic Health
Evaluation III performance in haematopoietic stem cell trans-
plant recipients. Crit Care Med 2003, 31:1715-1721.
17. Zhu BP, Lemeshow S, Hosmer DW, Klar J, Avrunin J, Teres D: Fac-
tors affecting the performance of the models in the Mortality
Probability Model II system and strategies of customization: a
simulation study. Crit Care Med 1996, 24:57-63.
18. Vergouwe Y, Steyerberg EW, Eijkemans R, Habbema D: Sample
size considerations for the performance assessment of pre-
dictive models: A simulation study. Control Clin Trials
2003:S43-S44.
19. Brier G: Verification of forecasts expressed in terms of
probability. Monthly Weather Rev 1950, 78:1-3.
20. Sculier JP, Paesmans M, Markiewicz E, Berghmans T: Scoring
systems in cancer patients admitted for an acute complication
in a medical intensive care unit. Crit Care Med 2000,
28:2786-2792.
21. Schellongowski P, Benesch M, Lang T, Traunmuller T, Zauner C,
Laczika K, Locker GJ, Frass M, Staudinger T: Comparison of
three severity scores for critically ill cancer patients. Intensive
Care Med 2004, 30:430-436.
22. Berghmans T, Paesmans M, Sculier JP: Is a specific oncological
scoring system better at predicting the prognosis of cancer
patients admitted for an acute medical complication in an
intensive care unit than general gravity scores? Support Care
Cancer 2004, 12:234-239.
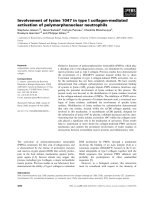
Key messages
• General prognostic models for ICU patients, such as
APACHE II or SAPS II, tend to underestimate the risk of
dying for patients with cancer admitted to ICUs.
• Prognostic models specifically designed for ICU
patients with cancer show better calibration and dis-
crimination than the general models.
• Both general models and specific oncology models reli-
ably identify subgroups of patients with a very high risk
of dying.
Critical Care Vol 9 No 4 den Boer et al.
R463
23. Guiguet M, Blot F, Escudier B, Antoun S, Leclercq B, Nitenberg G:
Severity-of-illness scores for neutropenic cancer patients in
an intensive care unit: Which is the best predictor? Do multiple
assessment times improve the predictive value? Crit Care
Med 1998, 26:488-493.
24. Staudinger T, Stoiser B, Mullner M, Locker GJ, Laczika K, Knapp
S, Burgmann H, Wilfing A, Kofler J, Thalhammer F, Frass M: Out-
come and prognostic factors in critically ill cancer patients
admitted to the intensive care unit. Crit Care Med 2000,
28:1322-1328.
25. Benoit D, Vandewoude K, Decruyenaere J, Hoste E, Colardyn F:
Outcome and early prognostic indicators in patients with a
haematological malignancy admitted to the intensive care unit
for a life-threatening complication. Crit Care Med 2003,
31:104-112.
26. Soares M, Fontes F, Dantas J, Gadelha D, Cariello P, Nardes F,
Amorim C, Toscano L, Rocco J: Performance of six severity-of-
illness scores in cancer patients requiring admission to the
intensive care unit: a prospective observational study. Crit
Care 2004, 8:R194-R203.
27. Fried T, Bradley E, Towle V, Allore H: Understanding the treat-
ment preferences of seriously ill patients. N Engl J Med 2002,
346:1061-1066.
28. Murphy D, Burrows D, Santilli S, Kemp A, Tenner S, Kreling B,
Teno J: The influence of the probability of survival on patients'
preferences regarding cardiopulmonary resuscitation. N Engl
J Med 1994, 330:545-549.
29. Kroschinsky F, Weise M, Illmer T, Haenel M, Bornhaeuser M, Hoef-
fken G, Ehninger G, Schuler U: Outcome and prognostic fea-
tures of intensive care unit treatment in patients with
haematological malignancies. Intensive Care Med 2002,
28:1294-1300.