Báo cáo y học: " Dynamics of viral replication in blood and lymphoid tissues during SIVmac251 infection of macaques" docx
Bạn đang xem bản rút gọn của tài liệu. Xem và tải ngay bản đầy đủ của tài liệu tại đây (1.1 MB, 15 trang )
BioMed Central
Page 1 of 15
(page number not for citation purposes)
Retrovirology
Open Access
Research
Dynamics of viral replication in blood and lymphoid tissues during
SIVmac251 infection of macaques
Abdelkrim Mannioui
1,2
, Olivier Bourry
1,2
, Pierre Sellier
1,2,3
,
Benoit Delache
1,2
, Patricia Brochard
1,2
, Thibault Andrieu
1,2
, Bruno Vaslin
1,2
,
Ingrid Karlsson
1,2
, Pierre Roques
1,2
and Roger Le Grand*
1,2
Address:
1
CEA, Division of Immuno-Virology, DSV/iMETI, Fontenay-aux-Roses, France,
2
Université Paris-Sud 11, UMR E01, Orsay, France and
3
Assistance Publique-Hôpitaux de Paris, Service de Médecine Interne A, Hôpital Lariboisière, France
Email: Abdelkrim Mannioui - ; Olivier Bourry - ; Pierre Sellier - ;
Benoit Delache - ; Patricia Brochard - ; Thibault Andrieu - ;
Bruno Vaslin - ; Ingrid Karlsson - ; Pierre Roques - ; Roger Le Grand* -
* Corresponding author
Abstract
Background: Extensive studies of primary infection are crucial to our understanding of the course
of HIV disease. In SIV-infected macaques, a model closely mimicking HIV pathogenesis, we used a
combination of three markers viral RNA, 2LTR circles and viral DNA to evaluate viral
replication and dissemination simultaneously in blood, secondary lymphoid tissues, and the gut
during primary and chronic infections. Subsequent viral compartmentalization in the main target
cells of the virus in peripheral blood during the chronic phase of infection was evaluated by cell
sorting and viral quantification with the three markers studied.
Results: The evolutions of viral RNA, 2LTR circles and DNA levels were correlated in a given
tissue during primary and early chronic infection. The decrease in plasma viral load principally
reflects a large decrease in viral replication in gut-associated lymphoid tissue (GALT), with viral
RNA and DNA levels remaining stable in the spleen and peripheral lymph nodes. Later, during
chronic infection, a progressive depletion of central memory CD4+ T cells from the peripheral
blood was observed, accompanied by high levels of viral replication in the cells of this subtype. The
virus was also found to replicate at this point in the infection in naive CD4+ T cells. Viral RNA was
frequently detected in monocytes, but no SIV replication appeared to occur in these cells, as no
viral DNA or 2LTR circles were detected.
Conclusion: We demonstrated the persistence of viral replication and dissemination, mostly in
secondary lymphoid tissues, during primary and early chronic infection. During chronic infection,
the central memory CD4+ T cells were the major site of viral replication in peripheral blood, but
viral replication also occurred in naive CD4+ T cells. The role of monocytes seemed to be limited
to carrying the virus as a cargo because there was an observed lack of replication in these cells.
These data may have important implications for the targeting of HIV treatment to these diverse
compartments.
Published: 23 November 2009
Retrovirology 2009, 6:106 doi:10.1186/1742-4690-6-106
Received: 10 August 2009
Accepted: 23 November 2009
This article is available from: />© 2009 Mannioui et al; licensee BioMed Central Ltd.
This is an Open Access article distributed under the terms of the Creative Commons Attribution License ( />),
which permits unrestricted use, distribution, and reproduction in any medium, provided the original work is properly cited.
Retrovirology 2009, 6:106 />Page 2 of 15
(page number not for citation purposes)
Background
Viral RNA quantification in plasma provides important
insight into the natural course of HIV infection and is
widely used in both acute and chronic infection as a sur-
rogate marker for the evaluation of disease progression
[1,2]. Other markers such as viral DNA in peripheral
blood mononuclear cells (PBMC) have been used to pre-
dict disease progression from primary infection [3,4]. The
simultaneous determination of viral RNA in plasma and
viral DNA in PBMCs has been shown to be more robustly
related to clinical outcome [3,5]. These studies highlight
the importance of evaluating events occurring during pri-
mary infection to improve our understanding of HIV
pathogenesis.
It is difficult to study primary infection in humans, partic-
ularly those that concern the dynamics of viral infection in
deep tissues. Non-human primate models of HIV infec-
tion are therefore of particular importance. Only a few
studies have focused on these aspects. Mattapallil et al.
demonstrated, by quantifying SIV-gag DNA, that the high
levels of free virus in plasma at the peak of primary SIV
infection are associated with maximal viral spread and
high rates of viral replication in all lymphoid tissues [6].
Other studies have reported viral replication in gut-associ-
ated lymphoid tissue (GALT). Li et al. showed that the lev-
els of SIV mRNA in the GALT of SIV-infected macaques
decreased by a factor of 20 between peak plasma viral load
(PVL) and day 28 post infection (pi) [7]. The high levels
of viral replication in GALT at peak infection resulted in a
profound depletion of CD4+ T lymphocytes, which could
potentially lead to the immunodeficiency observed in the
long term. However, these studies addressed only the
short-term dynamics of viral replication in tissues with a
maximum follow-up of 28 days pi. The studies used only
RNA or total DNA viral markers. Viral RNA has classically
been used to evaluate viral replication or production,
whereas viral DNA is generally used to evaluate dissemi-
nation.
The 2LTR circular viral DNA is another viral marker. It is
an extrachromosomal product formed after the entry of
the virus into the target cell and following its reverse tran-
scription. This structure results from the circularization of
two long terminal repeats of linear viral DNA by cellular
DNA repair factors [8,9] in the absence of integration.
Despite the fact that contradictory studies have been
reported [10-13], the 2LTR circles are labile in vivo and
may therefore be used as an indicator of recently infected
cells [14].
We used cynomolgus macaques infected with SIVmac251
to study in detail the dynamics of viral replication in
peripheral blood and tissues during primary and early
chronic infection as well as its impact in the long term. We
studied both free virus levels in plasma and viral replica-
tion in lymphoid tissues from peak PVL to the set point,
both of which were two key dates for predicting the rate of
disease progression in the long term. We used a combina-
tion of three viral markers simultaneously to study in
detail viral dissemination and the dynamics of viral repli-
cation in tissues: viral DNA (indicating dissemination),
viral RNA (an indicator of viral replication and produc-
tion), and 2LTR circles (to identify recently infected cells)
[12,14-17].
Results
Determinations of viral RNA in plasma and of viral DNA
and 2LTR circles in PBMCs at the set point may predict the
long-term progression of SIV infection
We and others have previously evaluated the relevance of
viral RNA determinations in plasma for predicting disease
progression [18]. We monitored plasma viral RNA
(vRNA), total viral DNA (vDNA), and 2-LTR circle levels
in parallel in PBMCs from cynomolgus macaques inocu-
lated intravenously with SIVmac251 (Figure 1) for a more
precise characterization of viral dynamics during the first
few weeks of primary infection. We have demonstrated
that this virus is pathogenic in this species, and different
profiles of viral and immunological parameters could be
identified depending on the dose and route of inoculum
[18-21].
We intravenously injected two groups of six macaques
each with a high dose (5,000 AID50) or a low dose (50
AID50) of pathogenic SIVmac251 in order to generate dif-
ferent disease progression profiles. These infections gener-
ated two different profiles in terms of vRNA levels at set
point (day 100 pi): a group of rapidly progressing animals
with high plasma viral load (>10
5
vRNA copies/ml) and a
group of moderately progressing animals with a signifi-
cantly lower (p = 0.012) plasma viral load (<10
5
vRNA
copies/ml). This pattern was confirmed in the long term,
on day 226 pi, with plasma viral load continuing to
exceed 10
5
vRNA copies/ml and a significant decrease in
CD4 counts (p = 0.054; CD4+ = 324 ± 373) in the highly
viraemic group. The animals in the group with less than
10
5
vRNA copies/ml displayed slower disease progression
as demonstrated by the maintenance of high levels of
CD4 counts (CD4+ = 719 ± 281) (Figure 1). These data
are consistent with published data from our group and
other groups working on the same SIV-macaque model
[18,22,23].
MHC typing from individual animals of groups 5000 and
50 AID50 were performed and showed a relative homoge-
neity of haplotype class II. One animal of the progressor
group and two animals from 50 AID were haplotype H6
(data not shown) which is known to be associated with
low disease progression [24].
Retrovirology 2009, 6:106 />Page 3 of 15
(page number not for citation purposes)
We investigated viral dissemination in the groups display-
ing rapid and moderate progression by following the
dynamics of viral DNA and 2LTR circles in PBMCs. At the
set point, as for vRNA in plasma, viral DNA and 2LTR cir-
cle levels in PBMC were significantly higher in the rapid
progression group (0.019 and 0.017 respectively) than in
the moderate progression group. Moreover, all the viral
parameters determined in peripheral blood (vRNA in
plasma, vDNA and 2LTR circles in PBMCs) increased sig-
nificantly earlier (day 7 pi) in the rapid progression group
than that in the moderate progression group (p = 0.016, p
= 0.033, p = 0.038, respectively) (Figure 1B-D). Thus, our
results confirm that the early spread and persistence of
high levels of viral replication in peripheral blood during
primary infection may predict rapid disease progression.
There was a significant, strong correlation between plasma
viral RNA levels and the levels of viral DNA or 2LTR circles
in PBMCs during infection (day 0 to 100 pi.), as deter-
mined by measuring the area under the curve (Spearman's
rank correlation test, p ≤ 0.0002 and p ≤ 0.0001, respec-
tively) (Figure 1E-F). Thus, during this period, viral DNA
and 2LTR circle levels in PBMC changed in the same man-
ner as plasma viral RNA levels.
Plasma viral load is correlated with viral replication in gut-
associated lymphoid tissue during SIVmac251 primary
infection in macaques
We extended this analysis to tissues to improve our under-
standing of the relationship between the kinetics of viral
replication in blood and viral dissemination in tissues at
peak of viremia and at the set point. We focused our anal-
ysis on the tissues thought to be the main sites of viral rep-
lication, such as digestive tract (ileum and rectum) and
secondary lymphoid (spleen, peripheral and mesenteric
LN) tissues.
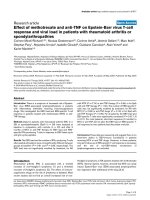
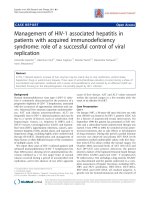
The dynamics of CD4+ T cells, viral replication and dissemination of the virus in the peripheral blood of SIV-infected macaquesFigure 1
The dynamics of CD4+ T cells, viral replication and dissemination of the virus in the peripheral blood of SIV-
infected macaques. We divided macaques into the low and high replication groups (black and red full lines, respectively),
regardless of the viral doses used for inoculation, and according to the level of plasma viral load at set point (day 100 pi. 10
5
/ml
copies RNA). The symbols of macaques infected with low dose (50 AID50) and high dose (5,000 AID50) were represented by
black and red colors respectively. (A) Changes in absolute CD4+ T-cell counts in peripheral blood. (B-C-D) Changes in viral
RNA levels in plasma and viral DNA and 2LTR circle levels in the PBMCs. (E-F) Correlations between 2LTR circle levels and
viral DNA or plasma viral RNA levels.
10
2
>
10
3
10
4
10
5
10
6
10
7
10
1
>
10
2
10
3
10
4
10
5
10
6
10
7
0 14284256708498
viral DNA copies / 10
6
cells2-LTR copies / 10
6
cells
Total viral DNA in PBMCs
2-LTR levels in PBMCs
P=0.017
P=0.019
P=0.033
P=0.038
C.
D.
0
500
1 000
1 500
2 000
0 14284256708498
CD4+ T cells/μlviral RNA copies / ml
CD4+ circulating T lymphocytes
Plasma viral load
10
2
>
10
3
10
4
10
5
10
6
10
7
P=0.012
P=0.016
A.
Days post infection
B.
226
P=0.012
P=0.054
2LTR copies/10
6
PBMCs
AUC d0-100
6,5
7
7,5
8
8,5
9
99.510
10.5
11
plasma viral RNA
AUC d0-100
(RNA copies/ml)
P=0.0002
8
8,5
9
9,5
10
9 9.5 10 10.5 11
total viral DNA
AUC d0-100
DNA copies/10
6
PBMCs
P=<0.0001
2LTR copies/10
6
PBMCs
AUC d0-100
E.
F.
15729
15816
16834
20555
20784
20973
MED>10
5
MED<10
5
5000 AID50 50 AID50
15596
20483
20654
20525
20595
15693
Retrovirology 2009, 6:106 />Page 4 of 15
(page number not for citation purposes)
Another group of fourteen macaques were infected with
50 AID
50
of the same SIVmac251 viral stock. As expected,
they showed a pattern of moderate progression involving
a slow decrease in CD4 counts and PVL similar to that
observed in the majority of humans infected with HIV-1.
The animals were then euthanized, on day 14 (4 animals),
21 (4 animals), 28 (3 animals) or 100 (3 animals) pi (Fig-
ure 2A). For each animal, we simultaneously analysed
viral RNA levels in plasma and tissue and total viral DNA
and 2-LTR circle levels in both PBMC and tissues.
The immunological and virological patterns in peripheral
blood of these animals (Figure 2B-E) were similar (similar
curves for CD4+T-cell counts, plasma viral RNA, total
DNA and 2LTR circle levels) to that we previously
reported for macaques receiving the same dose of virus.
An analysis of viral RNA levels in plasma and tissues on
day 14 pi showed that peak plasma viral load was associ-
ated with a very high level of viral replication in all the tis-
sues explored (Figure 3). Parallel evaluations of both viral
DNA and 2LTR circles in PBMCs and tissues showed that
the cell-associated viral load peak in PBMCs was also
accompanied by high levels of viral dissemination in all
tissues (Figure 3). At this time point, no major difference
in the level of viral replication or dissemination was
observed between the different tissues (Figure 3). Thus, at
peak viraemia, viral replication and dissemination levels
were maximal in all lymphoid tissues. On day 21 post
infection, when plasma viral load began to decrease, we
observed a significant decrease in SIV RNA level in the
GALT, whereas SIV RNA levels remained stable in the
spleen and peripheral lymph nodes. The decrease in SIV
RNA levels in the GALT was associated with decreases in
the levels of both SIV DNA and 2LTR circles in this tissue
(Figure 3). We assumed, as previously reported for this
model, that the simultaneous decrease in all three markers
would result from the loss of infected cells in this com-
partment [25].
Plasma viral load was slightly lower on day 28 than on
day 21 pi, but viral RNA levels in all lymphoid tissues
remained roughly constant. Viral DNA and 2LTR circle
levels in PBMCs displayed a similar pattern (Figure 3).
By the set point, on day 100 pi, plasma RNA load was sig-
nificantly lower than on day 28 pi, and we observed small
numbers of infected cells and low levels of viral replica-
tion in the GALT, as demonstrated by the parallel
decreases observed in SIV RNA/DNA and 2LTR circle lev-
els in this compartment (Figure 3).
The analysis of viral RNA in the tissues by PCR was
enhanced by in situ hybridisation assays. We confirmed
that at day 14 dense collections of SIV RNA-positive cells
developed in the GALT and the spleen. The SIV RNA-pos-
itive cells decreased from day 21 to 28 in the GALT,
whereas they were still detectable in the spleen (Figure 4).
A qualitative assessment revealed at day 14 pi, that SIV
RNA-positive cells were detected in the GALT with no
preferential localization (such cells were detected in the
germinal centers as well as in the lamina propria), there-
after the SIV RNA-positive cells became localized mainly
in the lamina propria., SIV RNA-positive cells in the
spleen were essentially localized around germinal centers
and in the white pulp regardless of the date of infection
(Figure 4).
Because we observed parallel decreases in the number of
infected cells/level of viral replication in the GALT and
plasma viral load during primary infection with SIV, we
hypothesized that the GALT was the principal source of
the virus in the plasma. We tested this hypothesis by
assessing the correlation between viral production in each
tissue and plasma viral load during primary infection with
SIV. As expected, we found a very strong correlation
between SIV RNA level in the ileum or rectum and plasma
viral load (p = 0.0097 and p = 0.001, respectively) but no
correlation with viral load in other lymphoid tissues
(spleen: p = 0.17, peripheral LN: p = 0.097, mesenteric
LN: p = 0.81) could be established (Figure 5).
Levels of viral replication in peripheral blood during
chronic infection differ considerably between central
memory CD4+ T cells, naive CD4+ T cells and monocytes
We assessed the effect of viral load during primary infec-
tion on subsequent virus progression during the chronic
phase of infection. We chose six macaques from the mod-
erate progression group (with viral loads <10
5
copies
RNA/ml at set point). After two years of infection, we
investigated changes in viral and immunological parame-
ters in the peripheral blood. At that time, the macaques
had slightly higher plasma viral loads (mean = 3.7 ± 0.6,
100 days pi vs. 4.5 ± 0.4, 2 years pi.) and a markedly
higher cell-associated viral load (viral DNA mean = 2.6 ±
0.5, 100 days pi vs. 3.7 ± 0.3, 2 years pi; 2LTR circles mean
= 1.0 ± 0.1, 100 days pi vs. 2.2 ± 1.1, 2 years pi) when
compared to viral load at the set point. The proportion of
circulating CD4+ T cells and particularly of CD4+ central
memory lymphocytes was also lower (38 ± 6%, 100 days
pi vs. 15 ± 5%, 2 years pi.).
We therefore tried to identify the infected peripheral cells
in which active replication of the virus occurred. We
sorted naive lymphocytes (CD4+CD28
high
CD95
low
), cen-
tral memory lymphocytes (CD4+CD28
high
CD95
high
),
effector memory (CD4+CD28
low
CD95
high
) lymphocytes
and CD14+ monocytes (Figure 6), with a mean purity
higher than 96% (Table 1). In each cell subset we quanti-
fied viral RNA, total viral DNA, and 2LTR circles.
Retrovirology 2009, 6:106 />Page 5 of 15
(page number not for citation purposes)
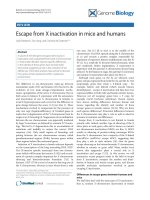
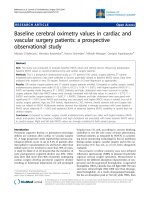
Changes in CD4+ T cell numbers as a function of viral replication and dissemination in the peripheral blood, in four groups of SIV-infected macaques during primary infectionFigure 2
Changes in CD4+ T cell numbers as a function of viral replication and dissemination in the peripheral blood, in
four groups of SIV-infected macaques during primary infection. (A) Protocol for SIV infection, evaluations, and the
euthanasia of each animal. Each box indicates the group of macaques explored at the corresponding times. (B) Changes in abso-
lute counts of total CD4+ T cells in peripheral blood. (C-D-E) Changes in viral RNA levels in plasma and viral DNA and 2LTR
circle levels in PBMCs. Bold lines indicate the mean value (B-D-C-E).
A.
0 14284256708498112
0
500
1000
1500
2000
2500
CD4+ T cells pe rμl
CD4+ circulating T lymphocytes
B.
10
2
>
10
3
10
4
10
5
10
6
10
7
10
8
viral RNA copies pe
ml
Plasma viral load
C.
10
2
>
10
3
10
4
10
5
10
6
10
7
10
8
viral DNA copies per 10
6
cells
Total viral DNA in PBMCs
D.
0 14 28 42 56 70 84 98 112
10
2
10
3
10
4
10
5
10
6
10
7
10
8
10
1
>
2-LTR copies per 10
6
cells
2-LTR levels in PBMCs
E.
Days post infection
Days of
eutanasie
Groups of
infected
macaques
SIVmac251
(50 AID50 IV)
14 21 28 106
13771
13927
13691
13382
14275
13070
13071
10092
9368
10043
9680
8102
8141
9345
Retrovirology 2009, 6:106 />Page 6 of 15
(page number not for citation purposes)
Both central memory CD4+ T cells and naive cells were
involved in viral dissemination, but the total viral DNA
content of the central memory T cells (mean: 5.4 ± 0.3
viral DNA copies/10
6
cells) was 1 log higher than that of
the naive cells. Effector memory cells contained little viral
DNA, and monocytes had almost no viral DNA (Figure 7).
Central memory CD4+ T cells and naive cells were both
involved in the viral infection/replication process despite
the significantly lower SIV RNA levels in naive than in cen-
tral memory cells. Viral DNA and RNA were nonetheless
observed in the naive cell subsets of almost all the animals
(5/6). Low levels of viral infection and replication were
observed in cells of the effector memory subset in only
two of the six animals. Unexpectedly, we detected SIV
RNA in monocytes from three animals, despite the
absence of SIV-DNA and 2LTR circle detection in this cell
subset. Thus, central memory and naive CD4+ T cells may
play a key role in both viral dissemination and viral repli-
cation (Figure 7).
Discussion
In this study, we used a combination of three SIV markers
to investigate viral dissemination and replication in
peripheral blood and tissues: viral RNA, viral DNA, and 2-
LTR circles. We found a linear correlation between plasma
viral RNA levels and total viral DNA or 2-LTR circle levels
in circulating PBMCs. Similar observations were reported
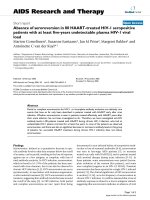
Viral replication and dissemination in the tissues of macaques during primary infection with SIVmac251Figure 3
Viral replication and dissemination in the tissues of macaques during primary infection with SIVmac251. The
three viral markers viral RNA, DNA and 2 LTR circles were evaluated in various tissues from macaques infected with
SIVmac251, on days 14, 21, 28 and 100 pi. The relative level of viral RNA with respect to the mRNA for GAPDH was calcu-
lated by the "delta delta Ct" method. Absolute copy numbers for viral DNA and 2LTR circles were calculated to the GAPDH
and normalized to one million of cells. When significant, p values were indicated. The results from blood were added to tissues
as comparative value.
Spleen Per LN Mes LN Ileum
Ratio of viral RNA coipes
/RNA GAPDH copies
Viral DNA Copies /10
6
cells
within tissue
2LTR Copies /10
6
cells
within tissue
10
-5
10
-4
10
-3
10
-2
10
-1
10
0
10
1
10
2
10
2
>
10
3
10
4
10
5
10
6
10
1
>
10
2
10
3
10
4
10
5
Rectum
14 21 28 100 14 21 28 100 14 21 28 100 14 21 28
100
nd
nd
nd
P=0.043
P=0.020
P=0.021
P=0.020
P=0.021
P=0.043
Days post infection
P=0.034
P=0.034
P=0.034
P=0.034
P=0.034
P=0.049
14 21 28 100
P=0.049
PBMCs
2LTR Copies /10
6
cells Viral DNA Copies /10
6
cells
Tissues
Blood
Plasma
10
2
>
10
3
10
4
10
5
10
6
10
1
>
10
2
10
3
10
4
10
5
10
2>
10
3
10
4
10
5
10
6
10
7
10
8
viral RNA copies / ml
14 21 28 100
14 21 28 100
Retrovirology 2009, 6:106 />Page 7 of 15
(page number not for citation purposes)
for viral RNA and DNA loads during primary viremia in
SIV infected cynomolgus macaques[26].
We also report here the first simultaneous determination
of these three markers in the main lymphoid tissues
including the GALT. For each tissue, we observed a signif-
icant correlation between the three viral markers (p =
0.0001). We also found no relevant differences in the
ratio of 2LTR circle to total viral DNA levels in the differ-
ent types of sample at any of the times studied, confirming
the lack of accumulation of 2LTR circles. Thus, in each tis-
sue, the three viral markers varied in the same manner,
reflecting the level of viral replication.
We monitored viral load in the peripheral blood of
SIVmac251-infected macaques for 226 days after infec-
tion. Our findings confirm that plasma vRNA load at set
point is predictive of disease progression, as previously
reported [23,27]. Our results also suggest that the combi-
nation of a rapid increase in viral load and the persistence
of a high viral load until the set point in both plasma and
PBMCs may distinguish macaques with rapid disease pro-
gression from those with intermediate progression. Thus,
rapid viral spread may be critical for the establishment of
persistent viral replication and may be associated with
rapid disease progression [2,4,28,29].
The plasma viral load, and subsequent circulating CD4
depletion, principally reflected viral replication in the
GALT during primary infection [30-32]. This relationship
between peripheral blood viral load and replication in the
GALT is not particularly surprising. Indeed, only 2% of cir-
culating T lymphocytes are found in the peripheral blood
[33], whereas the GALT contains most of the T lym-
phocytes in the body 40 to 60% [34,35]. In both humans
[36-38] and macaques [6,39], most (> 95%) CD4+ T lym-
phocytes in the GALT are CD45RA- or activated memory
T lymphocytes, and about 30 to 75% of these cells express
CCR5 [40,41]. The GALT may therefore constitute a major
site of viral replication, providing the peripheral blood
with free virus. During primary infection, we observed a
parallel decrease in vRNA levels in the GALT and plasma,
probably due to the progressive depletion of activated
memory CD4+ T cells during primary infection in this tis-
sue [25]. Other compartments, including the PBMCs and
lymph nodes, despite stable viral replication in the latter,
may also supply the plasma with free virus, but probably
to a lesser extent, due to their reduced size as compared to
lymphoid compartment in mucosal tissues [34,35].
Activated memory CD4+ T cells are depleted from all lym-
phoid tissues early in infection [6]. However, the compo-
sition of CD4+ T lymphocytes subsets from lymph nodes
is different from that in the GALT [6,42,43]. Lymph nodes
contain larger numbers of resting memory CD4+ T lym-
phocytes which can be productively infected [7] but are
probably more resistant to death, explaining the persist-
ence of viral replication in the spleen and lymph nodes
that we observed in our study [25,30].
As expected, we observed a slight increase in viral load in
the peripheral blood and the depletion of central memory
CD4+ T cells after two years of SIV infection. An extensive
analysis of viral replication in peripheral cell subsets
showed this subpopulation to be highly permissive to the
virus and to be the principal location of viral RNA and
DNA in the peripheral blood, consistent with previous
findings [6,30]. These results also suggest that central
memory CD4+ T cell depletion may be a consequence of
the high levels of viral replication and activation in this
cell subset. Viral replication was also detected in naive
CD4+ T cells. Despite having viral loads ~100 fold lower
than that of central memory CD4+ T lymphocytes, naive
CD4+ T cells may be actively involved in viral replication,
particularly as they account for 65 to 85% of all CD4+ T
lymphocytes in peripheral blood. These results raise ques-
tions about the precise role of naive CD4+ T cells in viral
replication in vivo. In vitro studies have generally assumed
that naive CD4+ T cells are resistant to SIV/HIV infection,
Viral transcription in the two examples of tissue, GALT and spleen, at 14, 21 and 28 days piFigure 4
Viral transcription in the two examples of tissue,
GALT and spleen, at 14, 21 and 28 days pi. In situ
hybridization was performed with radiolabeled SIV-specific
RNA and SIV RNA-positive cells appear black. Montage of
large image (magnification ×10) of single section, among 4 or
2 sections examined from GALT and spleen, respectively.
The encircled regions in the spleen were the most numerous
for productive cells. The headed arrow points to a few SIV
RNA positive cells founded at day 21 and 28 in the GALT.
GALT
spleen
14 21
28
Days post infection
Retrovirology 2009, 6:106 />Page 8 of 15
(page number not for citation purposes)
because they are in the G0 phase of the cell cycle and are
not activated [44-46]. However, in many in vivo reports,
naive cells have been shown to support infection
[36,40,47]. The apparent conflict between in vitro resist-
ance and in vivo susceptibility of naïve CD4+ T cells to
viral replication could be explained by the role of the
microenvironment as previously reported [48].
Alternatively, infected CD4+ T cells may be generated
from infected thymocytes as suggested by our data (Addi-
tional File 1) and other reports [26]. In addition recent ex
vivo data for humans have suggested that the R5 strain
preferentially infects and replicates in mature CD3+/hi
CD27+ thymocytes [49]. The thymus is essential for the
initial seeding of T cells to the periphery and continues to
produce naive T cells in middle-aged humans [50]. This
would result in naive circulating CD4+ T cells replicating
the virus and contributing to the dissemination of the
virus when these cells migrate from the blood to other
anatomic sites.
Some exceptions to the relationships between the studied
viral parameters within the various cellular compartments
were observed in the monocytes which contained low fre-
quency viral RNA but had undetectable levels of vDNA
and 2LTR circles (Figure 7C). Kaiser et al. have reported in
untreated HIV patients the absence of vDNA and low fre-
quencies of viral RNA in this cell subtype (100- to 1,000-
fold lower than those of HIV-infected CD4+ T cells) [51].
Thus, monocytes appeared unlikely to play a major role
for virus production in peripheral blood. However, it
would be important in follow-up studies to look at tissue
macrophages. On the other hand, the absence of viral
RNA and 2LTR circles from the naïve CD4 T cells of ani-
mal 20595 despite the presence of viral DNA (Figure 7C)
could be related to viral latency, although it was not
Correlation between plasma viral load and SIV RNA level in the GALT and the secondary lymphoid tissue from 0 to 100 days piFigure 5
Correlation between plasma viral load and SIV RNA level in the GALT and the secondary lymphoid tissue
from 0 to 100 days pi.
Spleen Per LN
Mes LN
Ileum Rectum
plasma viral RNA d0-100
(RNA copies/ml)
Tissue viral RNA
(d0-100)
P=0.009
-5
-4
-3
-2
-1
1
45678
P=0.001
-5
-4
-3
-2
-1
1
45678
-5
-4
-3
-2
-1
1
45678
P=0.09
-5
-4
-3
-2
-1
1
45678
P=0.17
-5
-4
-3
-2
-1
1
45678
P=0.81
Retrovirology 2009, 6:106 />Page 9 of 15
(page number not for citation purposes)
Flow cytometric sorting strategy for monocytes and T cellsFigure 6
Flow cytometric sorting strategy for monocytes and T cells. A representative exemple is shown. PBMCs from each
animal were stained with the antibody combination described in the material and methods. Monocytes and lymphocytes were
defined with forward and side scatter (I). CD3+ T cells were then defined based on expression of CD3 (II). CD4+ T cells were
then defined based on expression of CD4 without expression of CD8 (III). Naïve CD4+ T cells were then separated based on
expression of CD28 without expression of CD95 (IV). Central memory CD4+T cells were then separated based on dual
expression of CD28 and CD95 (IV). Effector memory CD4+ T cells were then separated based on expression of CD95 with-
out expression of CD28 (IV). The CD14+ monocytes were separated based on expression of CD14+ (II').
0 50K 100K 150K 200K 250K
0
50K
100K
150K
200K
250K
81%
8.47%
010
2
10
3
10
4
10
5
0
50K
100K
150K
200K
250K
69.9%
010
2
10
3
10
4
10
5
0
10
2
10
3
10
4
10
5
16.3%
010
2
10
3
10
4
10
5
0
10
2
10
3
10
4
10
5
12%
1.6%
85.8%
PBMCs
SSC
SSC
010
2
10
3
10
4
10
5
0
50K
100K
150K
200K
250K
65%
monocytes
CD14
FSC
CD3 CD4 CD95
CD28
CD8
T lymphocytes T CD4+
lymphocytes
SSC
naive
central
memory
effector
memory
I
II’
II III IV
Table 1: Purity of sorted T cells and monocytes
T CD4+ lymphocytes
sample Naive
CD28
high
CD95
low
central memory
CD28
high
CD95
high
effector memory
CD28
lox
CD95
high
CD14+ monocytes
15596 99 97 96 97
15693 98 98 97 98
20483 97 96 95 98
20525 99 97 96 99
20595 98 98 95 98
20654 96 99 97 98
Mean ± SEM 98.0 ± 1.2 98.0 ± 1.0 96.0 ± 0.9 98.0 ± 0.6
Retrovirology 2009, 6:106 />Page 10 of 15
(page number not for citation purposes)
clearly demonstrated in this cell subtype. Finally, effector
cells were those reported with the strongest disparity (Fig-
ure 7C). These cells could contain only viral RNA (animal
20525), both viral RNA and DNA without 2LTR circles
(animal 20483), slight detection of the three markers
(20595), or lack of the viral markers (animals #20654
#15596 #15693). However, apparent discrepancies could
be attributed to cells coated with virus without infection,
cells infected with a very slowly replicating virus, or cells
resistant to infection. CCR5 positive effector cells in blood
and other tissues may however differ in differentiation
stage and/or activation status, resulting in different capac-
ity for viral replication.
Dynamics of viral replication in the acute phase could be
different after intrarectal- or intravaginal transmission as
compared to intravenous inoculation. Our preview stud-
ies after iv, intrarectal or intravaginal inoculation showed
among other hypothesis, a delay of plasma viral load in
early infection from the three routes of infection [19-
21,52]. This delay could be explained by differences in
virus compartmentalization in tissues as showed by other
Changes in immunological parameters and compartmentalisation of the virus in various cell subtypes in the peripheral blood during the chronic phase of infectionFigure 7
Changes in immunological parameters and compartmentalisation of the virus in various cell subtypes in the
peripheral blood during the chronic phase of infection. (A) Changes in the total number of CD4+ T cells and of their
various subtypes, such as naive, central memory and effector memory cells, in the peripheral blood between set point on day
100 pi and 2 years pi. (B) Changes in plasma viral RNA, viral DNA, and 2LTR circle levels in PBMCs between set point on day
100 pi and 2 years pi. (C) Distribution of viral RNA, viral DNA and 2LTR circles in naive, central memory and effector memory
lymphocyte subsets and in CD14+ monocytes from PBMCs, during chronic infection. The cell sorting was performed twice
from each animal and each RT-PCR or PCR was quantified in duplicate.
Viral RNA Copies /10
6
cells
viral RNA in cells
C.
10
1
>
10
2
10
3
10
4
10
5
10
6
10
7
P=0.039
P=0.036
P=0.036
Viral DNA copies/10
6
cells
viral DNA in cells
10
2
>
10
3
10
4
10
5
10
6
10
7
P=0.059
P=0.032
P=0.020
Naive
Central
memory
Effector
memory
CD14+
Monocytes
2LTR Copies /106 cells
2LTR circles in cells
10
1
>
10
2
10
3
10
4
10
5
10
6
10
7
P=0.030
P=0.013
P=0.007
MED
40
60
80
100
0
20
40
60
0
5
10
15
20
100 726
Total CD4+T cells
Naive
Effector memory
Central memory
10
2
>
10
3
10
4
10
5
10
6
10>
10
2
10
3
10
4
100 726
Plasma viral load
RNA copies/ml
Total DNA
copies/10
6
PBMCs
Plasma viral load
2-LTR levels in PBMCs
2-LTR copies per 10
6
cells
P=0.037
P=0.0039
P=0.0065
P=0.037
P=0.049
10
2
>
10
3
10
4
10
5
viral DNA in PBMCs
P=0.010
0
20
40
60
80
100
Days post infection
A. B.
% in CD4+ T cells
% in
lymphocytes
15596
20483
20654
20525
20595
15693
Retrovirology 2009, 6:106 />Page 11 of 15
(page number not for citation purposes)
studies [53,54]. As a consequence, our observations dur-
ing acute phase of infection may not be representative of
the situations of individuals infected after mucosal expo-
sure. However, after establishment of systemic infection
we may consider that the compartmentalization of virus
in cell subsets is probably weakly influenced by initial
route of transmission.
Conclusion
In conclusion, the levels of viral DNA and 2LTR circles in
PBMCs measured very early in primary infection and/or at
the set point followed the same natural course as plasma
viral RNA levels and were predictive of the long-term pro-
gression of SIV infection. During primary infection, viral
replication in gut-associated lymphoid tissue was corre-
lated with plasma viral load, whereas no such correlation
was observed for viral replication in secondary lymph
nodes and the spleen. During chronic infection, viral rep-
lication in peripheral blood occurs mostly in the central
memory CD4+ T cells with lower levels of replication
observed in naïve CD4+ T cells and no replication in
monocytes.
Methods
Animals and viral inoculation
Twenty-six adult cynomolgus macaques (Macaca fascicula-
ris) were imported from Mauritius, and each weighing 4 to
6 kg were used in this study. They were housed in single
cages within level 3 biosafety facilities. All animals used in
this study tested negative for SIV, simian T-lymphotropic
virus, herpes B virus, filovirus, simian retrovirus 1, simian
retrovirus 2 and measles at the start of the study. All exper-
imental procedures were conducted according to Euro-
pean guidelines for animal care ("Journal Officiel des
Communautés Européennes," L358, 18 December 1986).
Animals were sedated with ketamine chlorhydrate
(Rhone-Mérieux, Lyons, France) before handling. Six
macaques were inoculated intravenously (IV) with 50
times the 50% animal infectious dose of virus (50 AID
50
)
of pathogenic SIVmac251 and six other animals received
IV 5,000 AID
50
of the same virus stock. These twelve
macaques have been divided into two groups of six ani-
mals accordingly to their plasma viral load at set point
(day 100 pi). For the exploration of viral dissemination in
organs during primary infection, we inoculated the other
group of 14 macaques intravenously with 50 AID
50
of the
same virus stock. These macaques were then euthanized
on day 14 pi (n = 4), day 21 (n = 4), day 28 (n = 3) or day
100 (n = 3). We analysed the following organs: blood
(plasma and PBMC), spleen, peripheral and mesenteric
lymph nodes, ileum and rectum.
SIVmac251 challenge stock
Cell-free virus stock of pathogenic SIVmac251 was kindly
provided by A. M Aubertin (Université Louis Pasteur,
Strasbourg, France). The virions were obtained from the
cell-free supernatant of infected rhesus peripheral blood
(PBMC). Cells were infected in vitro with a culture super-
natant obtained from a co-culture of rhesus PBMC and a
spleen homogenate from a rhesus macaque infected with
SIVmac251 (provided by R. C. Desrosiers, New England
Regional Primate Center, Southborough, Mass.).
Virological and immunological measurements and tissue
collection
Plasma and cell-associated viral loads as well as T-lym-
phocyte subsets were determined as previously described
[19,55]. Immediately after the animals were euthanized,
tissue samples (50 to 150 mg) were collected in quadru-
plicate from the spleen, peripheral lymph nodes (inguinal
or axillary), mesenteric lymph nodes, ileum, and rectum
and stored at -80°C.
Phenotype and cell sorting of T cells and monocyte/
macrophages
Naive, central memory and effector memory lymphocyte
subsets and CD14+ monocytes from PBMCs were pheno-
typed with an LSRII analyser (BD Biosciences) or live
sorted with a FACS ARIA machine (BD Biosciences). The
cell sorting was performed twice from each animal. The
following antibodies were used: CD3 Alexa Fluor 700
(clone SP34-2; BD Biosciences), CD4 PerCP (clone L200;
BD Biosciences), CD8 FITC (clone DK25; DakoCytoma-
tion), CD28 PEcy7 (clone 28.2; BD Biosciences), CD95
APC (clone DX2; BD Biosciences) and CD14 PE (clone
M5E2, BD Biosciences). CD4+CD28+CD95- cells were
considered to be naive T cells, CD4+CD28+CD95+ cells
were considered to be central memory cells and
CD4+CD28-CD95+ cells were considered to be effector
memory cells, as previously described (4). CD14+ cells
were considered to be CD14+ monocytes. Stained cells
were washed twice in PBS and were analysed by simulta-
neous four-way sorting on a FACS ARIA machine. The
purity of isolated cells was analysed by flow cytometry.
FlowJo software (TreeStar, Ashland, OR) was used for data
analysis.
Nucleic acid extraction
Tissue RNA and DNA extraction
Tissue lysates were obtained by the mechanical disruption
of tissue samples in RA1 buffer (Macherey Nagel, Hoerdt,
France) with a Precellys system, using 18 CK tubes with
ceramic beads (Bertin Technologies, Montigny-le-Breton-
neux, France). The tissue lysate was then diluted to 30 mg/
ml in RA1, aliquoted and stored at -80°C until extraction.
Total RNA was extracted in duplicate from aliquots of
lysate, with the Nucleospin 96 RNA kit (Macherey Nagel).
Contaminating DNA was removed from RNA samples by
DNA elution and DNase treatment. Total DNA was recov-
ered from tissue lysate with the Nucleospin 96 tissue kit
Retrovirology 2009, 6:106 />Page 12 of 15
(page number not for citation purposes)
(Macherey Nagel), according to the manufacturer's
instructions.
RNA and DNA extraction from sorted cells
We collected 20,000 cells from each cell subpopulation
directly after sorting in RA1 lysis buffer from the NucleoS-
pin
®
RNAXS kit (MACHERY-NAGEL). Purified cell lysates
from each subpopulation were split in half (lysate from
≈10,000 cells in each half), with one half used for RNA
extraction with the NucleoSpin
®
RNAXS kit and the other
half used for DNA extraction with the NucleoSpin
®
Tissue
XS kit (MACHERY-NAGEL). All extractions were per-
formed according to the manufacturer's instructions. The
RNA or DNA was eluted in 40 μl of nuclease-free water
and frozen immediately at -80°C for storage until analy-
sis.
Viral RNA quantification in tissues and sorted cells
RNA extracted from tissue or sorted cells was analysed in
duplicate in an RT-qPCR assay with the Superscript III
Platinum one-step quantitative RT-PCR system (Invitro-
gen, Cergy-Pontoise, France), using the SIV gag primers
and probe described elsewhere [55]. The reaction was car-
ried out and the data were acquired with the I-Cycler real-
time PCR system (Biorad, Marnes-la-Coquette, France).
The probe and primers, described by Hofmann-Lehmann
et al. [56], were designed to bind within the conserved SIV
gag region, a marker of transcription of full length tran-
scripts. The sequences of the primers used were: 5'-
CAATTTTACCCAGGCATTTAATGTT-3' and 5'-GCAGAG-
GAGGAAATTACCCAGTAC-3' (nucleotide position 389-
480). The TaqMan probe sequence was 5'-TGTCCACCT-
GCCATTAAGCCCGA-3', labeled at the 5' end with a fluo-
rescence reporter dye, FAM (6-carboxyfluorescein), and at
the 3' end with the quencher dye TAMRA (6-carboxyte-
tramethyl-rhodamine).
Quantification of viral RNA in tissue
RNA input was normalized by simultaneously quantify-
ing GAPDH RNA with a previously described primer set
and probe [57]. We included negative controls and serial
10-fold dilutions of SIV and GAPDH RNA for each exper-
iment, to assess amplification efficiency. As the efficien-
cies of all GAPDH and SIV reactions were similar, we
conducted a 2
-ΔCt
analysis. Results are expressed as
number of SIV RNA copies/number of GAPDH RNA cop-
ies.
Quantification of viral RNA in sorted cells
Absolute numbers of copies of viral RNA were normalised
to 10,000 cells and results are expressed as the number of
SIV RNA copies per 10
6
cells. Total RNA was extracted
from ≈10,000 sorted cells. We therefore checked the num-
bers of cells in each unknown sample. We generated RNA
standards (serially diluted 1:10 (up to 10
-4
)) for 10,000
cells from uninfected macaques. The GADPH gene was
then amplified simultaneously with a primer set and
probe, as previously described (5). GAPDH-RNA levels in
unknown samples were inferred by comparing threshold
cycle (Ct) values against a calibration curve. Unknown
samples had levels of amplifiable cDNA equivalent to
those for 10,000 cells.
Total viral DNA quantification in tissues and sorted cells
DNA extracted from tissues or sorted cells was analyzed in
duplicate by a real-time PCR assay, with the Platinum
qPCR SuperMix UDG kit (Invitrogen) and SIV gag primers
and probe, as previously described [55]. The reaction was
carried out and data were acquired and analysed with the
I-Cycler real-time PCR system (Biorad). The number of
copies of SIV DNA in unknown samples was inferred by
plotting the threshold cycle (Ct) value against a calibra-
tion curve (gag SIVmac251 DNA plasmid, linear dynamic
range 10 to 10
7
copies). The GAPDH gene was simultane-
ously amplified from genomic DNA, for normalisation,
using a previously described primer set and probe [57].
Results are expressed as the number of copies of SIV DNA
per 10
6
cells.
SIV 2-LTR circle quantification in tissues and sorted cells
The 2-LTR junction (≈ 305 bp) was amplified in duplicate
from tissue DNA or sorted cells, in a 25 μl reaction mix-
ture consisting of 1× Platinium
®
qPCR SuperMix-UDG
(Invitrogen), 450 nM of each primer and 250 nM fluoro-
genic probe. The primers used for amplification were
2LTRs 5'-TAAGCTAGTGTGTGTTCCCAT-3' (21 bp) and
REVN1 5'-CTCCTGTGCCTCATCTGATACA-3' (22 bp).
The TaqMan probe sequence was 5'-
[6~FAM]AGCCGCCGCCTGGTCAACTCG [TAM-
ARA~6~FAM]-3' (21 bp). Amplifications were carried out
and data acquired with an I-Cycler real-time PCR system
(Biorad). We used the following PCR parameters: dena-
turation for 10 minutes at 95°C, followed by 50 cycles of
95°C for 10 s, 61°C for 10 s and 72°C for 20 s. The copy
number of 2-LTR circles was determined from a standard
curve generated by the PCR amplification of serial dilu-
tions of the PCR4TOPO2-LTR plasmid including the
SIVmac251 2-LTR junction. The GAPDH gene was ampli-
fied from genomic DNA, in parallel. Results are expressed
as the number of copies of the SIV 2LTR sequence per 10
6
cells.
In situ hybridization
Cells expressing SIV RNA in lymphoid tissues were identi-
fied by in situ hybridization of sections of fixed tissues.
Radioactive in situ hybridization was performed as previ-
ously described [58]. The specificity of the hybridization
signal was systematically checked by hybridizing sense
probes on successive sections. Slides were counterstained
Retrovirology 2009, 6:106 />Page 13 of 15
(page number not for citation purposes)
with Mayer's hemalun and mounted in permanent
mounting media (Dako). Image acquisition and analysis
were performed on a Nikon i90 photomicroscope using
NIS-elements software.
Statistical analysis
Non-parametric Spearman's rank correlation test was
used to investigate the correlation between 2-LTR circle
levels and total viral DNA or plasma viral RNA levels in
longitudinal analysis. The Mann-Whitney test was used to
compare the levels of viral RNA, 2-LTR circles and total
viral DNA of different groups of macaques. Statistical
analysis was carried out with Statview software (SAS Insti-
tute, Inc., Cary, N.C).
Competing interests
The authors declare that they have no competing interests.
Authors' contributions
Conceived and designed the experiments: RLG, PR. Per-
formed the experiments: AM, OB, PS, BD, PB, TA, IK, PR,
RLG. Analyzed the data: AM, OB, PS, PR, BV, RLG. Wrote
the paper: AM, PS, OB, RLG, PR.
Additional material
Acknowledgements
We thank A. Blancher (Laboratoire d'Immunogénétique Moléculaire, Hôpi-
tal Rangueil, 168 Toulouse, France) for providing the analysis of MHC mic-
rosatellite haplotype. We thank also C. Joubert and the technical staff of the
CEA for animal care. This work was supported by the French national AIDS
agency, Agence Nationale de Recherche sur le SIDA et les Hépatites Virales
(ANRS, Paris France), EMPRO (LSH-2002-2.3.0-2), EUROPRISE European
network of excellence (LSHP-CT-2006-037611), the DORMEUR founda-
tion (Caduz, Switzerland) and the Commissariat à l'Energie Atomique
(CEA, France).
References
1. Mellors JW, Rinaldo CR Jr, Gupta P, White RM, Todd JA, Kingsley LA:
Prognosis in HIV-1 infection predicted by the quantity of
virus in plasma. Science 1996, 272:1167-1170.
2. Katzenstein TL, Pedersen C, Nielsen C, Lundgren JD, Jakobsen PH,
Gerstoft J: Longitudinal serum HIV RNA quantification: cor-
relation to viral phenotype at seroconversion and clinical
outcome. Aids 1996, 10:167-173.
3. Minga AK, Anglaret X, d'Aquin Toni T, Chaix ML, Dohoun L, Abo Y,
Coulibaly A, Duvignac J, Gabillard D, Rouet F, Rouzioux C: HIV-1
DNA in peripheral blood mononuclear cells is strongly asso-
ciated with HIV-1 disease progression in recently infected
West African adults. J Acquir Immune Defic Syndr 2008,
48:350-354.
4. Katzenstein TL, Oliveri RS, Benfield T, Eugen-Olsen J, Nielsen C, Ger-
stoft J: Cell-associated HIV DNA measured early during infec-
tion has prognostic value independent of serum HIV RNA
measured concomitantly. Scand J Infect Dis 2002, 34:529-533.
5. Beloukas APD, Psichogiou M, Hatzakis A: The role of HIV-1 DNA
as an additional marker of HIV-1 infection. Curr HIV Res 2009,
7:255-265.
6. Mattapallil JJ, Douek DC, Hill B, Nishimura Y, Martin M, Roederer M:
Massive infection and loss of memory CD4+ T cells in multi-
ple tissues during acute SIV infection. Nature 2005,
434:1093-1097.
7. Li Q, Duan L, Estes JD, Ma ZM, Rourke T, Wang Y, Reilly C, Carlis J,
Miller CJ, Haase AT: Peak SIV replication in resting memory
CD4+ T cells depletes gut lamina propria CD4+ T cells.
Nature 2005, 434:1148-1152.
8. Kilzer JM, Stracker T, Beitzel B, Meek K, Weitzman M, Bushman FD:
Roles of host cell factors in circularization of retroviral dna.
Virology 2003, 314:460-467.
9. Li L, Olvera JM, Yoder KE, Mitchell RS, Butler SL, Lieber M, Martin SL,
Bushman FD: Role of the non-homologous DNA end joining
pathway in the early steps of retroviral infection. Embo J 2001,
20:3272-3281.
10. Pierson TC, Kieffer TL, Ruff CT, Buck C, Gange SJ, Siliciano RF:
Intrinsic stability of episomal circles formed during human
immunodeficiency virus type 1 replication.
J Virol 2002,
76:4138-4144.
11. Butler SL, Johnson EP, Bushman FD: Human immunodeficiency
virus cDNA metabolism: notable stability of two-long termi-
nal repeat circles. J Virol 2002, 76:3739-3747.
12. Panther LA, Coombs RW, Aung SA, dela Rosa C, Gretch D, Corey L:
Unintegrated HIV-1 circular 2-LTR proviral DNA as a
marker of recently infected cells: relative effect of recom-
binant CD4, zidovudine, and saquinavir in vitro. J Med Virol
1999, 58:165-173.
13. Butler SL, Hansen MS, Bushman FD: A quantitative assay for HIV
DNA integration in vivo. Nat Med 2001, 7:631-634.
14. Sharkey M, Triques K, Kuritzkes DR, Stevenson M: In vivo evidence
for instability of episomal human immunodeficiency virus
type 1 cDNA. J Virol 2005, 79:5203-5210.
15. Re MC, Vitone F, Bon I, Schiavone P, Gibellini D: Meaning of DNA
detection during the follow-up of HIV-1 infected patients: a
brief review. New Microbiol 2006, 29:81-88.
16. Hauber I, Harrer T, Low P, Schmitt M, Schwingel E, Hauber J: Deter-
mination of HIV-1 circular DNA as a surrogate marker for
residual virus replication in patients with undetectable virus
loads. Aids 2000, 14:2619-2621.
17. Goedert JJ, O'Brien TR, Hatzakis A, Kostrikis LG: T cell receptor
excision circles and HIV-1 2-LTR episomal DNA to predict
AIDS in patients not receiving effective therapy. Aids 2001,
15:2245-2250.
18. Karlsson I, Malleret B, Brochard P, Delache B, Calvo J, Le Grand R,
Vaslin B: Dynamics of T cell responses and memory T cells
during primary SIV infection in cynomolgus macaques. J Virol
2007.
19. Benlhassan-Chahour K, Penit C, Dioszeghy V, Vasseur F, Janvier G,
Riviere Y, Dereuddre-Bosquet N, Dormont D, Le Grand R, Vaslin B:
Kinetics of lymphocyte proliferation during primary immune
response in macaques infected with pathogenic simian
immunodeficiency virus SIVmac251: preliminary report of
the effect of early antiviral therapy. J Virol 2003,
77:12479-12493.
20. Bourry O, Brochard P, Souquiere S, Makuwa M, Calvo J, Dereudre-
Bosquet N, Martinon F, Benech H, Kazanji M, Le Grand R:
Preven-
tion of vaginal simian immunodeficiency virus transmission
in macaques by postexposure prophylaxis with zidovudine,
lamivudine and indinavir. Aids 2009, 23:447-454.
21. Malleret B, Maneglier B, Karlsson I, Lebon P, Nascimbeni M, Perie L,
Brochard P, Delache B, Calvo J, Andrieu T, Spreux-Varoquaux O,
Hosmalin A, Le Grand R, Vaslin B: Primary infection with simian
immunodeficiency virus: plasmacytoid dendritic cell homing
to lymph nodes, type I interferon, and immune suppression.
Blood 2008, 112:4598-4608.
Additional file 1
Viral dissemination in the thymus of macaques during primary infec-
tion with SIVmac251. The viral DNA was evaluated in thymus tissue
from macaques infected with SIVmac251, on days 14, 21 and 28. Abso-
lute copy numbers for viral DNA were calculated to the GAPDH and nor-
malized to one million of cells.
Click here for file
[ />4690-6-106-S1.PPT]
Retrovirology 2009, 6:106 />Page 14 of 15
(page number not for citation purposes)
22. Staprans SI, Dailey PJ, Rosenthal A, Horton C, Grant RM, Lerche N,
Feinberg MB: Simian immunodeficiency virus disease course is
predicted by the extent of virus replication during primary
infection. J Virol 1999, 73:4829-4839.
23. Watson A, Ranchalis J, Travis B, McClure J, Sutton W, Johnson PR, Hu
SL, Haigwood NL: Plasma viremia in macaques infected with
simian immunodeficiency virus: plasma viral load early in
infection predicts survival. J Virol 1997, 71:284-290.
24. Mee ET, Berry N, Ham C, Sauermann U, Maggiorella MT, Martinon F,
Verschoor EJ, Heeney JL, Le Grand R, Titti F, Almond N, Rose NJ:
Mhc haplotype H6 is associated with sustained control of
SIVmac251 infection in Mauritian cynomolgus macaques.
Immunogenetics 2009, 61:327-339.
25. Veazey RS, DeMaria M, Chalifoux LV, Shvetz DE, Pauley DR, Knight
HL, Rosenzweig M, Johnson RP, Desrosiers RC, Lackner AA: Gas-
trointestinal tract as a major site of CD4+ T cell depletion
and viral replication in SIV infection. Science 1998,
280:427-431.
26. Clarke S, Almond N, Berry N: Simian immunodeficiency virus
Nef gene regulates the production of 2-LTR circles in vivo.
Virology 2003, 306:100-108.
27. Jurriaans S, Goudsmit J: Fluctuations in steady state level of
genomic HIV-1 RNA and replication intermediates related
to disease progression rate. Immunol Lett 1996, 51:15-22.
28. Lifson JD, Nowak MA, Goldstein S, Rossio JL, Kinter A, Vasquez G,
Wiltrout TA, Brown C, Schneider D, Wahl L, Lloyd AL, Williams J,
Elkins WR, Fauci AS, Hirsch VM: The extent of early viral repli-
cation is a critical determinant of the natural history of sim-
ian immunodeficiency virus infection. J Virol 1997,
71:9508-9514.
29. Cozzi Lepri A, Katzenstein TL, Ullum H, Phillips AN, Skinhoj P, Ger-
stoft J, Pedersen BK: The relative prognostic value of plasma
HIV RNA levels and CD4 lymphocyte counts in advanced
HIV infection. Aids 1998, 12:1639-1643.
30. Brenchley JM, Schacker TW, Ruff LE, Price DA, Taylor JH, Beilman GJ,
Nguyen PL, Khoruts A, Larson M, Haase AT, Douek DC: CD4+ T
cell depletion during all stages of HIV disease occurs pre-
dominantly in the gastrointestinal tract. J Exp Med 2004,
200:749-759.
31. Guadalupe M, Reay E, Sankaran S, Prindiville T, Flamm J, McNeil A,
Dandekar S: Severe CD4+ T-cell depletion in gut lymphoid tis-
sue during primary human immunodeficiency virus type 1
infection and substantial delay in restoration following highly
active antiretroviral therapy. J Virol 2003, 77:11708-11717.
32. Mehandru S, Poles MA, Tenner-Racz K, Horowitz A, Hurley A, Hogan
C, Boden D, Racz P, Markowitz M: Primary HIV-1 infection is
associated with preferential depletion of CD4+ T lym-
phocytes from effector sites in the gastrointestinal tract. J
Exp Med 2004, 200:761-770.
33. Zhang Z, Schuler T, Zupancic M, Wietgrefe S, Staskus KA, Reimann
KA, Reinhart TA, Rogan M, Cavert W, Miller CJ, Veazey RS, Noter-
mans D, Little S, Danner SA, Richman DD, Havlir D, Wong J, Jordan
HL, Schacker TW, Racz P, Tenner-Racz K, Letvin NL, Wolinsky S,
Haase AT: Sexual transmission and propagation of SIV and
HIV in resting and activated CD4+ T cells. Science 1999,
286:1353-1357.
34. Cheroutre H, Madakamutil L: Acquired and natural memory T
cells join forces at the mucosal front line. Nat Rev Immunol
2004, 4:290-300.
35. Mowat AM, Viney JL: The anatomical basis of intestinal immu-
nity. Immunol Rev 1997, 156:145-166.
36. Brenchley JM, Hill BJ, Ambrozak DR, Price DA, Guenaga FJ, Casazza
JP, Kuruppu J, Yazdani J, Migueles SA, Connors M, Roederer M,
Douek DC, Koup RA: T-cell subsets that harbor human immu-
nodeficiency virus (HIV) in vivo: implications for HIV patho-
genesis. J Virol 2004, 78:1160-1168.
37. Anton PA, Elliott J, Poles MA, McGowan IM, Matud J, Hultin LE, Gro-
vit-Ferbas K, Mackay CR, Chen ISY, Giorgi JV: Enhanced levels of
functional HIV-1 co-receptors on human mucosal T cells
demonstrated using intestinal biopsy tissue. Aids 2000,
14:1761-1765.
38. Agace WW, Amara A, Roberts AI, Pablos JL, Thelen S, Uguccioni M,
Li XY, Marsal J, Arenzana-Seisdedos F, Delaunay T, Ebert EC, Moser
B, Parker CM: Constitutive expression of stromal derived fac-
tor-1 by mucosal epithelia and its role in HIV transmission
and propagation. Curr Biol 2000, 10:325-328.
39. Cromwell MA, Veazey RS, Altman JD, Mansfield KG, Glickman R,
Allen TM, Watkins DI, Lackner AA, Johnson RP: Induction of
mucosal homing virus-specific CD8(+) T lymphocytes by
attenuated simian immunodeficiency virus. J Virol 2000,
74:8762-8766.
40. Veazey RS, Mansfield KG, Tham IC, Carville AC, Shvetz DE, Forand
AE, Lackner AA: Dynamics of CCR5 expression by CD4(+) T
cells in lymphoid tissues during simian immunodeficiency
virus infection. J Virol 2000, 74:11001-11007.
41. Meng G, Sellers MT, Mosteller-Barnum M, Rogers TS, Shaw GM,
Smith PD: Lamina propria lymphocytes, not macrophages,
express CCR5 and CXCR4 and are the likely target cell for
human immunodeficiency virus type 1 in the intestinal
mucosa. J Infect Dis 2000, 182:785-791. Epub 2000 Aug 2017
42. Mattapallil JJ, Letvin NL, Roederer M: T-cell dynamics during
acute SIV infection. Aids 2004, 18:13-23.
43. Veazey RS, Marx PA, Lackner AA: The mucosal immune system:
primary target for HIV infection and AIDS. Trends Immunol
2001, 22:626-633.
44. Mannioui A, Schiffer C, Felix N, Nelson E, Brussel A, Sonigo P, Gluck-
man JC, Canque B: Cell cycle regulation of human immunode-
ficiency virus type 1 integration in T cells: antagonistic
effects of nuclear envelope breakdown and chromatin con-
densation. Virology 2004, 329:77-88.
45. Schnittman SM, Lane HC, Greenhouse J, Justement JS, Baseler M,
Fauci AS: Preferential infection of CD4+ memory T cells by
human immunodeficiency virus type 1: evidence for a role in
the selective T-cell functional defects observed in infected
individuals. Proc Natl Acad Sci USA 1990, 87:6058-6062.
46. Rosenberg YJ, White BD, Papermaster SF, Zack P, Jarling PB, Eddy
GA, Burke DS, Lewis MG: Variation in T-lymphocyte activation
and susceptibility to SIVPBj-14-induced acute death in
macaques. J Med Primatol 1991, 20:206-210.
47. Ostrowski MA, Chun TW, Justement SJ, Motola I, Spinelli MA,
Adelsberger J, Ehler LA, Mizell SB, Hallahan CW, Fauci AS: Both
memory and CD45RA+/CD62L+ naive CD4(+) T cells are
infected in human immunodeficiency virus type 1-infected
individuals. J Virol 1999, 73:6430-6435.
48. Eckstein DA, Penn ML, Korin YD, Scripture-Adams DD, Zack JA,
Kreisberg JF, Roederer M, Sherman MP, Chin PS, Goldsmith MA:
HIV-1 actively replicates in naive CD4(+) T cells residing
within human lymphoid tissues. Immunity 2001, 15:671-682.
49. Brooks DG, Kitchen SG, Kitchen CM, Scripture-Adams DD, Zack JA:
Generation of HIV latency during thymopoiesis. Nat Med
2001, 7:459-464.
50. Ribeiro RM, de Boer RJ: The contribution of the thymus to the
recovery of peripheral naive T-cell numbers during antiret-
roviral treatment for HIV infection. J Acquir Immune Defic Syndr
2008, 49:1-8.
51. Kaiser P, Joos B, Niederost B, Weber R, Gunthard HF, Fischer M:
Productive human immunodeficiency virus type 1 infection
in peripheral blood predominantly takes place in CD4/CD8
double-negative T lymphocytes. J Virol 2007, 81:9693-9706.
52. Mederle I, Le Grand R, Vaslin B, Badell E, Vingert B, Dormont D, Gic-
quel B, Winter N: Mucosal administration of three recom-
binant Mycobacterium bovis BCG-SIVmac251 strains to
cynomolgus macaques induces rectal IgAs and boosts sys-
temic cellular immune responses that are primed by intra-
dermal vaccination. Vaccine 2003, 21:4153-4166.
53. Miller CJ, Li Q, Abel K, Kim EY, Ma ZM, Wietgrefe S, La Franco-
Scheuch L, Compton L, Duan L, Shore MD, Zupancic M, Busch M,
Carlis J, Wolinsky S, Haase AT: Propagation and dissemination
of infection after vaginal transmission of simian immunode-
ficiency virus. J Virol 2005, 79:9217-9227.
54. Miyake A, Ibuki K, Enose Y, Suzuki H, Horiuchi R, Motohara M, Saito
N, Nakasone T, Honda M, Watanabe T, Miura T, Hayami M: Rapid
dissemination of a pathogenic simian/human immunodefi-
ciency virus to systemic organs and active replication in lym-
phoid tissues following intrarectal infection. J Gen Virol 2006,
87:1311-1320.
55. Puaux AL, Marsac D, Prost S, Singh MK, Earl P, Moss B, Le Grand R,
Riviere Y, Michel ML: Efficient priming of simian/human immu-
nodeficiency virus (SHIV)-specific T-cell responses with
DNA encoding hybrid SHIV/hepatitis B surface antigen par-
ticles. Vaccine 2004, 22:3535-3545.
Publish with BioMed Central and every
scientist can read your work free of charge
"BioMed Central will be the most significant development for
disseminating the results of biomedical research in our lifetime."
Sir Paul Nurse, Cancer Research UK
Your research papers will be:
available free of charge to the entire biomedical community
peer reviewed and published immediately upon acceptance
cited in PubMed and archived on PubMed Central
yours — you keep the copyright
Submit your manuscript here:
/>BioMedcentral
Retrovirology 2009, 6:106 />Page 15 of 15
(page number not for citation purposes)
56. Hofmann-Lehmann R, Swenerton RK, Liska V, Leutenegger CM, Lutz
H, McClure HM, Ruprecht RM: Sensitive and robust one-tube
real-time reverse transcriptase-polymerase chain reaction
to quantify SIV RNA load: comparison of one- versus two-
enzyme systems. AIDS Res Hum Retroviruses 2000, 16:1247-1257.
57. Hu LH, Chen FH, Li YR, Wang L: Real-time determination of
human telomerase reverse transcriptase mRNA in gastric
cancer. World J Gastroenterol 2004, 10:3514-3517.
58. Le Tortorec A, Le Grand R, Denis H, Satie AP, Mannioui K, Roques
P, Maillard A, Daniels S, Jegou B, Dejucq-Rainsford N: Infection of
semen-producing organs by SIV during the acute and
chronic stages of the disease. PLoS One 2008, 3:e1792.