Báo cáo y học: " Dynamics of mitochondrial heteroplasmy in three families investigated via a repeatable re-sequencing study" doc
Bạn đang xem bản rút gọn của tài liệu. Xem và tải ngay bản đầy đủ của tài liệu tại đây (2.39 MB, 16 trang )
RESEARCH Open Access
Dynamics of mitochondrial heteroplasmy in three
families investigated via a repeatable
re-sequencing study
Hiroki Goto
1†
, Benjamin Dickins
2†
, Enis Afgan
3
, Ian M Paul
4
, James Taylor
3*
, Kateryna D Makova
1*
and
Anton Nekrutenko
2*
Abstract
Background: Originally believed to be a rare phenomenon, heteroplasmy - the presence of more than one
mitochondrial DNA (mtDNA) variant within a cell, tissue, or individual - is emerging as an important component of
eukaryotic genetic diversity. Heteroplasmies can be used as genetic markers in applications ranging from forensics
to cancer diagnostics. Yet the frequency of heteroplasmic alleles may vary from generation to generation due to
the bottleneck occurring during oogenesis. Therefore, to understand the alterations in allele frequencies at
heteroplasmic sites, it is of critical importance to investigate the dynamics of maternal mtDNA transmission.
Results: Here we sequenced, at high coverage, mtDNA from blood and buccal tissues of nine individuals from
three families with a total of six maternal transmission events. Using simulations and re-sequencing of clonal DNA,
we devise d a set of criteria for detecting polymorphic sites in heterogeneous genetic samples that is resistant to
the noise originating from massively parallel sequencing technologies. Application of these criteria to nine human
mtDNA samples revealed four heteroplasmic sites.
Conclusions: Our results suggest that the incidence of heteroplasmy may be lower than estimated in some other
recent re-sequencing studies, and that mtDNA allelic frequencies differ significantly both between tissues of the
same individual and between a mother and her offspring. We designed our study in such a way that the complete
analysis described here can be repeated by anyone either at our site or directly on the Amazon Cloud. Our
computational pipeline can be easily modified to accommodate other applications, such as viral re-sequencing.
Background
The mitochondrial genome is maternally inherited and
harbors 37 genes in a circular molecule of approxi-
mately 16.6 kb that is present in hundreds to thousands
of copies per cell [1] and has accumulated mutations at
a rate at least an order o f magnitude higher than its
nuclear counterpart [2,3]. Frequently, more than one
mtDNA variant is present in the same individual, a phe-
nomenon called ‘heteroplasmy’ [4]. The mitochondrial
genome is implicated in hundreds of diseases (over 200
catalogued at [5] as of mid-2010) with the majority of
them caused by point mutations [6]. Multiple mtDNA
mutations might also predispose one to common meta-
bolic and neurolo gical diseases of advanced age, such as
diabetes as well as Parkinson’s and Alzheimer’s diseases
[7]. Additionally, mtDNA mutations appear to have a
role in cancer etiology [8]. Many disease-causing
mtDNA variants are heteroplasmic and their c linical
manifestation depends on the relative proportion of
mutant versus normal mitochondrial genomes [7,9,10].
No effective treatment for genetic diseases caused by
mtDNA mutations currently exists, placing great
emphasis on reducing the occurrence and preventing
the transmission of these mutations in human popula-
tions [11]. There is therefore a pressing need to under-
stand the biological mechanisms for the origin and
* Correspondence: ; ;
edu
† Contributed equally
1
The Huck Institutes of Life Sciences and Department of Biology, Penn State
University, 305 Wartik Lab, University Park, PA 16802, USA
2
The Huck Institutes for the Life Sciences and Department of Biochemistry
and Molecular Biology, Penn State University, Wartik 505, University Park, PA
16802, USA
Full list of author information is available at the end of the article
Goto et al. Genome Biology 2011, 12:R59
/>© 2011 Goto et al.; licensee BioMed Central Ltd. This is an open access article distributed under the terms of the Creative Commons
Attribution License (http://creati vecommons.org/licenses/b y/2.0), which permits unrestricted use, distribution, and repro duction in
any medium, provided the original work is properly cited.
transmission of heteroplasmic mtDNA mutations. In
addition, mtDNA has been widely used as a marker in
molecular evolution, population genetics and forensics.
So, unraveling the dynamics of heteroplasmic mtDNA
mutations will have important impacts for these fields.
It is known that mtDNA genomes undergo a bottleneck
(decrease in numbers) during oogenesis; however, the
exact size of this bottleneck in humans, likely to be dif-
ferent from that in mice, h as been disputed and is not
easily amenable to expe rimental estimation [12]. Knowl-
edge of the size of the bottleneck is critical for modeling
mtDNA evolution, assessing its applicability as a genetic
marker, and for genetic co unseli ng of patients carrying
mtDNA mutations [13]. The size of the mtDNA bottle-
neck can be estimated more accurately when low fre-
quency heteroplasmic mutations are taken into account
[14].
In this study we pursued two goals. First, we wanted
to develop a robust workflow for detection of hetero-
plasmies from next-generation sequencing (NGS) data
and use it to trace maternal transmi ssion events. This is
because, despite the apparent importance of the muta-
tional dynamics of mtDNA, our understanding of this
process is hampered by lack of resolution, as most pub-
lished studies have used capillary sequencing that can
accurately detect only heteroplasmies with frequencies
>20% [15]. Therefore, some mutations detected in such
a manner were not real mutations, but shifts in hetero-
plasmy frequency between generations (for example,
from 15% in a mother to 85% in a child), and other
cases of real de novo mu tations might have gone unde-
tected (for example, from 0 % in a mother to 10% in a
child). The development and continuing evolution of
sequencing technologies offer a unique opportunity to
overcome these hurdles. Two recent studies have used
Illumina sequencing technology to study mtDNA het-
eroplasmy in normal and cancerous tissues [16,17] . The
firststudy[16]concludedthatheteroplasmyaffectsthe
entire mitochondrial genome and is common i n normal
individuals. Additionally, these authors analyzed cell
lines derived from individuals of two families and sug-
gested that most heteroplasmic mutations arise during
early embryogenesis. However, because only lymphoid
cell lines were analyzed, some of these mutations might
have either been germline (and not somatic) or arisen
during expansion of lymphoid cells in culture. In the
second study [17], the authors put a significant effort
into the in vestigation of limitations as sociated with call-
ing heteroplasmic variants from re-sequencing data gen-
erated by Illu mina platform. They sounded a cautionary
note after finding a relatively small number of variable
sites (37 sites in 131 unrelated individu als) and pointing
outthatsomevariantsreportedby[16]mightarise
from artifacts of Illumina sequencing. The discrepancy
between the two studies underscores the fact that,
despite the much higher resolution provided by Illumina
platform (a nd other NGS technologies), the detection of
heteroplasmic variants requires robust approaches such
as the one we sought to develop here.
The s econd goal of this study was to de sign our ana-
lyses in such a way that they can be easily repeated by
others. Reproducibility is particularly important if het-
eroplasmies are to be used as markers in applications
such as cancer diagnostics, as suggested by [ 16]. In fact,
the concern over reproducibility is common to almost
all studies utilizing the NGS technology. As mentioned
above, the advantage of using NGS for re-sequencing
lies in multiple sampling of individual genomic positions
by numerous independent reads, allowing for reliable
detection of very rare variants. Although conceptually
analysis of re-sequencing data is straightforward - collect
the data and map the reads - there are no established
practices for performing such analyses that can be
adopted easily by computationally averse investigators
comprising the majority of biomedical researchers. This
is largely due to the novelty of NGS technology as well
as its continuing rapid evolution and proliferation.
Because new tools for the analysis of NGS data appear
on a monthly basis, it is more important than ever to
preserve prima ry datasets, for they may be re-analyzed
as new algorithms are implemented. To alleviate this
difficulty, we designed our study in such a way that any-
one can reproduce our analyses in their entirety, modify
them, or tailor them to his/her specific needs as
described at [18].
Results and discussion
Families, tissues, and sequencing
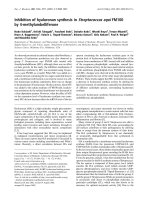
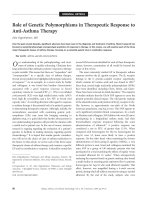
As a pilot dataset for our study, we chose nine indivi-
duals from three families representing s ix mother-to-
child transmission events (Figure 1). For each individual,
the DNA was collected from a cheek swab specimen
and from blood by our clinical collaborators at Penn
State College of Medicine, and mitochondrial genomes
were amplified by PCR using t wo primer pairs (see
Materials a nd Methods). To control for possible PCR-
induced errors, each amplification was performed twice
(with the exception of individuals M9 and M4-C3, for
which a single PCR was performed per tissue). In total
we generated (7 individuals × 2 tissues × 2 PCRs) + (2
individuals × 2 tissues × 1 PCR) = 32 single-end 76-bp
(100-bp reads were generated for blood of M4, M9, and
M4-C3) Illumina datasets (Figure 1). After generating
consensu s sequences for each sample based on the hg19
reference (AF347015), we adjusted the indexing to the
Cambridge Reference Sequence (NC_012920), collated
SNPs (indels were not accounted for) and determined
the haplogroups using the HaploGrep algorithm
Goto et al. Genome Biology 2011, 12:R59
/>Page 2 of 16
inco rporating Phylotree versi on 11 [17]. We deter mined
that members of families 4, 7, and 11 belong to hap-
logroups H1, U3a1 and K2a, respectively.
A robust set of criteria for detection of mitochondrial
variation
Even with the vast coverage that can be achieved with
modern sequencing technologies, detection of mitochon-
drial heteroplasmic sites is a challenge, for it is often diffi-
cult to distinguish between true allelic sites and
sequencing errors. To date, the methodologies for the
detection of heteroplasmic variants from NGS data can
be distilled from a simple counting of variants after align-
ing reads to a reference and application of various thresh-
olds to these counts in an attempt to weed out the noise.
In the mo st straightforward case described by He et al.
[16], the authors aligned the reads against the human
genome using a standard Illumina pipeline and derived a
frequency threshold (1.6%) by comparing sequencing
reads from three PCR replicates. This threshold was uni-
formly applied to all samples and any sites with allele fre-
quencies below 1.6% were d iscarded. In a more recent
study, Li et al. [17] devised a set of crit eria for reliable
detection of heteroplasmy by conducting simulations,
sequencing a clonal specimen (bacteriophage jX174) and
detecting heteroplasmic sites in arti ficially mixed sam-
ples. In addition to deriving a sequencing coverage-
dependent frequency threshold (10%, as their coverage
was generally low), these authors used base quality values
(phred metric [19] cutoffs of 20 and 23) and required all
heteroplasmies to be validated by at least two reads on
each strand. Application of this strat egy to m tDNA sam-
ples from 131 individuals revealed 37 heteroplasmic sites,
which is significantly fewer than the number reported by
He et al. [16], who did not use quality filtering and dou-
ble-stranded validation.
In designing our study, we adopted the strategy
described in [17] by conducti ng simulations, sequencing
a clonal specimen, using base quality values, and requir-
ing all heteroplasmies to be validated by r eads on each
of the two sequenced strands. Importantly, compared
with [17], we aimed at lowering the detection threshold
by increasing per-base coverage in our samples. To esti-
mate the detection threshold appropriate for our st udy,
we first selected the dataset with the smallest number of
reads (M4, cheek, PCR2, 584,539 reads; Figure 1) and
mapped it against the hg19 version of the human gen-
ome with BWA mapper [20] as describ ed in Materials
and Methods. After retaining only reads that map
uniquely to the mitochondrial genome, we obtained a
coverage distribution with a median of 1,170× (Figure
S1 in Additional file 1).
Simulations
Using coverage of 1,170× as a conservative starting
point, we performed simulations (as described in Mate-
rials and Methods) to estimate the false positive and
false negative rates given di fferent sequencing error r ate
thresholds (0.001, 0.01, 0.02, and 0.05) and minor allele
frequencies (heteropla smy detection thresholds of 0.001,
0.01, 0.05, and 0.1; see Materials a nd Methods for the
exact a lgorithm and the corresponding Python script).
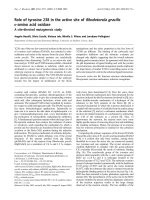
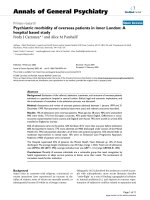
Results of these simulations are summarized in Figure 2.
One c an see that when the minor allele frequency and
the sequencing error rate are set to 0.01 and 0. 001 (the
latter corresponding to a phred [19] value of 30), respec-
tively, the resultant false negative and false positive rates
are near zer o. In other words, with the coverage we uti-
lized for our sequencing, we can accurately detect het-
eroplasmies with the minor allele frequency above 0.01
supported by sequencing reads where the corresponding
nucleotide has a quality sco re of at le ast 30 on t he
phred scale.
Figure 1 Indivi duals and samples used in the study. Numbers in parenthesis are the age of each individual ; the number at the bottom of
each table is count of sequencing reads.
Goto et al. Genome Biology 2011, 12:R59
/>Page 3 of 16
Sequencing a clonal specimen
Before applying these settings to ou r datasets, we wanted
to confirm whether these hold for the real data, which we
expected to be much noisier. To achieve this, we
sequenced a pUC18 plasmid isolated from a single col-
ony, which in theory should have no allelic variation
(’heteroplasmies’; jX174 utilized by Li et al. [17] houses
a considerable amount of variation [21] and pUC18 is a
much cleaner ‘non-heteroplasmic’ standard, as demon-
strated by the cloning and re-sequencing experiment
detailed in Materials and methods). After extracting
uniquely mapped reads, the cover age ranged from 19,382
× to 1,932,630 × with a median of 1,157,250×. A raw
count of differences (supported by bases with quality
score ≥30 on the phred scale) revealed that all positions
across the plasmid contained at least two reads with devi-
ant nucleotides (that is, different from the reference; the
median number of deviant reads per position was 154),
confirming considerable noise in the data. Applying the
0.01 frequency threshold derived from simulations
described above eliminated all variation with the excep-
tion of site 880 (with the major allele ‘G’), which con-
tained a minor allele ‘C’ with the frequency of 0.025. To
confirm that this is in fact a pUC18 variant (a prototype
of a heteropl asmic site), we analyzed reads that mapped
to forward and reverse strands separately. Such strand-
specific filtering was reported by Li et al. [17] to elimi-
nate the absolute majority of false positives. These
authors required each variant to be confirmed by at least
two reads on each s trand. Here we chose to be eve n
more conservative and required each variant to have the
frequency ≥0.01 on each strand. Application of this cri-
terion eliminated site 880, thus removing all variable sites
and confirming that our criteria eradicate the noise.
PCR duplicates
The very high coverage in the pUC18 experiment also
allowed us to evaluate the effect of PCR duplicates aris-
ing during Illumina sequencing on polymorphism detec-
tion. Such PCR duplicates usually result in a s ingle read
being repeated a large number of times. If a read sub-
jected to PCR duplication carries a polymorphism, the
frequency of this polymorphism becomes artificially
inflated. The pUC18 dataset contained a large number
of PCR duplicates with some reads repeated in excess of
50,000 times. However, because we require reads on
both strands to validate each polymorphism , PCR dupl i-
cates did not affect our final result.
PCR amplification
Our experimental design allowed us to estimate the
amount of error originating from PCR amplification of
Figure 2 False positive and false negative rates computed from simulation assuming 1,170× coverage. A Python script used to generate
these results can be found in Additional file 3.
Goto et al. Genome Biology 2011, 12:R59
/>Page 4 of 16
samples (not to be confused with PCR duplicates dis-
cussed above). Here we consider errors occurring during
PCR-basedenrichmentofmitochondrialDNApriorto
sequencing. Although Li et al. [17] de tected no PCR-
induced errors, their detection level was relatively low.
To see whether amplification may potentially bias our
results, we mapped all PCR replicates separately to the
genome and then compared them to each other, as
explained in Materials and methods (also see Additional
file 2). Briefly, we were looking at all sites where one
PCR replicate contained an allelic variant with a fre-
quency ≥0.01, whil e the other did not contain variants
at the same site. None of the samples contained such
sites and therefore PCR aberrations do not create pro-
blems in our data at the 0.01 frequency threshold.
Final criteria for detecting heteroplasmy
The above experiments all ow us to formulate a set of
rules for detection of heteroplasmic sites in our samples.
To call a site heteroplasmic, we require the frequency of
reads supporting a particular allele to be ≥0.02 (to be
conservative, we doubled the threshold from 0.01 to
0.02) on each strand and the quality of the base aligning
to such a position to be ≥30 on the phred scale (corre-
sponding to an error probability of 0.001).
Analysis of mixed samples: heteroplasmy recovery and
score recalibration
To confirm recovery of true polymorphisms by the
above set of criteria, we prepared a mix of DNA from
two individuals (M4 and M10C1 from families 4 and 7,
respectively) with 24 fixed singlenucleotidedifferences
(Figure S2 in Additional file 1). The mixing ratio (49:1;
see Materials and methods) was set to yield a 2% appar-
ent minor allele frequency with the identity of the
minor allel es corresponding to the M10C1 sequence. In
other words, the mixing was performed to make fixed
differences between the two individuals appear as ‘het-
eroplasmies’ with a minor allele frequency of approxi-
mately 2%. The mixed sample was sequenced to obtain
1,713,268 140-bp single-end reads. The reads were
mapped and analyzed using a procedure identical to
that described below (and see [18]). All 24 ‘polymorphic
sites’ were successfully recovered with this approach
(Figure S 2a, b in Additional file 1). The two PCR frag-
ments (A and B) were mixed separately, with 5 poly-
morphic sites in fragment A only, 17 sites in fragment B
only, and 2 sites covered by both fragments. The ranges
of such mixed ‘ heteroplasmies’ are very tight, and are
below our 2% threshold, arguing for the threshold valid-
ity: fragment A differences were, on average, 4.70%
(median = 4.81; range = 4.02 to 5.10; data with quality
score cutoff of 30); fragment B differences were, on
average, 2.91% (median = 2.98; range = 2 .19 to 3.55);
the two sites covered by both fragments averaged 3.04%
(range = 2.97 to 3.11). The resulting heteroplasmy ratios
differed from 2%, but we attribute this t o pipetting
error.
State-of-the-art genotyping pipelines such as the one
used in the 1000 Genomes Project utilize post-align-
ment recalibration of machine-reported base quality
scores to improve the reliability of polymorphism calls.
To test the effect of recalibration on our data, we
applied the approach implemented in the GATK soft-
ware [22] to recalibrate base qualities in reads corre-
sponding to the mixed sample described here. Although
recalibrati on decreased the number of bases with phred-
scaled quality of 30 (Figure S3 in Additional file 1), it
did not change the outcomes of our analysis, with all
minor varian ts being reliably detect ed (Figure S2 in
Additional file 1). A lthoug h the exact frequencies of the
minor alleles changed after recalibration (Figure S2C &
D in Additional file 1), the change was not significant.
Indeed, in an ANOVA with ampliconic segment (A, B
or overlapping, as mtDNA was amplified in two seg-
ments A and B with a small overlap), recalibration (yes
or no) and quality cutoff (25 or 30) as factors, only the
ampliconic segment accounted for significant variation
in heteroplasmy levels ( P < 0.001, type III sums of
squares). This was consistent with some variation in
sample mixing ratios between amplicons. Recalibration
and quality cutoff were insignificant (P > 0.10) whether
or not ampliconic segment was included in the model.
Therefore, we achieved a rea sonable level of precision in
our estimates of heteroplasmy without the need for
score recalibration.
Heteroplasmies in the three families
Using the above criteria, we first identified all sites in
our samples that contained differences from the refer-
ence with frequency ≥0.02. Note that this initial screen-
ing identified not just heteroplasmic sites (which, by
definition, must contain two alleles) but also differences
between our samples and the reference mtDNA genome
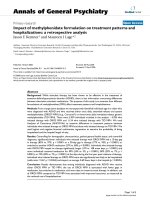
(AF347015). A summary representing all such sites is
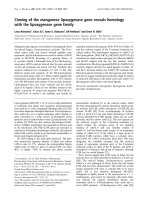
shown in Figure 3. O ne can see t hat there is substantial
variation among the three families. A bona fide hetero-
plas mic site is evident at position 8,992 in family 4 with
two high frequency alleles: C (green) and T (red). To
identify heteroplasmies with lower frequencies of the
minor allele, we scanned all positions shown in Figure 3
to locate sites containing two allelic variants with fre-
quency ≥0.02. While performing this analysis, we
excluded low-c omplexity regions (66 to 71, 303 to 309,
514 to 523, 12,418 to 12,425, 16,184 to 16,193) for rea-
sons that we explain in the next section. This yielded
four sites (including site 8,992 mentioned above) in two
of the three families (there were no heteroplasmic sites
in family 11) that either showed consistent heteroplasmy
in all individuals or exhibited patterns of somatic or
Goto et al. Genome Biology 2011, 12:R59
/>Page 5 of 16
germline alterations (Table 1). There was no overlap
between the heteroplasmic sites identified in thes e
families and those reported by [16,17] and most recently
by the 1000 Genomes Project [23]. The identified sites
were divided into three categories: (1) sites without
allele frequency shifts; (2) sites with allele frequency
shifts and (3) sites with de novo mutations (labeled as
WS, F S and DN in Table 3, respectively). An extensive
search of the MitoMap database and literature revealed
that all sites reported here (with the exceptio n of 8,992)
have been previously observed as variable, yet only one,
14,053 is non-synonymous.
The most abundant type of heteroplasmy in our data
isthefrequencyshift(seeFigureS4inAdditionalfile1
for validation with allele-specific PCR), with site 8,992
in family 4 being the most prominent. Here the major
all ele frequ ency fluctuated from a minimum of 0.526 to
a m aximum of 0.688. Interestingly, in the grandmother
(individual M5G; Figure 1) there was a significant (P
<0.0001, odds ratio test) variation in frequency between
blood (C = 0.652 (34,253 reads); T = 0.347 (18,246
reads)) and buccal tissue (C = 0.545 (21,243 reads); T =
0.454 (17,709 reads)). This variation between tissues
becomes less profound in one daughter (M9; P =
0.0004) and disappears altogether in the other (M4; P =
0.96), reappearing in one child of M4 (M4-C1; P =
0.0006) but remaining non-significant in the other (M4-
C3; P=0.98). Only one heteroplasmy (positi on 5,063; C
is the minor allele, G is the major allele) appears to be
suggestive of a germline origin. It is observed in blood
(the frequency in blood is 0.016, just below the 0.02
error threshold) and buccal tissue (with frequency of
0.0201) of individual M4 (Figure 1). Although other
members of family 4 display reads carrying the minor
allele, its frequency remains negligible (below 0.001 in
all individuals). This includes both children of M4 and
suggests that after a de novo mutation in M4, the variant
allele was lost i n her chil dren (we label this loss as a
germline allele frequency shift). Two remaining hetero-
plasmies (site 7,028 in family 4 and site 14,053 in family
7) are both consistent with the frequency-shift scenario,
yet insufficient coverage in some individuals and tissues
(Tables 1 &2) prevents us from observing transmission
events without i nterruption. At site 7,028 the hetero-
plasmy shift is of somatic origin (it occurred i n blood of
M4C3), while at site 8992 it is of ge rmline origin (both
analyzed tissues of M4C1 have increased allele fre-
quency). These data suggest that the number of
Figure 3 A representation of all differences found between each sequenced individual and the reference h uman mtDNA fro m
genome build hg19. The colored bars (blue = A, green = C, orange = G, red = T) represent the frequency of a given allele in each sample. For
example, at position 8,992 one can clearly see a heteroplasmy with two high frequency alleles C and T. Lines on top of the image represent
location and orientation of mitochondrial genes. F1 = Family F4, F2 = Family F7, F3 = Family F11.
Goto et al. Genome Biology 2011, 12:R59
/>Page 6 of 16
Table 1 Allele frequencies at heteroplasmic sites in Family F4.
Family F4
Tissue Site Ref M5G (grandmother) M9 (daughter of M5G) M4 (daughter of M5G) M4-C1 (child of M4) M4-C3 (child of M4)
A C G T cvrg A C G T cvrg A C G T cvrg A C G T cvrg A C G T cvrg
blood 5063 T 0.000 0.001 0.000 0.998 81,207 0.000 0.001 0.000 0.999 21,069 0.000 0.016 0.000 0.984 12,376 0.000 0.001 0.000 0.999 5,228 0.000 0.001 0.000 0.999 50,019
7028 T 0.002 0.975 0.001 0.021 5,739 0.001 0.966 0.001 0.032 1,671 0.000 0.975 0.000 0.025 5,102 no data 0.002 0.910 0.000 0.088 4,036
8992 C 0.000 0.652 0.000 0.347 52,519 0.000 0.659 0.000 0.341 15,597 0.000 0.672 0.000 0.327 14,174 0.000 0.526 0.000 0.474 4,585 0.000 0.670 0.000 0.330 35,005
ACTGcvrg ACTGcvrg ACTGcvrg ACTGcvrg ACTGcvrg
cheek 5063 T 0.000 0.001 0.000 0.999 59,896 0.000 0.001 0.000 0.999 20,635 0.000 0.020 0.000 0.980 2,294 0.000 0.002 0.000 0.998 2,073 0.000 0.001 0.000 0.998 29,013
7028 T 0.001 0.982 0.001 0.015 3,905 0.001 0.965 0.001 0.033 1,526 no data no data 0.001 0.965 0.000 0.034 2,071
8992 C 0.000 0.545 0.000 0.454 38,968 0.000 0.639 0.000 0.360 14,624 0.000 0.686 0.000 0.314 1,931 0.001 0.578 0.000 0.421 1,433
0.000 0.669 0.000 0.330 19,214
The frequencies were calculated by dividing the number of reads supporting a given allele by the quality adjusted coverage listed in “coverage” column. Quality adjusted coverage = number of reads where the base
aligning over a given position has a phred score equal or higher than 30.
Goto et al. Genome Biology 2011, 12:R59
/>Page 7 of 16
heteroplasmic sites per individual is relatively low and
that the frequency of heteroplasmies fluctuates consider-
ably through the transmission events (for a quantitative
discussion see Conclusions).
Erroneous heteroplasmies at low complexity regions
Another two sites that immediately stand out in Figure
3 are potential heteroplasmies at positions 309 to 310
and 16,184 to 16,190. They did not make it to the list of
heteroplasmies reported here (Table 1) because we
excluded low complexity sequences corresponding to
these coordinates from the initial analysis. However, the
region around site 16,190 has been reported as variable
in a number of publications, and most recently He et al.
[16] highlighted these positions in their re-sequencing of
CEPH families. The interesting feature of this region i s
the fact that it harbors insertion/deletion variation
[24-27], and therefore we were interested in examining
these sites for possible indel heteroplasmies (note that
up to this poi nt we discussed heteroplasmies that
involve only point mutations). To do so, we searched
for sequencing reads with insertions or deletions relative
to the reference sequen ce using the following stringent
approach. For a variant to be called an indel, we
required it to be in the middle of a sequencing read and
to have ten high quality bases (phred above 30) on each
side. Although we did not find sites heteroplasmic for
indels using this approach in our samples, we observed
that fixed indel polymorphisms might present
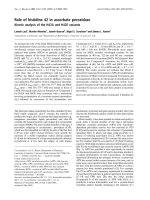
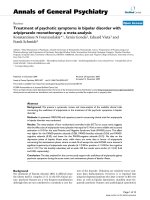
themselves as erroneous heteroplasmic sites. To illus-
trate this situation, consider site 16, 186, which was initi-
ally deemed by us to be heteroplasmic in all individuals
examined in the study (Figure 4). A close examination
of this site (Figure 4, set A) show s a series of reads with
or without a C deletion at position 16,183. Yet one can
see that all reads lacking the deletion end nearby (not
reaching the end of the 16,163 to 16,169 poly-C stretch),
while reads with the deletion extend through the region.
To examine this furt her, we selected a subset of reads
that would cover the region shown in Figure 4 comple-
tely. As illustrated in set B of Figure 4, all of these reads
contain the gap, yet display so me disagreement in the A
substitution flanking it. Finally, we processed reads
further by requiring ten high quality bases (phred ≥30)
to extend in both directions from t he gap, as shown in
set C of Figure 4. As a result, one can see that there is
an A insertion and a C deletion at this region that are
fixed. Coincidentally, two of the si tes confirming mater-
nally derived heteroplasmy in CEPH family 1377 pub-
lished by Li et al. [16] fall within the r egion we just
described. The authors of the manuscript have kindly
provided their data and we were able to re-examine the
potential heteroplasmy at positions 16,186 and 16,187
(Table 3 in He et al.[17])byremappingthereadsto
the mitochondrial genome. As shown in Figure S5 in
Additional file 1, the frequencies reported by Li et al.
[16] have likely resulted from misalignment, as very few
reads span the poly-C stretch, and both sites reported
Table 2 Allele frequencies at heteroplasmic sites in Family F7.
Family F7
M10 (mother) M10-C2 (child of M10)
A C T G cvrg A C T G cvrg
blood 14053 A 0.975 0.010 0.012 0.002 403 no data
cheek 14053 A 0.970 0.008 0.023 0.000 527 0.968 0.003 0.026 0.003 380
The frequencies were calculated by dividing the number of reads supporting a given allele by the quality adjusted coverage listed in “coverage” column. Quality
adjusted coverage = number of reads where the base aligning over a given position has a phred score equal or higher than 30.
Table 3 Context and effect of alleles observed in the six heteroplasmic sites
Reference Mutated
Position Type 11 bases prior to
mutation site
Reference
base
Strand Codon Amino
acid
Codon
position
Codon Amino
acid
S/
N
Gene
5,063 DN (germline), FS
(germline)
CCGTACAACCC T + cct Pro 3rd ccc Pro S NADH
dehydrogenase
subunit 2
7,028 FS (somatic) TACGTTGTAGC T + ggt Gly 3rd ggc Gly S Cytochrome c
oxidase subunit I
8,992 FS (germline) AACCAATAGCC C + ctg Leu 1st ttg Leu S ATP synthase 6;
ATPase subunit 6
14,053 WS ACCAAATCTCC A + acc Thr 1st ccc Pro N NADH
dehydrogenase,
subunit 5
DN, de novo mutation; FS, allele frequency shift; WS, without allele frequency shift; N, nonsynonymous substitutions; S, synonymous substitutions.
Goto et al. Genome Biology 2011, 12:R59
/>Page 8 of 16
by the authors (16,186 and 16,187; Table 3 in [16])
likely represent the same C/T t ransition event that is in
fact fixed in all examined individuals. The only differ-
ence between the father and the rest of the family is the
addition of an A at site 16,183 (which is coincidentally
fixed in all individuals of the three families examined
here). This example highlights that when identifying
indels from short read data, one needs to pay special
attention to the positions of identified variants with a
read. This is because most ‘variation’ in set A in Figure
4 is located within the 3’ ends of Illumina reads, which
are well known to host the majority of inac curately
called bases (likewise with SOLiD reads; see [28] for an
excellent overview of the pros and cons of current NGS
technologies).
Replicating our results: a general workflow for the
analysis of heteroplasmy
Above we described our methodology for detection of
heteroplasmic sites. The same procedure may be useful
Figure 4 Reads aligning around the low complexity region 16,184 to 16,190. Set A: a set of random reads aligning across the region with
no quality filtering performed. Set B: bridging reads; these were selected by requiring the low complexity region (positions 16,184 to 16,190) to
be in the middle of the read. Set C: high quality reads containing indels; these were required to align across positions 16,184 to 16,190 and
contain ten aligning high quality bases (phred value of 30 or higher) on each side of the indel.
Goto et al. Genome Biology 2011, 12:R59
/>Page 9 of 16
for other groups studying mitochondrial variation or
similar types of mixed samples (for example, vi ral iso-
lates where frequency of individual variants may vary
widely). The second objective of this work was to make
our approach easily repeatable so that any reader of this
manuscript can reproduce our results or adopt our pro -
cedures for use on their own datasets. This is especially
relevant as heteroplasmies may be used as potential can-
cer biomarkers [16,29] and providing the ability to repli-
cate this analysis by any researcher or clinician would
therefore be highly beneficial. There are two compo-
nents to making research reproducible. First, one needs
to make data accessible, which is a challenge in itself as
some of the datasets generated by NGS technologies are
extremely large. Second, one needs to capture all details
involved in the analysis of these data, including the tools
used and their exact settings. P reviously we have devel-
opedasoftwareframework-Galaxy[30-32]-thatis
well suited for disseminating the data and linking them
with the analysis tools in a simple to use web-based
interface. We used Galaxy to store all the data and to
perform all analyses described here.
Data
The 32 Illumina datasets representing the three families
as well as the pUC18 re-sequencing data are available at
Galaxy [18] in additio n to being deposited in standard
repositories (Sequence Read Archive (SRA), see Materi-
als and methods for acce ssion numbers). From there the
datasets can be freely downloaded and readily used to
replicate the analyses described in this manuscript.
Analyses
Earlier we described a set of criteri a for the detection of
heteroplasmic sites. Although these criteria are straight-
forward, a substantial number of intermediate steps are
required to execute them to transform a collection of
sequencing reads into a list of heteroplasmies. The
Galaxy workflow incorporates all the necessary proce-
dures needed to achieve this (Figure 5). A detailed
description of the workflow, links to all analyses we per-
formed to generate Figure 3, Table 1, and Table 2, and
a movie explaining minute details of the entire proce-
dure are p rovided in a dedicated Galaxy page [18] (a
Galaxy page is a medium designed to capture all data
and metadata associated with a biological analysis [32]).
From this page the workflow can be executed as is or
modified by anyone, making our analysis completely
transparent down to minute details. Briefly, the work-
flow starts with the sequencing reads, maps them using
BWA mapper [20], splits the results into two strand-
specificbranches(onefortheplusstrandandonefor
the minus strand), transforms datasets from read-centric
(Sequence Alignment/Map (SAM)) to genome -centric
Figure 5 Workflow for finding heteroplasmic sites from Illumina data. This workflow can be accessed, used, and edited at [18].
Goto et al. Genome Biology 2011, 12:R59
/>Page 10 of 16
form (pileup) and performs a number of filtering and
thresholding steps before merging the branches and
generating a list of sites that contain allelic variants with
the frequency above 0.01 (at [18], one can click on every
step to see the exact set-ting used and a detailed anno-
tation expla ining why a particular step was necessary). It
is i mportant to note that despite the apparent simplicity
of the procedure, a large number o f steps is involved
(the workflow contains 45 steps) and some of the steps
(such as mapping, which is best performed on a multi-
CPU machine) require dedicated computational
resources. T his complex logistics is what creates a for-
midable wall preventing an ‘ average’ biomedical
researcher from performing analyses of NGS data on a
regular basis. To the best of our knowledge, this is one
of a few re-sequencing studies that publish all data and
analyses in a fully reproducible form.
Repeating the same analysis on the Cloud
Using the workflow provided above, anyone can pre-
cisely reproduce the analysis described here, or apply
the approach to new datasets. The public Galaxy site
[30] (where the workflow is hosted) could be used for
this purpose, although this may not always be ap propri-
ate for several reasons. First, privacy concerns might
prevent the use of an external web resource for proces-
sing clinical samples. Second, the public Galaxy site is a
heavily used shared resource; if the number or size of
datasets to process is considerable, the delays associated
with sharing bandwidth and compute resources may not
be acceptable or desirable.
An alternative approach is to run a Galaxy instance
locally (see [33] for details). G alaxy can ea sily be
installed on a variety of platforms, and workflows can be
moved b etween Galaxy instances. However, this would
require acquiring and maintaining local compute
resources for Galaxy to use. To perform analysis as
quickly as possible w ould require significant local
reso urces; however, the cost of these resources, particu-
larly if they are not being fully utilized all the time, may
be prohibitive.
A very attractive third option is to acquire the com-
pute resources necessary to perform the analysis on
demand from a ‘ cloud computing’ provider. This
approach is particularly suitable for analyses that benefit
from the availability of large amounts of computing
power when running, but that are run relatively infre-
quently. This provides a very cost-effective solution for
smaller labs. However, cloud computing resources are
typically provided as internet accessible virtual
machines, and users must still have informatics expertise
to conf igure and run analysis on them . To addr ess this,
we have developed a solution that allows users to
quickly deploy and configure a private Galaxy instance
on the Amazon AWS cloud using nothing but a web
browser (E Afgan et al., in press). Additional computa-
tional resources can be added to and removed from the
private Galaxy instance dynamically, allowing users to
perform their analysis as quickly as possible, b ut only
paying for the amount of computing time they use.
Combined with the workflow outlined here, this pro-
vides a turnkey solution for identifying heteroplasmic
sites that is ready t o run with nothing but a web brow-
ser.Inaddition,allofthedatausedherehavebeen
deposited i nto the AWS cloud, a llowing readers to
exactly reproduce and verify our results. The Galaxy
page [18] provides all details for immediate instantiation
of an instance capable of repeating all analyses described
here (along with the 32 sequencing datasets).
Conclusions
Heteroplasmies are relatively infrequent
The first study utilizing NGS technology for detection of
heteroplasmies [16] conclude d that these events are
more frequent than was originally anticipated, with 40
heteroplasmies identifi ed in 10 individu als (using a 1.6%
detection threshold). A subsequent study by Li et al.
[17] utilized a more sophisticated approach and detected
37 heteroplasmies in 131 individuals (using a 10% detec-
tion threshold). Li et al.usedare-samplingtestto
demonstrate that they in fact detect significantly fewer
heteroplasmies than He et al. [16], which may be due to
several methodological and/or experimental design
issues, such as the source tissues used to isolate mtDNA
and the age of studied individuals. Our results are not
directly comparable to these two studies because our
individuals are related. To make our data compatible
with those of Li et al., we chose a single individual from
each family (M4, M10, and M15 from families 4, 7, and
11, respectively; Figure 1) and counted heteroplasmies
above the detection threshold of 10%. This yielded three
individuals with a single heteroplasmy in just one of
them (at position 8,992 of individual M4; Tab le 1). This
number of heteroplasmic sites (one in three individuals)
is not significantly different from the one reported by Li
et al. (37 among 131 individuals; P=0.8375 obtained by
simulating 10,000 draws from Poisson distribution s with
means 3 7 and 1). The most directly comparable hetero-
plasmy occurrence in the He et al. [16] study is for par-
ents of the two studied families: ten heteroplasmies
were observed in four individuals, using the 2% thresh-
old. This is again not significantly different from our
observation, with f our heteroplasmies in three indivi-
duals, at the 2% threshold (P=0.4992 obtained by
simulating 10,000 draws from Poisson distribution s with
means 10 and 4). Despite substantial differences in het-
eroplasmy occurrence, we cannot conclude that this dif-
ference is significant, due to the small scale of our and
Goto et al. Genome Biology 2011, 12:R59
/>Page 11 of 16
He et al.’ s [15] studies. To the extent that differences
are observed between studies, these may also be attribu-
table to sampling and/or experimental design discrepan-
cies among the three studies resulting in different
outcomes, as menrioned above. These considerations led
us to be cautious and reluctant to conclude that NGS-
based studies will reveal unprecedented numbers of het-
eroplasmies, even while they are well suited to detection
of low frequency heteroplas mies (as described in the
introduction). Additional ly, the 1000 Genomes P roject
has identified 67 heteroplasmic sites with frequency
above 10% in 163 individuals [22], a number roughly
comparable to that of Li et al. [17] and this study.
Heteroplasmy frequency changes through transmission
events
Becausemitochondriaundergoabottleneckduring
oogenesis, it is expected that the frequency of alleles at
het eroplasmic sites will be different even among related
individuals. Site 8,992 in family 4 (Figure 1; Table 1)
allows us to test this assumption. This site is heteroplas-
mic in all five representatives of this family and can be
tracked through four transmission events (M5G ® M9,
M5G ® M4, M4 ® M4-C1, and M4 ® M4-C3; Figure
1). To test whether the allele frequencies are different in
each tissue at each transmission event, we performed a
re-sa mpling test using maternal allele frequencies as the
background dist ribution from which we randomly
sampled N alleles, where N was equal to the sequencing
read coverage in the child in each case. Each re-sam-
pling was performed 10,000 times to construct a distri-
bution from which empirical P-values were calculated.
Only in one case (M4 ® M4-C3) was there no signifi-
cant difference between frequencies in mother and child
(P=0.76 and P = 0.63 for blood and cheek, respectively;
alternative testing using Fisher’sexacttestforcount
data gave the same conclusion). These results suggest
that the allele frequency at heteroplasmic sites under-
goes significant changes during transm ission events, and
care should be taken when using heteroplasmies as bio-
markers in, for instanc e, forensic or cancer applications.
However,theseresultsarebasedonasinglesite,two
tissues, and a limited number of transmission events. A
larger scale study is currently underway in our labora-
tory, which will help to address these deficiencies.
A general approach for detection of variants in mixed
samples
Detection of heteroplasmies is just one example of a
general scenario in which one desires to count variants
within a large population of DNA molecules where the
frequency of each variant c an range from 0 to 1. The
approach described here can be used in other cases with
one of the most relevant applications being re-
sequencing of bacterial or viral populations where dis-
tinct isolates are sequenced to identify variants with dif-
ferent phenotypic manifestations [21,34-38]. (Note
however, that this is different from analyses of pooled
population samples such as those pioneered by Van
Tassell et al. [39] and perfected by Bansal and collea-
gues [40,41] in that in these cases the number of pooled
individuals is known, allowing expected allele frequen-
cies to be estimated). As bacterial and viral genomes are
gen erally modest in s ize, an exceptiona l dept h of cover-
age can be achieved in these cases, significantly reducing
the lower bound of detectable allele frequency. Addi-
tionally, our methodology can be further improved by
using information about positions of variant bases
within sequencing reads, as was proposed by Bansal et
al. [41], and adding tools for haplotype reconstruction
previously implemented by our group [21] or most
recently proposed by Zagordi et al. [42].
A turnkey solution for re-sequencing of mixed samples
As was noted in the Results and discussion, reproduci-
bility is the Achilles’ heel of modern life sciences. Even
the two manuscripts most frequently mentioned here -
He et al. [16] and Li et al. [17] - are not entirely repro-
ducible as sequencing data are only available on request
and the exact settings of tools used and some of the
scripts utilized in the data pro cessing are not available
as supplementary material. We emphasize that in high-
lighting these deficiencies we are not being critical of
these authors, as maki ng data, tools, and research meta-
data universally accessible is an engineering challenge in
itself. To establish a precedent of data- and computa-
tionally intensive re-sequencing studies being completely
reproducible, we leveraged the Galaxy system [32] to
make all data and analysis steps accessible and transpar-
ent. Importantly, a nyone possessing similar datasets can
use our workflow to analyze their own data through the
Galaxy public service [18], their own installation [33], or
using Amazon Cloud [43] for a complete ‘hardwa re-free’
solution. This makes our work complet ely transparent
and re-usable as anyone has compl ete access to all ana-
lytical details and can modify our protocol and adopt it
to his/her needs. It is our hope that Galaxy, together
with deve loping analysis portals such as MyExpe riment
[44] and Genomespace [45], will be able to significantly
increase the number of fully reproducible studies in the
biomedical sciences.
Materials and methods
Samples
Several families were recruited in this study; however,
for three families (4, 7, and 11; Figure 1) we were able
to amplify mtDNA (see below) in sufficient quantities
first and thus samples from these three families were
Goto et al. Genome Biology 2011, 12:R59
/>Page 12 of 16
used for subsequent sequencing and analysis. Blood and
cheek swab were obtained with informed written con-
sent from each individual. This s tudy was approved by
the Human Subjects Protection Office of the Penn State
College of Medicine.
Sample collection and DNA extraction
Blood was collected from a finger using a BD Microtai-
ner contact-activated lancet (catalogue number 366593
or 36 6594; BD, Franklin Lakes, NJ, USA) and was pre-
served in BD Microtainer Tubes with K2E (catalogue
number 365974) u ntil DNA e xtraction. DNA was iso-
lated using Qiagen DNeasy Blood and Tissue Kit (Qia-
gen Sciences, Germantown, MD, USA). Finally, DNA
was placed in 200 mL Tris-EDTA (TE) buffer (10 mM
Tris-HCl, 1 mM EDTA, pH 8.0).
DNA extraction from buccal cells was carried out
according to the method detailed in Freeman et al. [46].
Buccal cells were collected by scraping the inside of the
mouth with cotton swabs on pl astic sticks. These swabs
were placed in Slagboom buffer (0.1 M NaCl, 10 mM
Tris-HCl pH8, 10 mM EDTA, 0.5% SDS) with Protei-
nase K (0.2 mg/ml). Proteins were removed by organic
de-proteinization reagent (ORPR), and DNA was preci-
pitated with isopropyl alcohol. The DNA was re-sus-
pended in 250 ml of TE buffer.
PCR amplification
Whole mitochondrial DNA was amplified with two set s
of primers: L2815 and H1 1571; L10796 and H3370.
These primers were originally described in Tanaka et al.
[47]. The PCR amplification was performed in 20 μl
with 10 ng genomic DNA, 0.2 mM dNTPs (PCR grade;
Roche Applied Science, Indianapolis, IN, USA), 0.84
units Expand High Fidelity PCR Enzyme mix (Roche
Applied Science), 1 × buffer including 1.5 mM Mg
2+
,
and 0.4 μM forward and reverse primers (Integrated
DNA Technologies, Inc., Skokie , Illinois, USA). Thermal
cycling conditions consisted of two different cycles. The
first cycle was 94°C for 15 s, 60°C for 30 s, and 68°C for
8 minutes for 10 repeats. The second cycle was 94°C for
15 s, 60°C for 30 s, and 72°C for 8 minutes for 20
repeats. The extension time was elongated by 5 seconds
for each successive cycle. The PCR product was
cleaned-up by gel purification with NucleoSpin Extract
II kit (Macherey-Nagel GmbH and Co. KG, Düren, Ger-
man y). For each sample, two PCR products obta ined by
two independent reactions were prepared for
sequencing.
Preparation and sequencing of clonal DNA
AG1 cells (50 μl) were heat-shock transformed (42°C, 45
s) with 1 pg pUC18 DNA (catalogue number 200232,
Agilent Technologies, Santa Cl ara, CA, USA). AG1 cells
were chos en because they are endonuclease (endA) and
recombination (recA) deficient, but also because they
lack an episome, which might contaminate plasmid pre-
parations. A reduced DNA input was used (kit suggests
100 pg pUC18 into 100 μl) to reduce sa mple variability
by minimizing the risk of double-transformants. A single
colony was picked and grown in 300 ml LB to an
OD600 of approximately 0.6 (approximately 13.5 hours)
and DNA extracted from half this volume using the
EndoFree PerfectPrep Maxi kit (catalogue number
7855475, 5 Prime, Gaithersburg, MD, USA; supplemen-
tal RNase A was added to the lysis buffer to increase
the concentration from 0.5 mg/ml to 1 mg/ml). Ampi-
cillin was maintained at 100 μg/ml in plates and liquid
cultures. DNA purity and concentration were examined
by nanodrop spectroscopy, gel electrophoresis and Pico-
Green quantification (the latter two in approximate
agreement). DNA sequencing was performed at
Sequensys (La Jolla, CA, USA; a division of Prognosys
Biosciences, Inc.) by the same method described below.
Assessment of variation in clonal DNA
The same pUC18 DNA that ha d been subject to Illu-
mina sequencing (procedure described above) was trans-
formed again (1 pg in 50 μl AG1 cells) and 192 sub-
clones were sequenced using the Sanger method for
which the primer PSU18-F (5’ -GGCGCTTTCTCA-
TAGCTCAC-3’ ; covering bases 1,049 t o 1,068) was
used. Sanger sequences were visualized using the Staden
package and 691 bases of quality-trimmed sequence
were identified as invariant in 191 clones (one clone fail-
ing to yield high-quality sequence along the full length).
After subcloning and sequencing a further 192 clones,
607 bases of quality-trimmed s equence were ident ified
in 186 clones (six clones failing to yield high-quality
sequence), providing strong evidence for invariance
across the region.
Preparation of mixed samples
To further assess the accuracy and precision of our
polymorphism detection, we prepared a sample by mix -
ing DNA from two individuals described in the main
dataset (M4 and M10C1) in an approximately 49:1 ratio.
At sites with fixed differences between these individuals,
this procedure was expected to yield a 2% apparent
minor allele frequency with the identity of the minor
allele corresponding to the M10C1’s sequence. For the
mixing procedure we handled each amplicon (A and B)
separately, attempting to add 490 ng of M4 DNA to 10
ng of M10C1 DNA. First, DNA concentrations for all
samples were estimated by nanodrop spectroscopy, and
second, M10C1 DNA was diluted and the dilution’s
DNA concentration was estimated. This procedure
allowed us to add DNA from both individual s in a 49:1
Goto et al. Genome Biology 2011, 12:R59
/>Page 13 of 16
ratio using a single pipette (a Gilsen P10), thereby redu-
cing pipetting error (which we estimate to be approxi-
mately 2 to 4%).
Sequencing and analysis
Sequencing
DNA sequencing was performed at Sequensys on an
Illumina GA IIx instrument (software version 1.8) with
multiplexing (12 samples per lane). All datasets gener-
ated within this study are accessible for immediate
download and analysis as described at [18] (the datasets
and workflows are also available d irectly from the Ama-
zon Cloud at [48]; Illumina reads may also be downl oad
from SRA at NCBI (project ID 67461, submission
DRA000390, study DRP000396, samples DRS000673 to
DRS000684, DRX0006 79 to DRX000701, DRR001058 to
DRR001100]).
Identification of heteroplasmic sites
A complete workflow for identification of heteroplasmic
sites i s shown in Figure 5 and can be accessed, viewed,
and edited at [18] (in addition, the exact settings of each
toolcanbeviewedatthatsite).ItusesBWAmapper
(version 0.5.6) [20] for initial mapping of reads, SAM-
tools [49] for processing of generated SAM datasets and
a c ollection of Galaxy tools for transformation and fil-
tering of data. A screencast (short narrated movie) at
[18] explains how the workflow can be used for the ana-
lysis of multiple datasets.
Allele-specific PCR
Allele-specific PCR amplification was performed with 5
μl of 100 diluted ampliconic DNA (from amplicon A;
forsite7,028)or2μl genomic DNA (for site 8,992).
Also added were 0.2 mM dNTPs, 0.5 μMforwardand
reverse primers (Integrated DNA Technologies, Inc.), 1
× buffer including 1.5 mM Mg
2+
, and 2 units of Choice
Taq (Denville Scientific Inc., Metuchen, New Jersey,
USA), all diluted to 50 μlwithPCR-gradewater
(TeknovaInc.,Hollister,CA,USA).Forwardprimers
were designed to amplify each allele specifically with the
3’ end nucleotide adjusted accordingly and the nucleo-
tide in the -1 position also changed to further destabilize
the duplex (after the strategy described in Figure 3 of
[50]; although note that 7,028 primers are designed for
the reverse strand). For each locus a common reverse
primer was included for amplification. Primer pairs were
checked by reverse ePCR [51] against human reference
genome assembly 37.1 to reduce the risk of amplifica-
tion from numts, with reported pairs showing no hits.
For site 7,028, thermal cycling conditions consisted of
94°C for 45 s, 60°C for 30 s, and 72°C for 3.5 minutes
for 30 cycle s. For site 8,992, the thermal profile was 94°
C for 45 s, 55°C for 30 s, and 72°C for 3 minutes also
for 30 cycles. For both sites t his was preceded by 94°C
for 3 minutes and followed by a terminal exten-sion
step at 72°C for 10 minutes.
Simulations
A FASTA file is read into a string object and empty
reads are created at random intervals across its length
(a python script performing this analysis is available as
Additional file 3). These reads consist of lists of indices
corresponding to positions in the sequence string allow-
ing the program to account for circularity by creating
some disc ontinuo us lists (s panning the origin). Next ,
sublists within a list object (coll oquially known as the
quasispecies 2D list) are populated using read indices to
recover bases from the sequence string. At a randomly
chosen index, corresponding to the heteroplasmic site,
this process is modified by passing bases through a dic-
tionary that substitutes A/G and T/C bases, but this is
done with a probability equal to the user-specified
minor allele frequency. At all positions the recove red
base is also passed through an error dictionary that sub-
stitutes A/C and T/G bases with a probability equal to
the user-specified err or rate (0.001 in this study).
Finally, the program examines the quasispecies list to
extract information on false positives and false negatives
using the user-specified frequency cu toff. At each index
in the quasispecies list (corresponding to a genome
position) the sum of each base type within the sublist is
assigned to a dictionary together with the length of the
sublist (read coverage). Next, the key and value corre-
sponding to the reference base is deleted and the maxi-
mum read count is extracted from the r emaining three
entries and divided by the coverage to yield the maxi-
mum variant frequency. If this exceeds the user-speci-
fied cutoff, a false positive variable is incremented. At
the heteroplasmic base the key corresponding to a
minor allele (for exa mple, a G if the reference is an A)
is first examined and a false negative variable is incre-
mented if this (divided by coverage) is less than the
threshold. Finally, t hese variablesandthegenomesize
(the length of the sequence string) are printed to a tab-
delimited text file.
Additional material
Additional file 1: Supplemental Figures S1, S2, S3, S4, and S5.
Additional file 2: Supplemental Table S1.
Additional file 3: FN-FP-simulation-script.py. A script for performing
simulation performed in Results and discussion.
Abbreviations
EST: expressed sequence tag; mtDNA: mitochondrial DNA; NGS: next-
generation sequencing; PCR: polymerase chain reaction; SNP: single-
nucleotide polymorphism; SRA: Sequence Read Archive.
Goto et al. Genome Biology 2011, 12:R59
/>Page 14 of 16
Acknowledgements
The authors are grateful to Jessica Beiler, MPH for coordinating sample
collection, to clinical nurses from Penn State College of Medicine’s Pediatric
Clinical Research Office for collecting the samples and to volunteers for
donating the samples; Bert Vogelstein and Nickolas Papadopoulos for
providing the data from their manuscript [15]; Francesca Chiaromonte for
statistical advice. Efforts of the Galaxy Team (Enis Afgan, Dannon Baker, Dan
Blankenberg, Ramkrishna Chakrabarty, Nate Coraor, Jeremy Goecks, Greg Von
Kuster, Ross Lazarus, Kanwei Li, Kelly Vincent) were instrumental for making
this work happen. This work was funded by an NIH grant GM07226405S2 to
KDM, a Beckman Foundation Young Investigator Award to AN, NSF grant
DBI 0543285 and NIH grant HG004909 to AN and JT, NIH grants HG005133
and HG005542 to JT and AN, as well as funds from Penn State University
and the Huck Institutes for the Life Sciences to AN and KDM and from
Emory University to JT. Additional funding is provided, in part, under a grant
with the Pennsylvania Department of Health using Tobacco Settlement
Funds. The Department specifically disclaims responsibility for any analyses,
interpretations or conclusions.
Author details
1
The Huck Institutes of Life Sciences and Department of Biology, Penn State
University, 305 Wartik Lab, University Park, PA 16802, USA.
2
The Huck
Institutes for the Life Sciences and Department of Biochemistry and
Molecular Biology, Penn State University, Wartik 505, University Park, PA
16802, USA.
3
Departments of Biology and Mathematics & Computer Science,
Emory University, 1510 Clifton Road NE, Room 2006, Atlanta, GA 30322, USA.
4
Department of Pediatrics, Penn State College of Medicine, 500 University
Drive, Hershey, PA 17033, USA.
Authors’ contributions
KDM, JT and AN conceived and supervised the project. HG and BD and
performed the experiments and some of the statistical analyses. EA and JT
implemented major components for Cloud deployment. AN and KDM wrote
the paper. All authors contributed to testing, data analysis, and the writing
of the manuscript. All authors reviewed and approved this manuscript.
Competing interests
The authors declare that they have no competing interests.
Received: 29 October 2010 Revised: 30 May 2011
Accepted: 23 June 2011 Published: 23 June 2011
References
1. Pakendorf B, Stoneking M: Mitochondrial DNA and human evolution.
Annu Rev Genomics Hum Genet 2005, 6:165-183.
2. Khrapko K, Coller HA, Andre PC, Li XC, Hanekamp JS, Thilly WG:
Mitochondrial mutational spectra in human cells and tissues. Proc Natl
Acad Sci USA 1997, 94:13798-13803.
3. Howell N: LHON and other optic nerve atrophies: the mitochondrial
connection. Dev Ophthalmol 2003, 37:94-108.
4. Lightowlers RN, Chinnery PF, Turnbull DM, Howell N: Mammalian
mitochondrial genetics: heredity, heteroplasmy and disease. Trends Genet
1997, 13:450-455.
5. Mitomap [].
6. Andreu AL, DiMauro S: Current classification of mitochondrial disorders. J
Neurol 2003, 250:1403-1406.
7. Taylor RW, Turnbull DM: Mitochondrial DNA mutations in human disease.
Nat Rev Genet 2005, 6:389-402.
8. Brandon M, Baldi P, Wallace DC: Mitochondrial mutations in cancer.
Oncogene 2006, 25:4647-4662.
9. Jacobs HT: Making mitochondrial mutants. Trends Genet 2001, 17:653-660.
10. Dimauro S, Tay S, Mancuso M: Mitochondrial encephalomyopathies:
diagnostic approach. Ann N Y Acad Sci 2004, 1011:217-231.
11. Cree LM, Samuels DC, Chinnery PF: The inheritance of pathogenic
mitochondrial DNA mutations. Biochim Biophys Acta 2009, 1792:1097-1102.
12. Cree LM, Samuels DC, de Sousa Lopes SC, Rajasimha HK, Wonnapinij P,
Mann JR, Dahl HH, Chinnery PF: A reduction of mitochondrial DNA
molecules during embryogenesis explains the rapid segregation of
genotypes. Nat Genet 2008, 40:249-254.
13. Cao L, Shitara H, Horii T, Nagao Y, Imai H, Abe K, Hara T, Hayashi J,
Yonekawa H: The mitochondrial bottleneck occurs without reduction of
mtDNA content in female mouse germ cells. Nat Genet 2007, 39:386-390.
14. Millar CD, Dodd A, Anderson J, Gibb GC, Ritchie PA, Baroni C,
Woodhams MD, Hendy MD, Lambert DM: Mutation and evolutionary rates
in adelie penguins from the antarctic. PLoS Genet 2008, 4:e1000209.
15. Howell N, Smejkal CB, Mackey DA, Chinnery PF, Turnbull DM, Herrnstadt C:
The pedigree rate of sequence divergence in the human mitochondrial
genome: there is a difference between phylogenetic and pedigree rates.
Am J Hum Genet 2003, 72:659-670.
16. He Y, Wu J, Dressman DC, Iacobuzio-Donahue C, Markowitz SD,
Velculescu VE, Diaz LA, Kinzler KW, Vogelstein B, Papadopoulos N:
Heteroplasmic mitochondrial DNA mutations in normal and tumour
cells. Nature 2010, 464:610-614.
17.
Li M, Schönberg A, Schaefer M, Schroeder R, Nasidze I, Stoneking M:
Detecting heteroplasmy from high-throughput sequencing of complete
human mitochondrial DNA genomes. Am J Hum Genet 2011, 87:237-249.
18. Galaxy page describing analysis of mitochondrial heteroplasmy [http://
usegalaxy.org/heteroplasmy].
19. Ewing B, Green P: Base-calling of automated sequencer traces using
phred. II. Error probabilities. Genome Res 1998, 8:186-194.
20. Li H, Durbin R: Fast and accurate short read alignment with Burrows-
Wheeler transform. Bioinformatics 2009, 25:1754-1760.
21. Dickins B, Nekrutenko A: High-resolution mapping of evolutionary
trajectories in a phage. Genome Biol Evol 2009, 1:294-307.
22. McKenna A, Hanna M, Banks E, Sivachenko A, Cibulskis K, Kernytsky A,
Garimella K, Altshuler D, Gabriel S, Daly M, DePristo MA: The Genome
Analysis Toolkit: a MapReduce framework for analyzing next-generation
DNA sequencing data. Genome Res 20:1297-1303.
23. 1000 Genomes Project Consortium: A map of human genome variation
from population-scale sequencing. Nature 2010, 467:1061-1073.
24. Bini C, Pappalardo G: mtDNA HVI length heteroplasmic profile in different
tissues of maternally related members. Forensic Sci Int 2005, 152:35-38.
25. Kirches E, Krause G, Warich-Kirches M, Weis S, Schneider T, Meyer-Puttlitz B,
Mawrin C, Dietzmann K: High frequency of mitochondrial DNA mutations
in glioblastoma multiforme identified by direct sequence comparison to
blood samples. Int J Cancer 2001, 93:534-538.
26. Kirches E, Michael M, Warich-Kirches M, Schneider T, Weis S, Krause G,
Mawrin C, Dietzmann K: Heterogeneous tissue distribution of a
mitochondrial DNA polymorphism in heteroplasmic subjects without
mitochondrial disorders. J Med Genet 2001, 38:312-317.
27. Irwin J, Saunier J, Niederstätter H, Strouss K, Sturk K, Diegoli T, Brandst‰
tter A, P arson W, Parsons T: Investigation of heteroplasmy in the
human mitochondrial DNA control region: a synthesis of observations
from more than 5000 global population samples. JMolEvol2009,
68:516-527.
28. Kircher M, Kelso J: High-throughput DNA sequencing - concepts and
limitations. Bioessays 2010, 32:524-536.
29. Sidransky D: Emerging molecular markers of cancer. Nat Rev Cancer 2002,
2:210-219.
30. Public Galaxy Instance [].
31. Blankenberg D, Taylor J, Schenck I, He J, Zhang Y, Ghent M,
Veeraraghavan
N, Albert I, Miller W, Makova KD, Hardison RC, Nekrutenko A:
A framework for collaborative analysis of ENCODE data: Making large-
scale analyses biologist-friendly. Genome Res 2007, 17:960-964.
32. Goecks J, Nekrutenko A, Taylor J: Galaxy: a comprehensive approach for
supporting accessible, reproducible, and transparent computational
research in the life sciences. Genome Biol 2010, 11:R86.
33. Galaxy Source Code [].
34. Barrick JE, Yu DS, Yoon SH, Jeong H, Oh TK, Schneider D, Lenski RE, Kim JF:
Genome evolution and adaptation in a long-term experiment with
Escherichia coli. Nature 2009, 461:1243-1247.
35. Barrick JE, Lenski RE: Genome-wide mutational diversity in an evolving
population of Escherichia coli. Cold Spring Harb Symp Quant Biol 2009,
74:119-129.
36. Menzo S, Vincenti D, Solmone M, Prosperi M, Bruselles A, Abbate I,
Rozera G, Capobianchi MR: Low-abundance drug resistance mutations:
extending the HIV paradigm to hepatitis B virus. J Infect Dis 2009,
200:1798-1799, author reply 1799-1800.
Goto et al. Genome Biology 2011, 12:R59
/>Page 15 of 16
37. O’Meara D, Wilbe K, Leitner T, Hejdeman B, Albert J, Lundeberg J:
Monitoring resistance to human immunodeficiency virus type 1
protease inhibitors by pyrosequencing. J Clin Microbiol 2001, 39:464-473.
38. Solmone M, Vincenti D, Prosperi MCF, Bruselles A, Ippolito G,
Capobianchi MR: Use of massively parallel ultradeep pyrosequencing to
characterize the genetic diversity of hepatitis B virus in drug-resistant
and drug-naive patients and to detect minor variants in reverse
transcriptase and hepatitis B S antigen. J Virol 2009, 83:1718-1726.
39. Van Tassell CP, Smith TP, Matukumalli LK, Taylor JF, Schnabel RD, Lawley CT,
Haudenschild CD, Moore SS, Warren WC, Sonstegard TS: SNP discovery
and allele frequency estimation by deep sequencing of reduced
representation libraries. Nat Methods 2008, 5:247-252.
40. Bansal V: A statistical method for the detection of variants from next-
generation resequencing of DNA pools. Bioinformatics 26:i318-324.
41. Bansal V, Harismendy O, Tewhey R, Murray SS, Schork NJ, Topol EJ,
Frazer KA: Accurate detection and genotyping of SNPs utilizing
population sequencing data. Genome Res 20:537-545.
42. Zagordi O, Geyrhofer L, Roth V, Beerenwinkel N: Deep sequencing of a
genetically heterogeneous sample: local haplotype reconstruction and
read error correction. J Comput Biol 2010, 17:417-428.
43. Galaxy Deployment on the Amazon Cloud [ />44. MyExperiment [], {AU query: please confirm
this URL is correct; it was not working when checked}.
45. GenomeSpace [].
46. Freeman B, Smith N, Curtis C, Huckett L, Mill J, Craig IW: DNA from buccal
swabs recruited by mail: evaluation of storage effects on long-term
stability and suitability for multiplex polymerase chain reaction
genotyping. Behav Genet 2003, 33:67-72.
47. Tanaka M, Hayakawa M, Ozawa T: Automated sequencing of
mitochondrial DNA. Methods Enzymol 1996, 264:407-421.
48. Heteroplasmy Data at Amazon Cloud S3 bucket [zonaws.
com/heteroplasmy/heteroplasmy_information.html].
49. Li H, Handsaker B, Wysoker A, Fennell T, Ruan J, Homer N, Marth G,
Abecasis G, Durbin R: The Sequence Alignment/Map format and
SAMtools. Bioinformatics 2009, 25:2078-2079.
50. Wangkumhang P, Chaichoompu K, Ngamphiw C, Ruangrit U, Chanprasert J,
Assawamakin A, Tongsima S: WASP: a Web-based Allele-Specific PCR
assay designing tool for detecting SNPs and mutations. BMC Genomics
2007, 8:275.
51. NCBI ePCR [ />doi:10.1186/gb-2011-12-6-r59
Cite this article as: Goto et al.: Dynamics of mitochondrial heteroplasmy
in three families investigated via a repeatable re-sequencing study.
Genome Biology 2011 12:R59.
Submit your next manuscript to BioMed Central
and take full advantage of:
• Convenient online submission
• Thorough peer review
• No space constraints or color figure charges
• Immediate publication on acceptance
• Inclusion in PubMed, CAS, Scopus and Google Scholar
• Research which is freely available for redistribution
Submit your manuscript at
www.biomedcentral.com/submit
Goto et al. Genome Biology 2011, 12:R59
/>Page 16 of 16