Báo cáo y học: "Ethics review: Strong ion difference in urine: new perspectives in acid–base assessment" docx
Bạn đang xem bản rút gọn của tài liệu. Xem và tải ngay bản đầy đủ của tài liệu tại đây (156.76 KB, 3 trang )
Page 1 of 3
(page number not for citation purposes)
SID = strong ion difference.
Available online />Abstract
The plasmatic strong ion difference (SID) is the difference between
positively and negatively charged strong ions. At pH 7.4, temperature
37°C and partial carbon dioxide tension 40 mmHg, the ideal value
of SID is 42 mEq/l. The buffer base is the sum of negatively
charged weak acids ([HCO
3
–
], [A
–
], [H
2
PO
4
–
]) and its normal
value is 42 mEq/l. According to the law of electroneutrality, the
amount of positive and negative charges must be equal, and
therefore the SID value is equal to the buffer base value. The
easiest assessment of metabolic acidosis/alkalosis relies on the
base excess calculation: buffer base
actual
– buffer base
ideal
=
SID
actual
– SID
ideal
. The SID approach allows one to appreciate the
relationship between acid–base and electrolyte equilibrium from a
unique perspective, and here we describe a comprehensive model
of this equilibrium. The extracellular volume is characterized by a
given SID, which is a function of baseline conditions, endogenous
and exogenous input (endogenous production and infusion), and
urinary output. Of note, volume modifications vary the concen-
tration of charges in the solution. An expansion of extracellular
volume leads to acidosis (SID decreases), whereas a contraction
of extracellular volume leads to alkalosis (SID increases). A
thorough understanding of acid–base equilibrium mandates
recognition of the importance of urinary SID.
Traditionally, the assessment of metabolic acidosis and
alkalosis relies on measurement of the base excess, which is
the difference between the ‘ideal’ buffer base [1] (i.e. the sum
of the negatively charged forms of weak acids, [A
–
] + [HCO
3
–
]
+ [H
2
PO
4
–
], at standard conditions (pH 7.4, temperature
37°C, partial carbon dioxide tension 40 mmHg) and the
‘actual’ buffer base [2]):
Base excess = buffer base
actual
– buffer base
ideal
(1)
During the past few years a novel approach based on
assessment of the strong ion difference (SID) has been
introduced to evaluate metabolic acidosis and alkalosis. For
simplicity, we limit our discussion to these two disturbances.
Please note that in the following discussion we will refer to
the amount of strong ion difference as SID (mEq), while we
will refer to the strong ion difference concentration as [SID]
(mEq/l).
By definition, strong ions are always dissociated in a solution.
In plasma, as well as in interstitial fluids, the sum of positively
charged ions (primarily Na
+
, K
+
, Ca
2+
and Mg
2+
) exceeds the
sum of the negatively charged strong ions (primarily Cl
–
and
lactate
–
) of about 42 mEq/l. This difference is called the SID,
and according to the Stewart model [3] its variation is one of
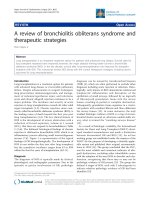
the determinants of acid–base status. Looking at Figure 1,
the connection between base excess and SID is apparent.
The buffer base and SID are equivalent. In fact, because the
ideal SID is equal to 42 mEq/l (as is the normal buffer base),
it follows that
Base excess = SID
actual
– SID
ideal
=
buffer base
actual
– buffer base
ideal
(2)
Because computation of the actual SID is rather complicated,
requiring the determination of all of the strong ion
concentrations, we believe that the base excess approach
may be easier, more rapid and adequate for clinical purposes.
Indeed, the frequent debate involving the comparison of the
‘SID approach’ with the ‘base excess approach’ to assess-
ment of metabolic acidosis [4,5] appears futile because their
physiological meanings, as well as their variations, are
identical. In other words, the two approaches look at the
same thing from different points of view.
The picture is different when one considers the
‘understanding’ of acid–base and electrolyte equilibria, which
everyone has studied in separate chapters of the textbooks.
The great merit of the Stewart approach is that it considers
Commentary
Strong ion difference in urine: new perspectives in acid–base
assessment
Luciano Gattinoni
1
, Eleonora Carlesso
2
, Paolo Cadringher
2
and Pietro Caironi
2
1
Dipartimento di Anestesia, Rianimazione, e Terapia del Dolore, Fondazione IRCCS – ‘Ospedale Maggiore Policlinico, Mangiagalli, Regina Elena’ di
Milano, Istituto di Anestesiologia e Rianimazione, Università degli Studi di Milano, Milano, Italy
2
Istituto di Anestesiologia e Rianimazione, Università degli Studi di Milano, Milano, Italy
Corresponding author: Luciano Gattinoni,
Published: 7 April 2006 Critical Care 2006, 10:137 (doi:10.1186/cc4890)
This article is online at />© 2006 BioMed Central Ltd
Page 2 of 3
(page number not for citation purposes)
Critical Care Vol 10 No 2 Gattinoni et al.
electrolytes and acid–base status in a common framework.
Here, we would like to propose a comprehensive model that
may explain, at least qualitatively, many of the findings
observed in clinical practice and in the literature.
The SID reflects the difference in electrical charges of the
strong ions in the volume of the extracellular compartment
(V). At time 0, it will be equal to V(0) × [SID(0)]. For
example, if at time 0 the SID is normal (i.e. 42 mEq/l) then
the net amount of electrical charge in the extracellular fluid
(15 l) will be 630 mEq. During a given period of time there
may be an addition of volume to the system (e.g. infusion of a
solution) with its own SID (SID
infusion
). Consequently, a net
amount of charge equal to V
infusion
× [SID
infusion
] will be
added to the system. Similarly, the urinary system will
excrete a volume of urine (V
urine
) with its own SID (SID
urine
).
The last variable that must be taken into account is
endogenous production of SID (sulphates, phosphates,
lactate and ketoacids, among other components). It follows
that the SID at a given time ‘t’ may be derived from a series
of equations, which may appear to be complicated in their
expression but simple in their meaning. Eqn 3 (below)
indicates that, in a system, the net amount of electrical
charges due to the strong ions is equal to the net electrical
charge of the system at time zero plus the net electrical
charge added as a result of metabolism plus the net
electrical charge added with volume infusion minus the net
electrical charge extracted via urine.
[SID(t)] × V(t) =
V(0) × [SID(0)] + ∫
0
t
EPR(t)dt + ∫
0
t
IR(t) × (3)
[SID
infusion
(t)]dt – ∫
0
t
UPR(t) × [SID
urine
(t)]dt
where EPR(t) is the ‘endogenous production rate’ of SID
(mEq/min), IR(t) is the volume infusion rate and UPR(t) is the
urine production rate. At a given time ‘t’, the net fluid volume
of the extracellular compartment is equal to the initial volume
of the system plus the volume added with infusion minus the
volume extracted in the form of urine.
V(t) = V(0) + ∫
0
t
IR(t)dt – ∫
0
t
UR(t)dt (4)
Because what matters in terms of acid–base status is the
concentration, rather than the net amount of electrical charge,
the SID at a given time ‘t’ may be expressed from the above
equations as shown in equation 5 at the foot of the page:
see foot of page (5)
It is important to remember that an increase in SID will lead
the system to become more basic whereas a decrease in SID
will lead the system to become more acidic. In general, Eqn 5
indicates that metabolic acidosis or alkalosis may occur either
by changing the net electrical charge at constant extracellular
volume or by changing the extracellular volume at constant
electrical charge.
Looking at Eqn 5, we may make several comments. To
maintain the metabolic acid–base status of a system (i.e. the
baseline SID), two conditions must be satisfied: the input
quantity of SID should equal the output quantity of SID; and
the distribution volume of SID should remain constant. To the
best of our knowledge, the only studies in which the strong
ion balance (input and output) was investigated were
conducted in cows [6-8]; different amounts of SID in the diet
caused corresponding changes in urinary SID. Unfortunately,
no such investigation has been conducted in critically ill
patients. As discussed above, SID has been studied in
comparison with base excess but without any physiological
rationale [9]. The SID approach has been also proposed to
explain metabolic acidosis during saline infusion (SID input)
[10], but only a few papers have tackled and discussed the
problem of urinary SID (SID output) [11-13]. What we lack is
the entire picture of the system; unfortunately, this requires
frequent assessment of urine electrolytes.
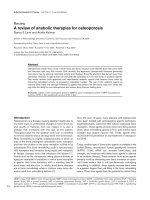
Figure 1
Gamblegram. The figure shows gamblegrams during ideal conditions
and during acidosis. In ideal conditions the difference between
positively and negatively charged strong ions is equal to 42 mEq/l (the
strong ion difference [SID]) and, according to the law of electro-
neutrality, is equivalent to the buffer base (BB; i.e. the sum of [HCO
3
–
],
[A
–
] and [H
2
PO
4
–
], where A
–
are the weak acids in dissociated form,
mainly albumin). During acidosis, SID decreases but the law of electro-
neutrality is still satisfied. It follows that base excess =
BB
actual
– BB
ideal
= SID
acidosis
– SID
ideal
.
V(0) × [SID(0)] + ∫
0
t
EPR(t)dt + ∫
0
t
IR(t) × [SID
infusion
(t)]dt – ∫
0
t
UR(t) × [SID
urine
(t)]dt
[SID(t)] = (5)
V(t)
Page 3 of 3
(page number not for citation purposes)
Some clinical findings may be viewed from the perspective of
the general framework of Eqn 5. It is well known that rapid
infusion of saline induces metabolic acidosis. This has been
attributed to changes in SID due to hyperchloraemia [10]. By
looking at Eqn 3 we derive a different point of view. Because
the SID of saline is equal to 0, it follows that, if the urinary
output of electrical charge and metabolic production remain
constant, the net difference of electrical charges in the
system (i.e. the numerator in Eqn 5) does not change. What
causes the acidosis is the expansion of the extracellular
volume (volume input greater than volume output), which
leads to decreased concentration of the net amount of
electrical charge (i.e. the SID).
Unfortunately, it is not easy to consider the urinary SID. In
fact, although 40–42 mEq/l of plasmatic negative charge may
be derived from the dissociated weak acids ([A
–
], [HCO
3
–
]
and [H
2
PO
4
–
]), the amount of weak acids is far less in urine
and, overall, the range of urinary pH is an order of magnitude
greater than that in plasma. Once again, the problem is
simpler when one considers the entire picture. In fact, as far
as the plasmatic acid–base equilibrium is concerned, we
must consider only the components of urinary [SID] that may
affect the plasmatic [SID] (i.e. [K
+
], [Na
+
] and [Cl
–
]). In fact, in
urine
[Na
+
] + [K
+
] + [Un
+
] = [Cl
–
] + [Un
–
] (6)
where Un
+
and Un
–
are the positive and negative
unmeasured ions. It follows that
[Na
+
] + [K
+
] – [Cl
–
] = [Un
–
] – [Un
+
] (7)
Quantitatively, the most important anion in urine is SO
4
2–
,
which is derived from the metabolism of sulphur amino acids,
whereas the most important cation is NH
4
+
. In normal
conditions, the sum of urinary [Na
+
] + [K
+
] – [Cl
–
] amounts to
42 mEq/l [14]. It follows that the concentration of
unmeasured anions exceeds the concentration of
unmeasured cations of 42 mEq/l. When a strong ion such as
lactate is added to the plasma, the plasmatic SID will
decrease. Consequently, the urinary system will react by
increasing its excretion of chloride, thereby decreasing the
plasma chloride concentration (while [Na
+
] and [K
+
] must be
maintained within normal ranges). The increased excretion of
chloride will decrease the urinary SID. Therefore, the
difference between [Un
–
] and [Un
+
] should decrease (Eqn 7).
This is accomplished by increasing the excretion rate of
NH
4
+
, which is a way to augment elimination of Cl
–
without
Na
+
[11,15].
Indeed, the effects of any volume infusion or other
interventions cannot be understood if the urinary SID and
volume are not taken into account. A merit of the report by
Moviat and colleagues [13] is that, for the first time in critical
care, attention is focused on the urinary system, which is the
main regulator of SID. The authors found that the increase in
urinary SID (indirectly induced by blocking carbonic
anhydrase) was the key driver for correction of metabolic
alkalosis. The message is important – urinary SID should be a
key component of global acid–base assessment. We believe
that urinary electrolyte monitoring may open a new per-
spective of research in critical care. Acid–base equilibrium,
one of the oldest research areas in medicine, is still an open
field for new discoveries and approaches.
Competing interests
The authors declare that they have no competing interests.
References
1. Singer RB, Hastings AB: An improved clinical method for the
estimation of disturbances of the acid-base balance of human
blood. Medicine 1948, 27:223-242.
2. Siggaard-Andersen O: The Acid-base Status of the Blood.
Copenhagen: Munksgaard; 1974.
3. Stewart PA: How to Understand Acid-base. A Quantitative Acid-
base Primer for Biology and Medicine. New York: Elsevier; 1981.
4. Siggaard-Andersen O, Fogh-Andersen N: Base excess or buffer
base (strong ion difference) as measure of a non-respiratory
acid-base disturbance. Acta Anaesthesiol Scand Suppl 1995,
107:123-128.
5. Fencl V, Leith DE: Stewart’s quantitative acid-base chemistry:
applications in biology and medicine. Respir Physiol 1993, 91:
1-16.
6. Roche JR, Dalley D, Moate P, Grainger C, Rath M, O’Mara F:
Dietary cation-anion difference and the health and production
of pasture-fed dairy cows 2. Nonlactating periparturient cows.
J Dairy Sci 2003, 86:979-987.
7. Roche JR, Dalley D, Moate P, Grainger C, Rath M, O’Mara F:
Dietary cation-anion difference and the health and production
of pasture-fed dairy cows. 1. Dairy cows in early lactation. J
Dairy Sci 2003, 86:970-978.
8. Vagnoni DB, Oetzel GR: Effects of dietary cation-anion differ-
ence on the acid-base status of dry cows. J Dairy Sci 1998,
81:1643-1652.
9. Cusack RJ, Rhodes A, Lochhead P, Jordan B, Perry S, Ball JA,
Grounds RM, Bennett ED: The strong ion gap does not have
prognostic value in critically ill patients in a mixed
medical/surgical adult ICU. Intensive Care Med 2002, 28:864-
869.
10. Scheingraber S, Rehm M, Sehmisch C, Finsterer U: Rapid saline
infusion produces hyperchloremic acidosis in patients under-
going gynecologic surgery. Anesthesiology 1999, 90:1265-
1270.
11. Ring T, Frische S, Nielsen S: Clinical review: Renal tubular aci-
dosis: a physicochemical approach. Crit Care 2005, 9:573-
580.
12. Corey HE, Vallo A, Rodriguez-Soriano J: An analysis of renal
tubular acidosis by the Stewart method. Pediatr Nephrol 2006,
21:206-211.
13. Moviat M, Pickkers P, van der Voort PH, van der Hoeven JG:
Acetazolamide-mediated decrease in strong ion difference
accounts for the correction of metabolic alkalosis in critically
ill patients. Crit Care 2006, 10:R14.
14. Batlle DC, Hizon M, Cohen E, Gutterman C, Gupta R: The use of
the urinary anion gap in the diagnosis of hyperchloremic
metabolic acidosis. N Engl J Med 1988, 318:594-599.
15. Kellum JA: Determinants of blood pH in health and disease.
Crit Care 2000, 4:6-14.
Available online />