Bóa cáo y học: "Arteriolar vasoconstrictive response: comparing the effects of arginine vasopressin and norepinephrine" doc
Bạn đang xem bản rút gọn của tài liệu. Xem và tải ngay bản đầy đủ của tài liệu tại đây (223.75 KB, 7 trang )
Open Access
Available online />Page 1 of 7
(page number not for citation purposes)
Vol 10 No 3
Research
Arteriolar vasoconstrictive response: comparing the effects of
arginine vasopressin and norepinephrine
Barbara E Friesenecker
1
, Amy G Tsai
2
, Judith Martini
2
, Hanno Ulmer
3
, Volker Wenzel
4
,
Walter R Hasibeder
5
, Marcos Intaglietta
2
and Martin W Dünser
6
1
Division of General and Surgical Intensive Care Medicine, Department of Anesthesiology and Critical Care Medicine, Innsbruck Medical University,
Innsbruck, Austria
2
Department of Bioengineering, University of California, San Diego, CA, USA
3
Institute of Biostatistics and Documentation, Medical University Innsbruck, Innsbruck, Austria
4
Division of Anesthesiology, Department of Anesthesiology and Critical Care Medicine, Innsbruck Medical University, Innsbruck, Austria
5
Department of Anesthesiology and Critical Care Medicine, Krankenhaus der Barmherzigen Schwestern, Ried im Innkreis, Austria
6
Department of Intensive Care Medicine, University Hospital of Bern, Bern, Switzerland
Corresponding author: Barbara E Friesenecker,
Received: 10 Mar 2006 Revisions requested: 31 Mar 2006 Revisions received: 11 Apr 2006 Accepted: 19 Apr 2006 Published: 12 May 2006
Critical Care 2006, 10:R75 (doi:10.1186/cc4922)
This article is online at: />© 2006 Friesenecker et al.; licensee BioMed Central Ltd.
This is an open access article distributed under the terms of the Creative Commons Attribution License ( />),
which permits unrestricted use, distribution, and reproduction in any medium, provided the original work is properly cited.
Abstract
Introduction This study was designed to examine differences in
the arteriolar vasoconstrictive response between arginine
vasopressin (AVP) and norepinephrine (NE) on the
microcirculatory level in the hamster window chamber model in
unanesthetized, normotonic hamsters using intravital
microscopy. It is known from patients with advanced
vasodilatory shock that AVP exerts strong additional
vasoconstriction when incremental dosage increases of NE
have no further effect on mean arterial blood pressure (MAP).
Methods In a prospective controlled experimental study, eleven
awake, male golden Syrian hamsters were instrumented with a
viewing window inserted into the dorsal skinfold. NE (2 μg/kg/
minute) and AVP (0.0001 IU/kg/minute, equivalent to 4 IU/h in
a 70 kg patient) were continuously infused to achieve a similar
increase in MAP. According to their position within the arteriolar
network, arterioles were grouped into five types: A0 (branch off
small artery) to A4 (branch off A3 arteriole).
Results Reduction of arteriolar diameter (NE, -31 ± 12% versus
AVP, -49 ± 7%; p = 0.002), cross sectional area (NE, -49 ±
17% versus AVP, -73 ± 7%; p = 0.002), and arteriolar blood
flow (NE, -62 ± 13% versus AVP, -80 ± 6%; p = 0.004) in A0
arterioles was significantly more pronounced in AVP animals.
There was no difference in red blood cell velocities in A0
arterioles between groups. The reduction of diameter, cross
sectional area, red blood cell velocity, and arteriolar blood flow
in A1 to A4 arterioles was comparable in AVP and NE animals.
Conclusion Within the microvascular network, AVP exerted
significantly stronger vasoconstriction on large A0 arterioles
than NE under physiological conditions. This observation may
partly explain why AVP is such a potent vasopressor hormone
and can increase systemic vascular resistance even in advanced
vasodilatory shock unresponsive to increases in standard
catecholamine therapy.
Introduction
Since its first detection in 1895 by Schaefer and Oliver [1],
arginine vasopressin (AVP) has been known for its potent
vasoconstrictive effects. During the past decade, successful
clinical application of AVP has been reported in cardiac arrest
[2] and advanced vasodilatory shock [3]. In all of these dis-
eases, AVP can exert strong vasoconstriction and significantly
increase perfusion pressure even in shock states when stand-
ard catecholamine therapy could not control vascular tone.
These clinical observations unequivocally support the physio-
logical finding that, on a molar basis, AVP is a several fold
stronger vasopressor hormone than angiotensin II, epine-
phrine, or norepinephrine (NE) [4], although its mechanisms of
action are unclear.
Stimulation of V
1a
-receptors located on vascular smooth mus-
cle of arterioles mediates contraction and thereby causes
vasoconstriction [5]. Nonetheless, although repeatedly proven
AVP = arginine vasopressin; MAP = mean arterial blood pressure; NE = norepinephrine.
Critical Care Vol 10 No 3 Friesenecker et al.
Page 2 of 7
(page number not for citation purposes)
in the clinical setting, it remains unknown why AVP can still
cause a significant increase in vascular tone when stimulation
of α-adrenergic receptors fails to increase perfusion pressure.
Several hypotheses have suggested that additional pharmaco-
logical effects of AVP, such as inhibition of activated K
ATP
-
channels or endothelial nitric oxide synthase, and synergistic
effects between catecholamines and AVP may explain AVP's
potent vasoconstrictive effects [6]. However, the mechanism
of nitric oxide inhibition by AVP, for example, has recently been
proven to play only a minor or irrelevant role in the clinical set-
ting [7]. This experimental study was designed to evaluate dif-
ferences in the arteriolar vasoconstrictive response between
AVP and NE in a physiological hamster model [8]. Our hypo-
thesis was that there were no differences in the arteriolar vaso-
constrictive response between AVP and NE.
Materials and methods
Animal model and preparation
The experimental protocol was approved by the Austrian Min-
istry of Science and Research. While the animals were under
intraperitoneal pentobarbital anesthesia (50 mg/kg body
weight), a viewing window was inserted into the dorsal skin-
fold of 11 male golden Syrian hamsters (weight 60 to 85 g;
Charles River Laboratories, Sulzfeld, Germany) [9]. Briefly, the
dorsal skinfold consisting of two layers of skin and corre-
sponding muscle tissue was placed between two titanium
frames. A 15 mm circular portion of the skin, including two skin
muscles with the underlying skin, remained in place. The tissue
was covered with saline, and a cover glass was held by one
side of the titanium frame, yielding a stable preparation that
allows repeated microscopic observations over several days.
The area of microscopic observation is originally located just
behind the large front vessels that feed and drain the chamber
network. A modified preparation technique was used where
the tissue studied is nearer to the animal's head to allow micro-
scopic observation of the large feeding arteriole (A0) of the
chamber network [10]. Two days after chamber implantation,
polyethylene-50 catheters were inserted into the internal
carotid artery and external jugular vein for evaluation of sys-
temic parameters (mean arterial blood pressure (MAP), heart
rate) and infusion of study drugs.
Inclusion criteria
Animals were eligible for inclusion into the study protocol if
their systemic parameters were within normal range, namely
heart rate >340 beats per minute and MAP >80 mmHg, and
microscopic examination of the tissue in the chamber
observed under ×600 magnification did not reveal signs of
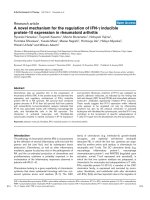
edema or bleeding (Figure 1).
Systemic parameters
MAP was tracked periodically during the experiment through
the arterial catheter, and heart rate was determined from the
pressure trace (Recom pressure transducer system, model
13-6615-50, Gould Instrument Systems, Ohio, USA).
Arteriolar vasoconstrictive response
Arteriolar diameters (D) were measured using the video image
shearing technique (model 908, Vista Electronics, San Diego,
CA, USA). Cross-sectional areas of arterioles were calculated
according to standard mathematical formulas. The measured
centreline velocity (V) was corrected according to vessel size
to obtain the mean velocity of red blood cells. Arteriolar blood
flow (Q) was calculated according to the formula [11]:
Q = V × π × (D
2
× 0.001
2
/4)
Depending on their position within the microvascular network,
arterioles were grouped into five categories: A0 arteriole,
branch off small artery; A1-arteriole, branch off A0; A2 arteri-
ole, branch off A1; A3 arteriole, branch off A2; A4 arteriole,
branch off A3 (Figure 1).
Experimental setup
An unanesthetized animal was placed in a restraining tube that
was stabilized by affixing the tube and the chamber to a Plex-
iglas plate. The animal had free access to wet feed during the
entire experimental period. The Plexiglas stage that held the
animal was then placed on an intravital microscope (Mikron
Instruments, San Diego, CA, USA) equipped with a F0-150
halogen fiberoptic illuminator (CHIU Technical, Kings Park,
NY, USA) and two infinity-corrected objectives (Zeiss Achrop-
lan ×20/0.5 W, ×40/0.75 W). A 420 nm blue filter was used
for contrast enhancement of the transilluminated image. The
image was projected onto a charge-coupled device camera
(model COHU FK 6990 IQ-S, Pieper; Düsseldorf, Germany)
and viewed on a monitor (model PVM-1454QM, Sony). The
animal was allowed a 30 minute adjustment period to the tube
environment before baseline measurements. Microvascular
fields of study were chosen by their visual clarity.
Study protocol and drug dosage
Study animals were randomly assigned to a NE and an AVP
group. Animals in the AVP group received a continuous infu-
sion of AVP at a clinically relevant dosage of 0.0001 IU/kg/
minute (corresponding to 4 IU/h in a 70 kg critically ill patient
[3,12]) throughout the time of the experiment.
In a small pilot study, this dosage was found to attain a con-
sistent and stable level of vasoconstriction. In contrast, half of
this AVP dosage (0.00005 IU/kg/minute) did not cause a rel-
evant change in mean arterial pressure. Infusion of ten times
the higher AVP dosage (0.001 IU/kg/minute) resulted in a
comparable increase in mean arterial pressure, but caused a
microcirculatory 'low flow state', and even stopped arteriolar
blood flow in one pilot animal. According to the chosen AVP
dosage of 0.0001 IU/kg/minute, the NE dosage of 2 μg/kg/
minute was determined to achieve a similar increase in MAP.
In all animals, the infusion volume was calculated not to
exceed 10% of blood volume in each individual animal. After
Available online />Page 3 of 7
(page number not for citation purposes)
taking control measurements, the study drug was infused over
30 minutes before systemic and microvascular measurements
were performed during continuous study drug infusion.
Statistical analysis
The study endpoint was to evaluate differences in the arteriolar
vasoconstrictive response between NE- and AVP-treated
animals.
Shapiro Wilk's and Kolmogorov Smirnov tests were used to
check for normal distribution of data. Because normality
assumption was not fulfilled in main study variables, non-para-
metric tests (Mann Whitney U rank sum test) were applied for
comparisons between study groups at baseline and within
repeated measurements. The same tests were used to detect
significant changes during drug infusion when compared to
baseline within groups. For comparison within the five arteri-
olar subgroups, Bonferroni corrections for multiple compari-
sons were applied, and the significance level was set at 0.01.
Study results are given as mean values ± standard deviations,
if not indicated otherwise.
Results
Eleven animals met the study inclusion criteria and were
entered into the randomization process (NE, n = 5; AVP, n =
6). All animals completed the study protocol without visible
signs of discomfort. Animals were observed resting and peri-
odically eating throughout the experiment.
No statistically significant differences were observed in sys-
temic or microvascular variables measured at study entry
between groups.
Systemic parameters
In pilot studies NE dosage was chosen to match AVP induced
MAP changes. During the experiment, infusion of NE and AVP
caused both a significant increase in MAP and a significant
decrease in heart rate (Table 1). These changes were not dif-
ferent between study groups (heart rate, p = 0.221; MAP, p =
0.847).
Microvascular parameters
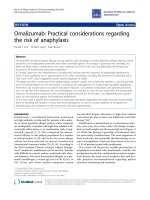
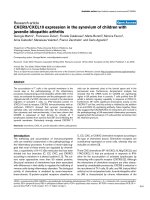
In A0 arterioles, the reduction of diameter and cross sectional
area was more pronounced in AVP animals when compared to
NE-treated animals (Table 2 and Figure 2). Accordingly, arte-
riolar flow was significantly more reduced in AVP animals than
in the NE group. There were no differences in red blood cell
velocity in A0 arterioles between study groups.
In A1 to A4 arterioles, there were no differences in arteriolar
diameter or cross-sectional area between AVP and NE ani-
mals. Neither red blood cell velocity nor arteriolar blood flow
were significantly different between the two study groups.
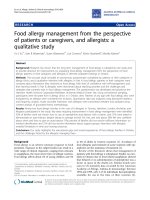
Figure 1
Hamster window chamber modelHamster window chamber model. In-vivo preparation of the hamster
window chamber model with visible A0 arteriole and V0 vein. Other
vessels (A1, branch off A0; A2, branch off A1; A3, branch off A2; A4,
branch off A3), capillaries (defined as vessels with single red cell tran-
sit), and venules can only be classified under the intravital microscope.
Figure 2
Cross-sectional arteriolar areasCross-sectional arteriolar areas. Differences in cross-sectional area
(μm
2
) of A0, A1, A2, A3 and A4 arterioles between norepinephrine
(NE) and arginine vasopressin (AVP) treated animals (drawn true to
scale). The asterisk indicates a significant difference between groups
(p < 0.002).
Critical Care Vol 10 No 3 Friesenecker et al.
Page 4 of 7
(page number not for citation purposes)
Discussion
In this animal experiment, the reduction of arteriolar diameter,
cross-sectional area, and arteriolar blood flow was signifi-
cantly different between NE and AVP animals under physiolog-
ical conditions. AVP-treated animals exhibited a significantly
greater vasoconstrictive response in large A0 arterioles when
compared to NE animals, while there was no difference in A1
to A4 arterioles between study groups.
The greater decrease in arteriolar diameter and cross-sec-
tional area of A0 arterioles during AVP infusion when com-
pared to NE therapy clearly indicates that AVP exerted
significantly stronger vasoconstrictive effects on large arteri-
oles, which ultimately control blood flow to the subsequent
vessels of the microcirculatory system. Although receptors
have not been assessed quantitatively or qualitatively in this
experiment, it may be hypothesized that relatively more V
1a
-
than α-receptors are located on vascular smooth muscle of A0
arterioles. Nonetheless, it cannot be excluded that specific
receptor-independent AVP effects on vascular tone, such as
inhibition of K
ATP
-potassium channels [13], contributed to
strong vasoconstriction induced by AVP in A0 arterioles as
well.
This is the first study identifying a significant difference in the
arteriolar vasoconstrictive response between AVP and an
adrenergic vasopressor agent on the microcirculatory level
under primarily physiological conditions. To the best of our
knowledge, it is also the first experiment to observe that AVP,
in comparison to NE, exerts significantly stronger vasocon-
striction in large arterioles. So far, only one study has examined
the arteriolar vasoconstriction pattern after injection of AVP.
Marshall and colleagues [14] reported strong AVP-mediated
vasoconstrictive effects on proximal arterioles of the spinotra-
pezius muscle of the rat. Important differences to our study
protocol were that arterioles were grouped only in a proximal
(>13 μm) and a distal (<13 μm) group, and there was no com-
parison with an adrenergic vasopressor agent. Additionally,
study animals received AVP as a bolus injection, and were
hypoxic and anesthetized; all factors that may have influenced
or altered AVP-mediated vasoconstriction. Interestingly, the
same authors observed that vasoconstriction exerted by NE
during hypoxia was most pronounced in arteriolar vessels
measuring 13 to 50 μm in diameter [15], corresponding to the
more recent definition of A2 to A4 arterioles, which is in
accordance with the results of our experiment. In an anesthe-
tized rat model, Baker and colleagues [16] similarly observed
that large arterioles (approximately 130 to 110 μm) exhibited
significantly stronger constriction when compared to smaller
arterioles (approximately 40 μm) in the cremaster muscle after
topical application of AVP.
It is well known that changes in arteriolar tone mainly contrib-
ute to the regulation of systemic vascular resistance and thus
arterial blood pressure [17]. While earlier studies have
focused on the behavior of A2 to A4 arterioles, it has been
shown in hypertensive rats that large arterioles and small arter-
ies, and not small arterioles, are primarily responsible for
changes in systemic vascular resistance [18,19]. In a dorsal
skin flap preparation in rats, le Noble and colleagues [20] con-
cluded that, in the established phase of spontaneous hyper-
tension, a decreased diameter of large arterioles was the
major mechanism underlying the increase in vascular resist-
ance. Similarly, Grega and colleagues [21] suggested that
small arteries and larger arterioles may contribute more than
smaller arterioles to increases in systemic vascular resistance
produced by local infusion of vasopressor agents. Additionally,
in conscious hamsters with hemorrhagic shock, vasoconstric-
tion was found to be strongest in A0 arterioles, while smaller
arterioles exhibited only small diameter changes or, under
some conditions, even vasodilation [10].
These observations in physiological and pathophysiological
models match the findings of the present study where AVP
constricts larger arterioles to a significantly greater extent than
NE and may explain why AVP is able to induce a more signifi-
cant increase in systemic vascular resistance than other
adrenergic vasopressor hormones [4]. Moreover, these results
may partly elucidate the finding that AVP given as a continuous
infusion can increase arterial pressure even in advanced
Table 1
Heart rate and mean arterial pressure in norepinephrine and arginine vasopressin treated animals
Baseline Drug infusion p value
a
Heart rate (bpm)
NE
b
449 ± 25 399 ± 44 0.847
AVP
b
452 ± 36 403 ± 44
MAP (mmHg)
NE
b
103 ± 8 129 ± 7 0.221
AVP
b
98 ± 10 121 ± 8
Data are given as mean values ± standard deviation.
a
P value for differences between groups.
b
Significant difference between baseline and drug
infusion. AVP, arginine vasopressin; bpm, beats per minute; MAP, mean arterial blood pressure; NE, norepinephrine.
Available online />Page 5 of 7
(page number not for citation purposes)
Table 2
Arteriolar diameter, cross-sectional area, blood velocity, and arteriolar flow in norepinephrine and arginine vasopressin animals
Arteriol type Parameter Drug Baseline Drug infusion Change (%) p value
A0 Arteriolar D (μm) NE
a
127 ± 27 86 ± 16 31 ± 12 0.002
b
AVP
a
129 ± 7 66 ± 12 49 ± 7
Arteriolar CSA (μm
2
)NE
a
13,083 ± 4,908 5,954 ± 2,150 49 ± 17 0.002
b
AVP
a
13,100 ± 1,462 3,547 ± 1,173 73 ± 7
RBC velocity (mm/s) NE
a
13.5 ± 2.2 10.6 ± 2.3 22 ± 9 0.232
AVP
a
14.9 ± 0.9 11.2 ± 1.1 25 ± 6
Arteriolar BF (10
-2
×
mm × μm
2
/s)
NE
a
18.4 ± 8.1 6.6 ± 3.2 62 ± 13 0.004
b
AVP
a
19.6 ± 2.6 3.9 ± 1.3 80 ± 6
A1 Arteriolar D (μm) NE
a
47 ± 11 33 ± 8 28 ± 12 0.461
AVP
a
49 ± 13 66 ± 12 30 ± 12
Arteriolar CSA (μm
2
)NE
a
1,785 ± 878 922 ± 444 47 ± 16 0.461
AVP
a
2,000 ± 1,080 987 ± 574 50 ± 17
RBC velocity (mm/s) NE
a
3.7 ± 0.7 3 ± 0.4 19 ± 9 0.236
AVP
a
3.9 ± 1 2.9 ± 1.2 27 ± 17
Arteriolar BF (10
-3
×
mm × μm
2
/s)
NE
a
6.9 ± 4.1 2.8 ± 1.5 57 ± 15 0.096
AVP
a
8.2 ± 6.2 2.9 ± 2.4 63 ± 14
A2 Arteriolar D (μm) NE
a
28 ± 12 20 ± 9 29 ± 12 0.156
AVP
a
25 ± 8 16 ± 5 34 ± 14
Arteriolar CSA (μm
2
)NE
a
748 ± 689 390 ± 332 48 ± 16 0.156
AVP
a
522 ± 345 226 ± 141 55 ± 18
RBC velocity (mm/s) NE
a
3 ± 0.7 2.3 ± 0.4 20 ± 14 0.845
AVP
a
2.8 ± 0.4 2.2 ± 0.4 21 ± 15
Arteriolar BF (10
-3
×
mm × μm
2
/s)
NE
a
2.6 ± 3.3 0.9 ± 1.0 59 ± 13 0.212
AVP
a
1.5 ± 1.2 0.5 ± 0.4 64 ± 19
A3 Arteriolar D (μm) NE
a
15 ± 6 10 ± 5 34 ± 11 0.110
AVP
a
16 ± 5 9 ± 3 43 ± 12
Arteriolar CSA (μm
2
)NE
a
193 ± 180 86 ± 96 56 ± 14 0.110
AVP
a
86 ± 96 74 ± 51 86 ± 13
RBC velocity (mm/s) NE
a
2.3 ± 0.4 1.8 ± 0.4 21 ± 16 0.146
AVP
a
2.4 ± 0.4 1.7 ± 0.6 29 ± 16
Arteriolar BF (10
-4
×
mm × μm
2
/s)
NE
a
4.7 ± 4.9 1.6 ± 1.6 65 ± 12 0.013
AVP
a
5.6 ± 4.9 1.3 ± 1.3 76 ± 11
A4 Arteriolar D (μm) NE
a
9 ± 3 6 ± 1 32 ± 8 0.206
AVP
a
9 ± 2 7 ± 2 26 ± 12
Arteriolar CSA (μm
2
)NE
a
70 ± 62 28 ± 14 53 ± 10 0.206
AVP
a
74 ± 41 39 ± 20 44 ± 18
Critical Care Vol 10 No 3 Friesenecker et al.
Page 6 of 7
(page number not for citation purposes)
vasodilatory shock states unresponsive to standard hemody-
namic therapy, including infusion of NE [3,12,22].
Corresponding to the pronounced reduction of arteriolar diam-
eter and cross-sectional area, blood flow was significantly
more reduced in A0 arterioles in AVP-treated animals then in
the NE-group. Interestingly, however, blood flow was not
decreased in successive A1 to A4 arterioles during AVP infu-
sion when compared to NE infusion. This is particularly strik-
ing, since one would expect a similarly pronounced reduction
of arteriolar blood flow in all consecutive arterioles in the face
of significantly reduced inflow in the main feeding arteriole.
While A0 arterioles obviously contribute significantly to sys-
temic vascular resistance, their influence on arteriolar blood
flow seems to be less pronounced, at least in our experiment.
This finding again corresponds to the clinical observation that
despite a significant increase in systemic vascular resistance
in patients with advanced vasodilatory shock receiving a sup-
plementary AVP infusion, end-organ perfusion is not impaired
when compared to patients with high dose NE therapy alone
[3,12,22].
When interpreting the results of this study, and particularly
when drawing conclusions for the clinical setting, important
limitations need to be noted. First, since the present study was
designed to examine differences in the arteriolar vasoconstric-
tive response between AVP and NE under physiological con-
ditions, further research needs to be conducted to elucidate
whether the observed microcirculatory response to AVP and
NE follows a comparable pattern under pathophysiological
conditions such as vasodilatory shock. Second, in contrast to
our study in animals, most critically ill patients with advanced
vasodilatory shock are ventilated and sedated. From animal
experiments, it is well known that infusion of sedative drugs, for
example, pentobarbital, causes a significant reduction of
microvascular blood flow of the arteriolar and venular system
as well as a decrease in functional capillary density [23]. Third,
as the vasoconstrictive response to AVP has been reported to
differ between some vascular beds and certain species
[24,25], the results of this study cannot be simply transferred
into the clinical setting. However, since arterioles in the skin
and musculature significantly contribute to changes in sys-
temic vascular resistance [17], the skin might very well be a
key organ to primarily assess and compare the vasoconstric-
tive potency of vasopressor agents.
Conclusion
Under physiological conditions, AVP exerted significantly
stronger vasoconstrictive effects on large arterioles than NE in
this hamster window chamber model. This observation may
partly explain why AVP is such a potent vasopressor hormone
and can increase systemic vascular resistance beyond the
level of standard catecholamine therapy in advanced vasodila-
tory shock states.
Competing interests
The authors declare that they have no competing interests.
Authors' contributions
BF, AT, JM and MD designed the study protocol and drafted
the manuscript. BF, AT, JM performed the animal surgery and
carried out the experiments. HU helped with the study design
and statistical evaluation. VW, WH, MI, MD made substantial
contributions to conception and design as well as analysis of
data and have been involved in revising the mansucript for
intellectual content. All authors gave final approval of the ver-
sion to be published.
Acknowledgements
This research was conducted with the financial support of the Österrei-
chische Nationalbank, Jubiläumsfondsprojekt 5526; 'Fonds zur
Förderung der Forschung an den Universitätskliniken Innsbruck' MFF 49
(BF). Support was also available from National Heart, Lung, and Blood
Institute Grant Bioengineering Research Partnership R24-HL64395
and Grants R01-HL62354, R01-HL62318 (MI) and HL76182 (AGT).
References
1. Oliver G, Schaefer EA: On the physiological action of extract of
pituitary body and certain other glandular organs. J Physiol
1895, 18:277-279.
RBC velocity (mm/s) NE
a
1.7 ± 0.3 1.3 ± 0.3 21 ± 14 0.464
AVP
a
1.5 ± 0.3 1.1 ± 0.1 27 ± 19
Arteriolar BF (10
-4
×
mm × μm
2
/s)
NE
a
1.3 ± 1.4 0.4 ± 0.3 63 ± 10 0.837
AVP
a
1.2 ± 0.9 0.5 ± 0.3 57 ± 21
Data are given as mean values ± standard deviation.
a
Significant difference between baseline and drug infusion.
b
Significant difference of change
(%) between arginine vasopressin (AVP) and norepinephrine (NE) animals. BF, blood flow; CSA, cross-sectional area; D, diameter; RBC, red
blood cell.
Table 2 (Continued)
Arteriolar diameter, cross-sectional area, blood velocity, and arteriolar flow in norepinephrine and arginine vasopressin animals
Key messages
• The higher vasoconstrictive potency of AVP when com-
pared to NE may be partly explained by a significantly
more pronounced vasoconstriction of large arterioles
within the microvascular bed of the hamster skinfold
under physiological conditions.
Available online />Page 7 of 7
(page number not for citation purposes)
2. Krismer AC, Wenzel V, Stadlbauer KH, Mayr VD, Lienhart HG,
Arntz HR, Lindner KH: Vasopressin during cardiopulmonary
resuscitation: a progress report. Crit Care Med
2004:S432-435.
3. Mutlu GM, Factor P: Role of vasopressin in the management of
septic shock. Intensive Care Med 2004, 30:1276-1291.
4. Stadlbauer KH, Wenzel V, Krismer AC, Voelckel WG, Lindner KH:
Vasopressin during uncontrolled hemorrhagic shock: less
bleeding below the diaphragm, more perfusion above. Anesth
Analg 2005, 101:830-832.
5. Reid IA, Schwartz J: Role of vasopressin in the control ofblood
pressure. In Frontiers in Neuroendocrinology Edited by: Martini
L, Ganong WF. New York: Raven Press; 1984:177-197.
6. Landry DW, Oliver JA: The pathogenesis of vasodilatory shock.
N Engl J Med 2001, 345:588-595.
7. Dunser MW, Werner ER, Wenzel V, Ulmer H, Friesenecker BE,
Hasibeder WR, Mayr AJ: Arginine vasopressin and serum
nitrite/nitrate concentrations in advanced vasodilatory shock.
Acta Anaesthesiol Scand 2004, 48:814-819.
8. Friesenecker B, Tsai AG, Dunser MW, Mayr AJ, Martini J, Knotzer
H, Hasibeder W, Intaglietta M: Oxygen distribution in microcir-
culation after arginine vasopressin-induced arteriolar vaso-
constriction. Am J Physiol Heart Circ Physiol 2004,
287:H1792-1800.
9. Colantuoni A, Bertuglia S, Intaglietta M: Quantitation of rhythmic
diameter changes in arterial microcirculation. Am J Physiol
1984, 246:508-517.
10. Sakai H, Hara H, Tsai AG, Tsuchida E, Johnson PC, Intaglietta M:
Changes in resistance vessels during hemorrhagic shock and
resuscitation in conscious hamster model. Am J Physiol 1999,
276:563-571.
11. Lipowsky HH, Zweifach BW: Application of the "two-slit" photo-
metric technique to the measurement of microvascular volu-
metric flow rates. Microvasc Res 1978, 15:93-101.
12. Luckner G, Dunser MW, Jochberger S, Mayr VD, Wenzel V, Ulmer
H, Schmid S, Knotzer H, Pajk W, Hasibeder W, Mayr AJ, Friese-
necker B: Arginine vasopressin in 316 patients with advanced
vasodilatory shock.
Crit Care Med 2005, 33:2659-2666.
13. Salzman AL, Vromen A, Denenberg A, Szabo C: K(ATP)-channel
inhibition improves hemodynamics and cellular energetics in
hemorrhagic shock. Am J Physiol 1997, 272:H688-694.
14. Marshall JM, Lloyd J, Mian R: The influence of vasopressin on
the arterioles and venules of skeletal muscle of the rat during
systemic hypoxia. J Physiol 1993, 470:473-484.
15. Mian R, Marshall JM: The roles of catecholamines in responses
evoked in arterioles and venules of rat skeletal muscle by sys-
temic hypoxia. J Physiol 1991, 436:499-510.
16. Baker CH, Sutton ET, Zhou Z, Dietz JR: Microvascular vaso-
pressin effects during endotoxin shock in the rat. Circ Shock
1990, 30:81-95.
17. Duling BR: The role of the resistance arteries in the control of
peripheral resistance. In Resistance Arteries: Structure and
Function Edited by: Mulvany MJ, Aalkjaer C, Heagerty AM, Nyborg
NBC, Strandgraard S. Oxford: Elsevier; 1991:3-9.
18. Matrougui K, Schiavi P, Guez D, Henrion D: High sodium intake
decreases pressure-induced (myogenic) tone and flow
induced dilation in resistance arteries from hypertensive rats.
Hypertension 1998, 32:176-179.
19. Bohlen HG: Localization of vascular resistance changes during
hypertension. Hypertension 1986, 8:181-183.
20. Le Noble JL, Smith TL, Hutchins PM, Struyker-Boudier HA: Micro-
vascular alterations in adult conscious spontaneously hyper-
tensive rats. Hypertension 1990, 15:415-419.
21. Grega GJ, Adamski SW: Patterns of constriction produced by
vasoactive agents. Fed Proc 1987, 46:270-275.
22. Dunser MW, Mayr AJ, Ulmer H, Knotzer H, Sumann G, Pajk W,
Friesenecker B, Hasibeder WR: Arginine vasopressin in
advanced vasodilatory shock: a prospective, randomized, con-
trolled study. Circulation 2003, 107:2313-2319.
23. Kerger H, Saltzman DJ, Gonzales A, Tsai AG, van Ackern K, Win-
slow RM, Intaglietta M: Microvascular oxygen delivery and inter-
stitial oxygenation during sodium pentobarbital anesthesia.
Anesthesiology 1997, 86:372-386.
24. Schmid PG, Abboud FM, Wendling MG, Ramberg ES, Mark AL,
Heistad DD, Eckstein JW: Regional vascular effects of vaso-
pressin: plasmalevels and circulatory responses. Am J Physiol
1974, 227:998-1004.
25. Garcia-Villalon AL, Garcia JL, Fernandez N, Monge L, Gomez B,
Dieguez G: Regional differences in the arterial response to
vasopressin: role of endothelial nitric oxide. Br J Pharmacol
1996, 118:1848-1854.