Báo cáo y học: "trong mucosal immune responses in SIV infected macaques contribute to viral control and preserved CD4+ T-cell levels in blood and mucosal tissues" pps
Bạn đang xem bản rút gọn của tài liệu. Xem và tải ngay bản đầy đủ của tài liệu tại đây (795.1 KB, 13 trang )
RESEARCH Open Access
Strong mucosal immune responses in SIV
infected macaques contribute to viral control
and preserved CD4+ T-cell levels in blood and
mucosal tissues
Tina Schultheiss
1*
, Reiner Schulte
1,2
, Ulrike Sauermann
1
, Wiebke Ibing
1
and Christiane Stahl-Hennig
1
Abstract
Background: Since there is still no protective HIV vaccine available, better insights into immune mechanism of
persons effectively controlling HIV replication in the absence of any therapy should contribute to improve further
vaccine designs. However, little is known about the mucosal immune response of this small unique group of
patients. Using the SIV-macaque-model for AIDS, we had the rare opportunity to analyze 14 SIV-infected rhesus
macaques durably controlling viral replication (controllers). We investigated the virological and immunological
profile of blood and three different mucosal tissues and compared their data to those of uninfected and animals
progressing to AIDS-like disease (progressors).
Results: Lymphocytes from blood, bronchoalveolar lavage (BAL), and duodenal and colonic biopsies were
phenotypically characterized by polychromatic flow cytometry. In controllers, we observed higher levels of CD4+,
CD4+CCR5+ and Gag-specific CD8+ T-cells as well as lower immune activation in blood and all mucosal sites
compared to progressors. However, we could also demonstrate that immunological changes are distinct between
these three mucosal sites.
Intracellular cytokine staining demonstrated a significantly higher systemic and mucosal CD8+ Gag-specific cellular
immune response in controllers than in progressors. Most remarkable was the polyfunctional cytokine profile of
CD8+ lymphocytes in BAL of controllers, which significantly dominated over their blood response. The overall
suppression of viral replication in the controllers was confirmed by almost no detectable viral RNA in blood and all
mucosal tissues investigated.
Conclusion: A strong and complex virus-specific CD8+ T-cell response in blood and especially in mucosal tissue of
SIV-infected macaques was associated with low immune activation and an efficient suppression of viral replication.
This likely afforded a repopulation of CD4+ T-cells in different mucosal compartments to almost normal levels. We
conclude, that a robust SIV-specific mucosal immune response seems to be essential for establishing and
maintaining the controller status and consequently for long-term survival.
Background
Over 33 million people are infected with HIV world-
wide. Since there is c urrently no protective vaccine
available, the understanding of viral-host interactions
and immune responses in the small number of HIV-
infected individuals demonstrating robust control of
systemic HIV replication over long periods of time, in
the absence of any t herapy, should advance the design
of new vaccines.
The majority of studies are focused on systemic
immune responses which correlate with low viral loads
[1-3], even though the mucosal immune system plays
not only a central role in HIV transmission [4,5], but
also in the pathogenesis of AIDS [6-8]. The dramatic
loss of CD4+ T-cells in all mucosal tissue is a hallmark
of early HIV infection [9-12], which subsequently leads
* Correspondence:
1
Unit of Infection Models, German Primate Center, Leibniz Institute for
Primate Research, Kellnerweg 4, 37077, Goettingen, Germany
Full list of author information is available at the end of the article
Schultheiss et al. Retrovirology 2011, 8:24
/>© 2011 Schultheiss et al; license e BioMed Central Ltd. This is an Open Access article distributed under the terms of the Creative
Commons Attribution License ( which permits unrestricted use, distribution, and
reproduction in any mediu m, provided the original work is properly cited.
to several local opportunistic infections and contributes
to AIDS [13-15]. In particular, high viral replication in
the gut is accompanied by gut atrophy [16], malab sorp-
tion [17], chronic diarrhea and weight loss [6,18].
The experimental infection of rhesus macaques (RM)
with simian immunodeficiency virus (SIV) has been
intensively utilized as a model to investigate the patho-
genesis of human HIV infection. Approximately 5% of
RM of Indian origin are able to control SIV replication
[19] which is similar to the rate reported in HIV-
infected humans [20,21]. Therefore, larger cohorts of
such animals have rarely been studied, and in particular
their viral kinetics and virus-specific immune responses
at different mucosal sites ha ve not yet been comprehen-
sively investigated.
In this study, we had the unique opportunity to inves-
tigate 14 SIV-infected RM of Indian origin, which have
been effectively suppressing systemic viral load for sev-
eral years (controllers) in comparison to uninfected ani-
mals and SIV-infected RM with high viral loads and a
more rapid disease progression (progressors). We aimed
to investigate if and how the mucosal immune system
contributes to the control of v iral replication, and we
performed detailed analyses of three distinct mucosal
sites ex vivo.
Intestinal biopsies from duodenum and colon were
obtained, and lung cells were collected via bronchoal-
veolar lavage (BAL) in parallel. Paired blood samples
and mucosal lymphocytes were characterized by analyz-
ing their phenotypic composition and SIV-specific T-cell
function. In addition, the viral load was determined in
blood and all mucosal sites by quantifying viral RNA
and proviral DNA load.
Results
Baseline characteristics of SIV infected RM
This study included 30 SIV-infected rhesus monkeys of
Indian origin infected with SIVmac239 or SIVmac251.
All animals are listed in Table 1 which indicates the
period of investigation and assays performed, together
with their respective mean viral load in plasma during
that time. 12 of the 14 controllers carried MHC alleles
associated with slow disease progression. 10 RM (70%)
carried Mamu-A1*001 and six RM had Mamu-B*017
(43%) (Additional file 1). Four of the latter carried also
Mamu-A1*001.
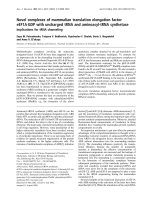
The controllers reduced vi ral replication soon after
peak viremia and were defined by maintaining a mean
viral load of less than 5 × 10
3
RNA copies per ml
plasma (Figure 1) except for one animal (9045).
Although this monkey had a viral load above 1 × 10
4
copies/ml plasma, it was included in the controller
group due to its extremely long survival for more than
10 years. The progressors were defined as having viral
loads above 10
4
viralRNAcopies/mlplasmaduringthe
period of investigation (Table 1). However, it should be
noted that they represent slow progressors as their sur-
vival time.
Higher levels of CD4+ T-cells in blood, BAL and gut of
controllers compared to progressors
The loss of CD4+ T-cells in blood during HIV/SIV
infection is generally modest, whereas mucosal tissues
represent the major site of viral replication. Since most
of the mu cosal CD4+ T-cells are activated memory cells
expressing the viral coreceptor CCR5 [22-24], viral repli-
cation leads to a massive and almost complete depletion
of CD4+ T-cells in all stages of infection [12,22,25,26].
Flow cytometric analy sis was performed to investigate
the proportion of CD4+ and CD4+CCR5+ T- cells in
blood, BAL, duodenum and colon of SIV-infected con-
trollers and progressors in comparison to uninfected
animals.
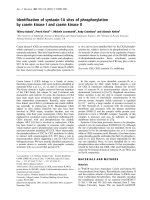
The fraction of CD4+ T-lymphocytes in blood and
duodenum was significantly r educed in controllers com-
pared to uninfected RM ( 49% vs 58% P<0.05; 16% vs
29% P<0.01), but interestingly controllers maintained
almost normal CD4+ T-cell levels in BAL (26%) and
colon (34%) (Figure 2A).
Analyzing CD4+CCR5+ T-cells in blood and BAL of
controllers revealed no significant difference compared
to uninfected monkeys whereas a reduced proportion of
this T-cell subset was obs erved in both i ntestina l sites
(Figure 2B). In contrast, progressors displayed in blood
and a ll mucosal sites significantly lower leve ls of CD4+
and CD4+CCR5+ T-cells than controllers and unin-
fected animals (Figure 2A, B).
The analysi s of all SIV-infecte d animals reveale d a
highly significant inverse correlation between the viral
RNA load in plasma and the CD4+ T-cells in blood (P <
0.0001; r = -0.786), BAL (P < 0.0001; r = -0.814), duode-
num (P = 0.008; r = -0.497) and colon (P < 0.0001; r =
-0.685)aswellasfortheproportionofCD4+CCR5+
T-cells in blood (P = 0.0003; r = - 0.647), BAL (P <
0.0001; r = - 0.817), duodenum (P < 0.0001; r = - 0.742)
and colon (P = 0.0003; r = - 0.674).
Low immune activation in blood and mucosal tissues of
controllers
Chronic activation of T-lymphocytes is known to contri-
bute to v iral replication and disease progression [27,28].
Therefore, the activation profile of blood and mucosal
CD4+ and CD8+ T-cells was analyzed by the expression
of the activation marker HLA-DR.
Blood and duodenal CD4+ T-cells of SIV-infected
controllers expressed significa ntly higher levels of HLA-
DR in comparison to uninfected RM (blood 4.9% vs
2.4%, P < 0.01; duodenum 28% vs 14%, P < 0.01), but
Schultheiss et al. Retrovirology 2011, 8:24
/>Page 2 of 13
no significant activation was observed in BAL or colonic
samples of these animals (Figure 2C). In contrast, pro-
gressors had significantly higher levels of activated CD4
+ T-cells in all compartments compared to uninfected
RM.
The level of CD8+HLA-DR+ T-cells in blood from
controllers was significantly higher than in uninfected
animals (6% vs 13%, P < 0.05), but in all mucosal sites
thisT-cellsubsetdidnotdifferfromuninfectedmaca-
ques (Figure 2D). A significantly higher activation of
CD8+ lymphocytes in gut and blood from progressors
was observed compared to uninfected RM and control-
lers, r espectively. We observed a significant correlation
between the viral RNA copies/ml plasma and the HLA-
DR+CD4+ BAL T-cells (P = 0.034; r = 0.408) and HLA-
DR+CD8+ colonic T-cells (P = 0.007; r = -0.507).
High frequencies of SIV-Gag-specific T-cells in blood and
mucosal tissues of controllers
The MHC class I allele Mamu-A1*001 in RM of Indian
origin is associated with a lower viral set point and
longer survival during SIV infection [29]. Mamu-A1*001
positive RM develop virus-specific cytotoxic CD8+ T-
lymphocytes directed against the immune dominant
SIV-Gag-CM9-peptide (Gag
181-189
,CTPYDINQM)
which can be detected by tetramer staining [30]. We
Table 1 Animals and assays performed
Animal SIVmac
strain
Route of
infection
Period of
investigation
1
Average plasma viral
RNA load
FACS CM9 ELISpot ELISA ICS Viral RNA
load
Proviral
load
DCBDCBP
Controllers
2139* 239 tonsillar 63-245 1.1 × 10
2
XXX X XXXXXXXX
2151* 239 tonsillar 63-245 8.4 × 10
1
XXX X XXXXXXXX
2153* 239 tonsillar 64-245 1.2 × 10
2
XXX X XXXXXXXX
2155* 239 tonsillar 63-245 1.1 × 10
2
XXX X XXXXXXXX
2172 239 tonsillar 68-245 2.5 × 10
2
XXX X XXXXXXXX
2191* 239 tonsillar 71-146 3.8 × 10
3
XX X X
8644* 251 tonsillar 444-550 5.5 × 10
2
XXXXXXXXXX
9045* 239 i.v. 490-507 1.8 × 10
4
XXX
9794 239 tonsillar 209-315 1.2 × 10
3
XXXXXXXXXX
12533* 239 tonsillar 68-116 2.0 × 10
3
XXX X
12535 239 tonsillar 71-153 1.3 × 10
2
XXXXXXX
12536*
,2
239 tonsillar 67-157 4.3 × 10
2
XXX X XXXX
12671* 239 tonsillar 68-241 9.9 × 10
1
XXX X XXXXXXXX
12672 239 tonsillar 71-241 1.7 × 10
2
XXXXXXXXXXX
Progressors
2118* 239 tonsillar 99-177 1.7 × 10
5
XX X X X XX
2141 239 tonsillar 104-120 6.5 × 10
4
XX
2188* 239 tonsillar 107-124 3.1 × 10
5
XXX
12537 239 tonsillar 102-107 7.5 × 10
5
X
2168 239 tonsillar 112-116 1.1 × 10
5
XX
10425 239 tonsillar 113-116 3.7 × 10
4
XX
12539 239 tonsillar 116-117 3.2 × 10
5
XX
2192 251 i.v. 68-92 9.3 × 10
4
XXXXX
12531 239 tonsillar 128-146 4.8 × 10
4
XXXXXX
12538* 251 i.v. 85-115 2.9 × 10
5
XXXXXXX
11139* 251 i.v. 69-121 1.1 × 10
5
XXX X XXXX XX
13251* 251 i.v. 69-115 2.0 × 10
5
XXX X XXXX XX
13258 251 i.v. 96-105 8.2 × 10
5
XXXXXX
13250* 251 i.v. 105-115 1.1 × 10
5
XXX X XX
13257 251 i.v. 105-115 2.8 × 10
5
XXX X
13260 251 i.v. 92-101 1.2 × 10
5
XXXX
*, animals expressing the MHC class I allele MamuA1*001.
1
, weeks post infection.
2
, this animal had an increasing viral load after week 160 post infection, but was separately analyzed until week 250 post infection.
FACS, flow cytometric phenotype staining; CM9, Gag-CM9 tetramer staining; D, duodenum; C, colon; B, BAL; P, PBMC; ICS, intracellular cytokine staining.
Schultheiss et al. Retrovirology 2011, 8:24
/>Page 3 of 13
investigated these SIV-Gag-specific T-cells in blood,
BAL, duodenum and colon of 13 Mamu-A1*001 positive
RM encompassing nine controllers and four progressors.
Overall, in controllers the mean values of CM9-Gag-
specific T-cells were slightly higher with 7.5% and 8%
(of CD8+ T-cells) in BAL and colon, respectively, com-
pared to blood and duodenum where the mean levels
ranged between 4% and 5% (Figure 2E). In contrast , the
proportion of Gag-specific cells was lower in all com-
partments of progr essors in comparison to controllers,
but these differences did not reach statistical significance
probably due to the low number of Mamu-A1*001 pro-
gressors available for this assay.
Association between the proportion of CD4+ T-cells, their
HLA-DR expression and the proportion of Gag-specific T-
cells in blood and mucosal sites of controllers
It is well known that systemic immune activati on corre-
lates with t he loss of peripheral CD4+ T-cells and dis-
ease progression [31,32]. However, when analyzing
blood and t hree mucosal sites of controllers we
obs erved differences in CD4+ T-cell depletion, immune
activation and the levels of Gag-specific T-cells between
these compartments (Figure 2).
Blood and duodenum of controllers exhibited signifi-
cantly decreased levels of CD4+ T-cells and a signifi-
cantly higher expression of HLA-DR on the CD4+ c ells
compared to uninfected RM, together with rather lower
proportions of Gag-specific CD8+ T-ce lls (than in BAL
and colon) (Figure 2A,C,E). In contrast, BAL and colon
exhibited higher levels of Gag-specific T-cells (than
blood and duodenum) and displayed no significant
difference in the proportion of CD4+ and CD4+HLA-
DR+ T-cells compared to uninfected animals (Figure
2A,C,E). These facts displayed a relationship between
immune activation, virus-specific immune response and
CD4+ T-cell numbers for single compartments.
Long-term analyses revealed stable proportions of CD4+
and Gag-specific T-cells in blood and mucosal sites of
controllers
Blood and mucosal lymphocytes from 10 (seven of them
Mamu-A1*001 positive) controllers were investigated for
up to three years. During this period, nine of these ani-
mals had continuously low viral loads and permanently
high proportions of CD4+ T-cells in blood and all
mucosal tissues. In Mamu-A1*001 positive animals w e
observed also relatively stable levels of Gag-CM9+CD8+
T-cells. The proportions of CD4+ and Gag-specific T-
cells of two representative RM (2139+2155) are shown
in Figure 3A+B (left and middle panel). In mucosal tis-
sues some variations were observed in the CD4+ and
the Gag-CM9+CD8+ T-cell subset, mainly in both gut
sites suggesting a local dynamic balance between viral
replication and immune response.
In one RM (12536), the viral load slowly increased
from 4.5 × 10
2
to 3.2 × 10
4
viral RNA copies in plasma
between weeks 125 to 220 post infection. The increasing
viral replication was accompanied by a dramatic loss of
Gag-specific T-cells from about 5-20% to 0.1-0.4% (of
CD8+ T-cells) in blood and all mucosal sites (Figure 3B,
right panel). However, no significant decrease of CD4+
T-cells was observed in blood or mucosal tissues (Figure
3A, right panel).
Strong humoral and cellular immune response against
Gag in controllers
To investigate the breadth of the virus-specific immune
response in controllers and progressors, the humoral
response in blood against the SIV core protein p27 and
the Env protein gp130 was assessed by ELISA, and the
cellular one by IFN-g ELISpot against four different viral
peptide pools.
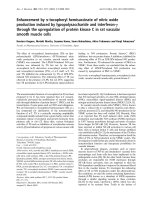
Controllers had significantly h igher binding antibody
titers against p 27 compared to progressors, while the
titers against gp130 were similar in b oth animal cohorts
(Figure 4A). After stimulation of peripheral blood
mononuclear cells (PBMC) with Gag-peptides, the con-
troller group had almost three times the number of
IFN-g secreting cells per 10
6
PBMC than progressors
(mean 1112 vs 385, P = 0.015) (Figure 4B). In contrast,
after stimulation with Tat, Nef or Env peptide pools the
response was similar in both animal cohorts. Of note,
the IFN-g response of controllers aga inst Gag-peptides
dominated significantly over those against all other SIV-
peptide pools investigated (P < 0.01) (Figure 4B).
0 25 50 75 100 125 150 175 200 225 250
10
2
10
3
10
4
10
5
10
6
10
7
weeks post infection
RNA copies / ml plasma
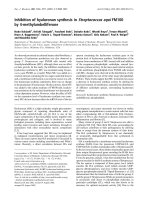
Figure 1 SIV viral RNA load in plasma of controllers and
progressors. Viral RNA copies per ml plasma are shown during
infection with SIVmac239 or SIVmac251 until necropsy or exclusion
from study. Controllers are depicted in blue, progressors in red.
Mean peak viremia was similar in both groups, but from week 8 p.i.
onward controllers exhibited a significantly lower viral load than
progressors (P < 0.05 Mann-Whitney’s U-test). The detection limit for
this assay was 75 viral RNA copies per ml plasma. Viral loads of the
long term infected monkeys 9045, 8644, 9794 are not shown.
Schultheiss et al. Retrovirology 2011, 8:24
/>Page 4 of 13
Blood
uninfected controllers progressors
0
25
50
75
100
*
***
***
CD4+ T-cells
(% of CD3+ T-cells)
Blood
uninfected controllers progressors
0
10
20
30
40
60
80
100
**
**
CD4+ CCR5+ T-cells
(% of CD4+ T-cells)
Blood
uninfected controllers progressors
0
5
10
15
20
40
60
**
**
CD4+ HLA-DR+ T-cells
(% of CD4+ T-cells)
Blood
uninfected controllers progressors
0
10
20
30
40
*
***
*
CD8+ HLA-DR+ T-cells
(% of CD8+ T-cells)
Gag-specific T-cells
blood BAL duodenum colon
0
5
10
15
20
controllers
progressors
CM9-tetramer+ T-cells
(% of CD8+ T-cells)
BAL
uninfected controllers progressors
0
25
50
75
100
***
***
BAL
uninfected controllers progressors
0
25
50
75
100
***
***
BAL
uninfected controllers progressors
0
20
40
60
*
***
BAL
uninfected controllers progressors
0
10
20
30
40
Duodenum
uninfected controllers progressors
0
25
50
75
100
***
** *
Duodenum
uninfected controllers progressors
0
25
50
75
100
*****
***
Duodenum
uninfected controllers progressors
0
20
40
60
**
**
Duodenum
uninfected controllers progressors
0
10
20
30
40
*
Colon
uninfected controllers progressors
0
25
50
75
100
**
***
Colon
uninfected controllers progressors
0
25
50
75
100
****
***
Colon
uninfected controllers progressors
0
20
40
60
*
***
Colon
uninfected controllers progressors
0
10
20
30
40
*
A
B
C
D
E
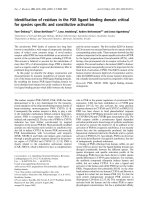
Figure 2 T-cell analyses in blood, BAL, duodenum and colon of controllers, progressors and uninfected RM. Flow cytometric analyses of
(A) CD4+ T-cells, (B) CD4+CCR5+ T-cells, (C) CD4+HLA-DR+ T-cells, (D) CD8+ HLA-DR+ T-cells in blood, BAL, duodenum and colon of controllers,
progressors and uninfected animals. (E) SIV-Gag specific T-cells were detected with CM9-tetramers in blood, BAL, duodenum and colon of
Mamu-A1*001 controllers (blue) and progressors (red). Horizontal lines represent the mean of each group and P-values were calculated with the
Mann-Whitney’s U-test (*P < 0.05, **P < 0.01 and ***P < 0.001).
Schultheiss et al. Retrovirology 2011, 8:24
/>Page 5 of 13
BAL cells from controllers have a higher potential to
secrete cytokines upon polyclonal stimulation than those
from progressors
T-cells that secrete multiple cytokines upon virus-specific
stimulation are associated with the control of viral replica-
tion during HIV infection [33-35]. However, beside a
virus-specific stimulation we also wanted to compare the
general potential of systemic and muc osal T-cel ls to pro-
duce cytokines. We performed ICS with PBMC and BAL
cells from uninfected and SIV-infected monkeys detecting
the cytokines TNF-a, IFN-g and IL-2 after polyclonal sti-
mulation with Staphylococcus enterotoxin B (SEB).
Boolean gating was applied to determine the proportion
of CD45RA- polyfunctional memory T-cells (cells secret-
ing two or all three cytokines). The total response is the
percentage of cells responding to SEB and is composed of
polyfunctional cells and cells secreting one cytokine only.
After stimulating PBMC fro m uninfected animals with
SEB, we observed about 2% cytokine secreting cells in
both CD4+ and CD8+ memory T-cell subsets, whereas
2139
50 100 150 200
0
20
40
60
10
2
10
3
10
4
10
5
10
6
2139
50 100 150 200
0
2
4
6
8
10
12
10
2
10
3
10
4
10
5
10
6
2155
50 100 150 200
0
20
40
60
10
2
10
3
10
4
10
5
10
6
2155
50 100 150 200
0
2
4
6
8
10
12
10
2
10
3
10
4
10
5
10
6
12536
50 100 150 200
0
20
40
60
10
2
10
3
10
4
10
5
10
6
BAL
Duodenum
Colon
Blood
viral RNA load
12536
50 100 150 200
0
2
4
6
10
15
20
25
10
2
10
3
10
4
10
5
10
6
CD4+ T-cells
(% of CD3+ T-cells)
Gag-Tetram er + T- cells
(% of CD8+ T-cells)
viral RNA copies / ml plasma
B
A
weeks post infection
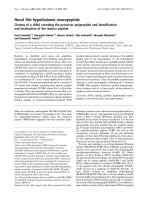
Figure 3 Long-term analyses of blood and mucosal CD4+ and Gag-specific T-cells in SIV infected RM. Long-term flow cy tometric
analyses of (A) CD4+ T-cells and (B) CD8+ CM9-tetramer+ T-cells in blood (red), BAL (green), duodenum (yellow) and colon (blue) of three SIV-
infected animals together with plasma viral RNA load (dashed line). Two representative controllers (2139+2155) effectively controlling viral
replication (A+B left and middle panels) are shown. One RM (12536) defined as controller until week 150 p.i., was then excluded from the
controller group due to its gradually increasing plasma viral load but further investigated until week 220 p.i. (A+B right panels).
p27 gp130
10
2
10
3
10
4
10
5
10
6
*
antibody titer
Gag Tat Nef Env
0
1000
2000
3000
controllers
progressors
*
** ** **
SFC / 10
6
PBMC
A
B
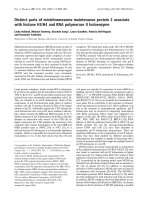
Figure 4 System ic virus-specific humoral and cellular immune responses in controllers and progress ors. (A) Antibody titer against the
SIV-p27 and SIV-gp130 protein were determined in serum of controllers (blue) and progressors (red) by ELISA. (B) INF-g secreting lymphocytes as
determined by ELISpot assay are shown as the number of spot forming cells (SFC) per 10
6
PBMC after stimulation with viral peptide pools SIV-
Gag, SIV-Tat, SIV-Nef and SIV-Env in controllers (blue) and progressors (red). Horizontal lines represent the mean of each group and P-values were
calculated with the Mann-Whitney’s U-test (*P < 0.05 and **P < 0.01).
Schultheiss et al. Retrovirology 2011, 8:24
/>Page 6 of 13
half of them were polyfunctional (Figure 5A,C). Compared
to PBMC a significantly higher total cytokine response
was observed in BAL cells in the CD4+ (29.1% vs 1.7%; P
< 0.0001) and the CD8+ (17.4% vs 2.25%; P < 0.0001)
memory T-cell subset including also significantly more
polyfunctional CD4+ (20.9% vs 1.33%; P < 0.0001) and
CD8+ (12% vs 0.8%; P < 0.0001) T-cells (Figure 5B,D).
These results clearly demonstrate that BAL cells have a
higher capability to secrete cytokines compared to PBMC.
Stimulated PBMC of controllers contained significantly
higher values of total cytokine secreting CD4+ T-cells
compared to uninfected RM (3.5% vs 2.25%; P < 0.005),
but not higher polyfunctional ones (Figure 5A). Beyond
that no further differences in peripheral cytokine secretion
were observed between controllers, progressors and unin-
fected animals (Figure 5A, C).
However, in BAL from the controllers the total level of
CD4+ me mory cytokine secreting cells, but not the level of
polyfunctional cells, was significantly decreased compared
to uninfected animals (Figure 5B). BAL CD8+ T-cells of
controllers displayed lower proportions of polyfunctional
cells, but no difference in the total level of cytokine secret-
ing cells (Figure 5D). The progressors showed significantly
lower proportions of polyfunctional and total cytokine
secreting CD4+ and CD8+ T-cells compared to uninfected
RM and mostly also t o controllers (Figure 5B,D).
Strong polyfunctional virus-specific CD8 T-cell response
in BAL of controllers
Based on the dominating systemic Gag-specific IFN-g
ELISpot responses in controllers (Figure 4), the further
investigation of cellular immune responses by ICS was
focused on Gag. PBMC and BAL cells were stimulated
with a Gag-peptide pool and those from Mamu-A1*001
positive animals additionally with the immune dominant
CM9-peptide alone.
The mean values of all CD4+ cytokine secreting cell
subsets ranged from 0.12% to 1.52% (of CD4+ memory
T-cells) in PBMC and BAL from both SIV-infected animal
cohorts. No differences were observed between controllers
and progressors in their frequencies of polyfunctional and
total cytokine secreting CD4+ memory T-cells in blood
and mucosa (Figure 6A,B).
In contrast, striking differences were found in the CD8
+ memory T-cell subset. Controllers had 0.65% of CD8+
cytokine secreting cells against Gag in PBMC and 3.7%
in BAL being significantly higher compared to 0.06%
and 0.38% in progressors (Figure 6C,D, right panels). In
addition, 1.3% of the Gag-specific BAL response in con-
trollers was polyfunctional and signific antly higher than
that in progressors where such a response was almost
entirely missing (Figure 6D, left panel). Comparing Gag-
specific blood and BAL responses of controllers revealed
in BAL, a more than 5-fold higher total CD8+ restricted
cytokine secretion (P = 0.014) and 8.7-fold higher levels
of polyfunctional cells (P = 0.004).
For the analyses of Gag-CM9-specific CD8+ T-cells,
only three Mamu-A1*001 progressors were available.
None of these RM had any detectable cytokine response
in their CD8+ memory T-cell subset of BAL or PBMC
(Figure 6E,F). In contrast, controllers had a total cyto-
kine response of 1.7% in PBMC and 4.7% in BAL of
PBMC
uninfected controllers progressors
0
2
4
6
8
10
polyfunctional cells
PBMC
uninfected controllers progressors
0
2
4
6
8
10
polyfunctional cells
PBMC
uninfected controllers progressors
0
2
4
6
8
10
**
total cytokine response
PBMC
uninfected controllers progressors
0
2
4
6
8
10
total cytokine response
BAL
uninfected controllers progressors
0
20
40
60
**
polyfunctional cells
BAL
uninfected controllers progressors
0
20
40
60
**
*
*
polyfunctional cells
BAL
uninfected controllers progressors
0
20
40
60
**
*
*
total cytokine response
BAL
uninfected controllers progressors
0
20
40
60
**
*
total cytokine response
% of CD4+ memory T-cells
% of CD8+ memory T-cells
B
C
D
A
Figure 5 Cytokine response in PBMC and BAL of controller s, progressors and uninfected animals after polyclonal stimulation.
Percentage of polyfunctional cells and total cytokine secreting cells after SEB stimulation in the CD4+ memory T-cell subset of PBMC (A) and
BAL (B) as well as in the CD8+ memory T-cell subset of PBMC (C) and BAL (D) in controllers, progressors and uninfected animals. Polyfunctional
cells were defined as expressing two or three cytokines (IFN-g+ TNF-a+, IFN-g+ IL-2+, TNF-a+ IL-2+, IFN-g+ TNF-a+ IL-2+) and the total response
comprises polyfunctional cells and cells secreting one cytokine only (single positive cells). Horizontal lines represent the mean of each group and
P-values were calculated with the Mann-Whitney’s U-test (*P < 0.05 and **P < 0.01).
Schultheiss et al. Retrovirology 2011, 8:24
/>Page 7 of 13
CD8+ memory T-cells (Figure 6E,F) and approximately
half of the cytokine secreting cells in both BAL and
PBMC were polyfunctional (Data not shown).
Controllers effectively suppress viral RNA load in blood
and mucosal tissues
The highly effective reduction of systemic viral replica-
tion together with the strong virus-specific mucosal
immune response, detected by tetramer staining and
ICS, raised the quest ion about the viral load in mucosal
tissue. Therefore, total RNA and genomic DNA (gDNA)
were iso lated from BAL cells and colonic and duodenal
biopsies. Viral RNA load and proviral copies were quan-
tified by real-time PCR.
Surprisingly, no vir al RNA was detected in BAL and
intestine of controllers with the exception of one animal
(12536). This animal had 37 viral copies in BAL and 20
in colon per 500 ng total RNA (Figure 7A), and the
highest systemic viral load among the controllers at the
respective time point (1 × 10
3
viral RNA copies/ml
plasma). In contrast, the progressors had a significantly
higher viral load not only in plasma but also in all
mucosal compartments ranging from 15 to 1.5 × 10
4
copies per 500 ng total RNA. When taking data from
controllers and progressors into accou nt, we o bserved a
highly significant correlation between the viral load in
plasma and each mucosal compartment investigated
(P < 0.0001).
The proviral copies in PBMC and in bot h intestinal
sites from controllers were similar and ranged from
undetectable to 3 × 10
2
copies per 500 ng gDNA (Figure
7B). In BAL cells from only one controller (12536), we
detected 27 proviral copies per 500 ng gDNA, whereas
all others were below the detection limit. Unfortunately,
no gut samples of progressors were available to deter-
mine proviral load, but in BAL and PBMC we observed
significantly higher proviral copy numbers than in con-
trollers. In progressors the proviral load in BAL (7 to
1×10
2
copies) was significantly lower than in their
PBMC (2.6 × 10
2
to 2.1 × 10
3
copies) (P = 0.0079).
Discussion
Various studies have demonstrated a correlation
between peripheral CD8+ T-cell responses and suppres-
sion of viral replication in HIV-infected humans
[2,34,36] and SIV- infe cted RM [37,38]. However, in this
context little is known about the role of the mucosal
immune system. To our knowledge, this is the first
comparative study with a large cohort of SIV-infected
RM of Indian origin effectively controlling viral replica-
tion, which examines the immunological and virological
status of different mucosal tissues ex vivo.
Here, we demonstrated that controllers in blood and
mucosal sites exhibit (i) an effective control of viral
replication (ii) have almost normal levels of C D4+ T-
cells and high frequencies of Gag-specific CD8+ T-cells
as well as a lower immune activation (iii) and a robust
polyfunctional CD8+ T-cell response.
Mucosal tissues are major sites o f viral replication
[22,24,25], but in terestingly, our controllers were able to
PBMC
controllers progressors
0.0
0.5
1.0
1.5
2.0
2.5
polyfunctional cells
BAL
controllers progressors
0
2
4
6
8
10
12
14
polyfunctional cells
PBMC
controllers progressors
0.0
0.5
1.0
1.5
2.0
2.5
total cytokine response
BAL
controllers progressors
0
2
4
6
8
10
12
14
total cytokine response
PBMC
controllers progressors
0.0
0.5
1.0
1.5
2.0
2.5
polyfunctional cells
BAL
controllers progressors
0
1
2
3
5
10
15
***
polyfunctional cells
PBMC
controllers progressors
0.0
0.5
1.0
1.5
2.0
2.5
*
total cytokine response
BAL
controllers progressors
0
1
2
3
5
10
15
*
total cytokine response
PBMC
controllers progressors
0
2
4
6
8
10
**
total cytokine response
BAL
controllers progressors
0
1
2
3
5
10
15
20
*
total cytokine response
% of CD4+ memor
y
T-cells
% of CD8+ memor
y
T-cells
B
C
D
AE
F
Figure 6 Virus-specific cytokine response of PBMC and BAL memory T-cells from controllers and progressors.Percentageof
polyfunctional cells and total cytokine secreting cells after SIV-Gag stimulation in the CD4+ memory T-cell subset of PBMC (A) and BAL (B) and
in the CD8+ memory T-cell subset of PBMC (C) and BAL (D) in controllers, progressors and uninfected animals. The right panels show the total
cytokine response of CD8+ memory T-cells in PBMC (E) and BAL cells (F) of Mamu-A1*001 positive controllers and progressors after stimulation
with the CM9-peptide only. For definition of polyfunctional cells and the total response see figure legend 5. Horizontal lines represent the mean
of each group and P-values were calculated with the Mann-Whitney’s U-test (*P < 0.05, **P < 0.01 and ***P < 0.001).
Schultheiss et al. Retrovirology 2011, 8:24
/>Page 8 of 13
reduce viral RNA load not only in blood but also in all
mucosal tissues investigated. Since during the acute
phase of HIV infection a reservoir of latentl y infected
resting CD4+ T-cells is established, with a mean half-life
of about 3.5 years [39], it follows that proviral DNA
would be detected not only in progressors but also in
the majority of samples fro m controllers. However,
almost all BAL samples from controllers were negative
for SIV provirus and i n progressors the proviral load
was significantly lower than in their PBMC which might
be explained by the higher cell turnover on the lung
surface.
All studies with pathogenic SIV infection in RM inves-
tigating mucosal tissues during peak viremia reported a
dramatic loss of CD4+ T-cells in the gut [11,12,22,26,40],
the female genital tract [23] and BAL [41]. To date, a
repopulation of mucosal CD4+ T-cells has only been
demonstrated in SIV-infected Chinese RM, which control
viral replication and moreover analyzing just one mucosal
site [40,41]. However, the course of disease is attenuated
in these monkeys compared to RM of Indian origin used
in this study.
When analyzing blood and three different mucosal
sites f rom our controllers of Indian origin, we found in
blood, BAL, duodenum and colon almost normal CD4+
T-cell levels, which signifi cantly exceed those of pro-
gressors. We demonstrated that controllers naturally
and effectively suppress viral replication in blood and
mucosal organs, which is accompanied by a repopula-
tion of CD4+ T-cells in all mucosal tissues albeit to a
varying degree. Almost normal CD4+ T-cell levels com-
bined with low proportions of CD4+CCR5+ T- cells in
both gut sites of controllers argues for a repopulation of
mainly CD4+CCR5- T-cells. The reduction of the pri-
mary viral target cells in the intestine, the largest muco-
sal organ, may significantly contribute to long-term
control of viral replication.
By using tetramer technology we demonstrated a
higher systemic, a nd especially mucosal, Gag-specific
cellular immune response in controllers than in progres-
sors. We confirmed with the l ongitudinal analyses of
controllers for up to three years, that the levels of these
virus-specific T-cells are relatively stable in blood and
all three mucosal tissues, combined with persistently
high levels of CD4+ T-cells and low viral loads.
One former controller (12536) displayed a s lowly
increasing plasma and mucosal viral load (Data not
shown) over two years, accompanied by a severe decrease
of Gag-specific T-cells, but surprisingly stable levels of
CD4+ T-cells in blood and all mucosal tissues. This
points to an as yet undefined mechanism, that in former
controllers blood and mucosal CD4+ T-cells can be pre-
served for an unknown period of time despite increasing
viral replication obviously decelerating the progression to
BAL
10
0
10
1
10
2
10
3
10
4
10
5
***
viral RNA copies
(per 500ng RNA)
BAL
10
0
10
1
10
2
10
3
10
4
10
5
**
proviral DNA copies
(per 500ng gDNA)
Colon
***
Colon
progressors
n.d.
Duodenum
***
Duodenum
progressors
n.d.
Plasma
10
2
10
3
10
4
10
5
10
6
controllers
progressors
***
(per ml plasma)
PBMC
***
controllers
progressors
A
B
Figure 7 Viral RNA and proviral load in blood and mucosal tissue of controllers and progressors. (A) Viral RNA copies were determined
per 500 ng total RNA of BAL cells, duodenal and colonic biopsies from controllers and progressors and shown along with the respective RNA
viral load per ml plasma. (B) Proviral DNA copies per 500 ng genomic DNA were determined in BAL cells, PBMC, colonic and duodenal biopsies
of controllers and in PBMC and BAL cells of progressors. P-values were calculated with the Mann-Whitney’s U-test (**P < 0.01 and ***P < 0.001).
Schultheiss et al. Retrovirology 2011, 8:24
/>Page 9 of 13
AIDS like disease, as this animal remains healthy to date
(5 years post infection).
During HIV infection, a chronic immune activation
correlates with high viral load, systemic CD4+ T-cell
depletion and a faster disease progr ession [28,31,32,42].
Our results are in line with these findings, as we observed
a lower HLA-DR expression on CD4+ and CD8+ T-cells
in blood and mucosal tissues of controllers compared to
progressors.
However, when considering only the controller cohort
in detail, we observed that the relationship betw een
immune activation, virus-specific T-cells and CD4+
T-cell levels is not only restricted to individuals in
general but also to single organs in particular.
In t he blood and duodenum of controllers, we found
rather lower levels of Gag-specific T-cells and signifi-
cantly decreased proportions of CD4+ T-cells with a sig-
nificantly higher expression of HLA-DR. The opposite
pattern was found in BAL and colon, where the CD4+
T-cells and their HLA-DR expression did n ot differ
from uninfected RM and the mean levels of virus-speci-
fic T-cells were higher than in blood and duodenum.
These results clearly suggest a direct association
between virus-specific immune response, CD4+ T-cell
levels and their activation level within single organs.
In contrast to PBMC, functional characterization of
mucosal cells is generally more complex and time-con-
suming. In RM, it is hardly feasible to collect as many
intestinal biopsies as in humans, thus ending up with
much lower cell yield and a lmost precluding a func-
tional characterization by ELISpot or ICS. Moreover, to
obtain intestinal cells, the biopsies have to be digested
enzymatically, which may influence cytokine secretion.
Therefore, we used easily accessible BAL cells for a
functional characterization of the mucosal immune
system.
Our da ta demonstrated, that the total CD8+ cytokine
response was significantly higher in PBMC and BAL
cells of controllers than in progressors, when stimulated
with the Gag-peptides. Of note, the frequencies of poly-
functional Gag-specific CD8+ T-cells in BAL were sig-
nificantly higher than in progressors, this did not,
however, apply for blood. When comparing mucosal
and systemic responses, the different ratios between
naïve and memory cells must be considered because
mucosal tissues exhibit significantly more memory
T-cells than PBMC [43] and virus-specific cytokin e
secretion is restricted to memory cells [44]. Therefore,
we excluded naïve cells from analyses and displayed the
cytokine secreting cells as a proportion of memory cells.
Both total and polyfunctional CD8+ BAL responses in
controllers against the Gag-peptide pool and Gag-CM9
significantly exceeded their respective responses in
blood. This suggests that a robust CD8+ virus-specific
polyfunctional mucosal immune response is even
more important than a peripheral one to control viral
replication.
Only a few studies investigated mucosal immune
responses in controller individuals, but detailed mucosal
immune analyses of intestinal lymphocytes from
well-defined cohorts including HIV controlling indivi-
duals reported recently a strong CD8+ and CD4+
dependent rectal mucosal immune response associated
with viral suppression [45-47]. In contrast to these find-
ings, we did not observe a difference between controllers
and progressors regarding their virus-specific CD4+
response. However, the cytokine secretion in their stu-
dies was related to the total amount of CD4+ or CD8+
T-cells and the different ratio between naïve and mem-
ory T-cells in blood and gut was not considered.
In addition, not only the virus-specific stimulation, but
also the polyclonal stimulation of PBMC and BAL cells
with SEB provided important information. Comparing
the functionality of peripheral T-cells from controllers,
progressors and uninfec ted RM after SEB stimulation
displayed hardly any signific ant differences between
these animal cohorts. In contrast, the cytokine responses
of CD4+ and CD8+ memory T-cells in BAL of control-
lers were slightly reduced compared to uninfected ani-
mals but not to the same e xtent as in pr ogressors.
These results suggest an irreversible damage of the
mucosal i mmune system that probably occurred during
peak viremia and cannot be recovered completely, even
in controllers displaying a robust suppression of viral
replication. Of note, the frequencies of polyfunctional
CD8+cellsaswellasthetotalcytokineresponseof
CD4+ and CD8+ memory T-cells were still significantly
higher in control lers than in progressors. Possibly the
stimulation of BAL cells with SEB can be a compara-
tively easy method providing p rognostic information
about the functional status of the mucosal immune
system in the lung of HIV/SIV-infected individuals.
Conclusion
Our st udy demonstrated that a functional virus-specific
mucosal immune response significantly contributes to
an efficient overall reduction of viral replication and is
associated with a repopulation of CD4+ T-cells in differ-
ent mucosal organs. We conclude that, inducing a
strong mucosal immune response during vaccination
might lead to a later controller status and therefore
could be a stepping-stone to developing a protecti ve
vaccine with sterilizing immunity.
Methods
Animals, blood and tissue sampling
For this study 45 adult colony-bred rhesus monkeys of
Indian origin comprising 15 naïve and 30 experimentally
Schultheiss et al. Retrovirology 2011, 8:24
/>Page 10 of 13
infected with SIVmac239 or SIVmac251, between 4 and
12 years old were used. The anima ls were housed at the
German Primate Center under standard conditions
according to the German Animal Welfare Act, which
complies with the European Union guidelines on t he
use of non-human primates for biomedical research.
MHC alleles were typed using allele- or group specific
primers as described [48].
To collect bronchoalveolar lavage, intestinal biopsies
and blood the animals were anesthet ized with a mixture
of 5 mg ketaminhydrochloride, 1 mg xylazinhydrochlor-
ide and 0.01 mg atropine sulfate per kg body weight.
Mucosal cells were isolated as previously descri bed [43].
PBMC for IFN-g ELISpot, intracellular cytokine staining
and proviral load were isolated from peripheral blood
using Ficoll-hypaque density centrifugatio n. The differ-
ent assays were p erformed at various time points, but
within each analysis paired sample s from differe nt com-
partments of eac h animal we re taken and analyzed. All
SIV-infected animals were derived from different vaccine
experiments, but there was no correlation between pre-
vious vaccination received and the ensuing controller or
progressor status. Moreover, in both animal cohorts,
controllers and progressors, there was no difference
between the viral loads of vaccinated and unvaccinated
RM over the whole period of infection.
ELISpot
IFN-g ELISpot assay was performed using SIV-Gag
(EVA7066, NIBSC, UK); Env2 (6583-6637, NIH), Nef
(EVA777, NIBSC) and Tat (EVA7069, NIBSC) peptide s
as described previously [49]. The IFN-g positive cells
were counted using a Bioreader
®
-3000 (Bio-Sys GmbH,
Karben, Germany). Individual values were obtained by
peptide stimulation minus mediu m control and consid-
ered positive when exceeding 100 spot forming cells
(SFC) per million PBMC.
ELISA
To detect antibodies against SIV, a standard ELISA [50]
was performed on plates coated with 30 ng per well of
recombinant SIV-p27 (EVA643, NIBSC) or recombinant
SIV-gp130 (EVA670, NIBSC). Anti-SIV-IgG antibodies
were determined by end-point-dilution. The titers were
expressed as the r eciprocal of the highest dilution yield-
ing optical densities twice above the autologous prein-
fection or preimmunization values.
Monoclonal antibodies and flow cytometric surface
staining
Different lymphocyte populations were investigated by
polychromatic flow cytometry. For surface staining,
50 μl of whole blood and 0.4-1 × 10
6
mucosal cells were
analyzed using the following monoclonal antibodies
from BD Biosc ience (Heidelberg, Germany): anti -CD3
Alexa700 (clone SP34-2), anti-CD4 PacificBlue (clone
L200) or CD4-Alexa405 (clone L200), anti-CD8
AmCyan (clone SK1), CCR5-APC (clone 3A9), HLA-
DR-APC-Cy7 (clone L234). For tetramer analysis the
CM9-tetramer-PE (Beckman Coulter, Krefeld, Germany)
was used. Twelve-parameter flow cytometric analysis
was performed using a BD LSRII flow cytometer (BD
Biosciences) and the list-mode data files were analyzed
using FlowJo Version 8.7 (Tree Star).
Intracellular cytokine staining
Freshly isolated PBMC or BAL cells were resuspended
in RPMI 1640 medium (PAN Biotech, Aidenbach, Ger-
many) supplemented with 10% heat inactivated FCS and
1 μg/ml anti-CD28 costimulatory antibody. 0.7-1.5 × 10
6
cells were stimulated with synthetic 15 mer Gag peptide
pool (EVA7066, NIBSC, final concentration 2 μg/ml/
peptide), with the single CM9-peptide (Gag
181-189
,
CTPYDINQM, final concentration 2 μg/ml) or with Sta-
phylococcus enterotoxin B (SEB; final co ncentration
1 μg/ml) respectively. Additionally, two negative con-
trols were performed, one containing a peptide pool
from human hepatitis C virus and one anti-CD28 only.
The cultures were incubated for 1 h at 37°C in a 5%
CO2 incubator, followed by a 5 h incubation in the pre -
sence of Brefeldin A (10 μg/ml; Sigma-Aldrich, Tauf-
kirchen, Germany). After washing the surface staining
was performed with anti-CD3 Alexa700 (clone SP34-2,
BD Bioscience), anti-CD4 PerCPCy5.5 (clone L200, BD
Bioscience), anti-CD8 PacificOrange (clone 3B5, CAL-
TAG, Buckingham, UK) and anti-CD45-RA-ECD (clone
2H4, Beckman Coulter) antibodies for 30 min at room
temperature and then fixed with 4% formaldehyde in
PBS for 10 min at 37°C. Cells were stored overnight
in 400 μl PBS-buffer at 4°C and stained on the follow-
ing day with anti-IL-2 FITC (clone MQ1-17H12,
BD Bioscience), anti-TNF-a PE (clone MAb11, BD
Bioscience), and anti-IFN-g AP C (clone B27, BD
Bioscience) PBS-buffer containing 0.5% Saponin for 45
min at 4°C. After a final wash cells were resuspended in
PBS and analyzed by flow cytometry (BD LSRII flow cyt-
ometer). Background correction was done by using the
anti-CD28 negative control. Boolean-gating identified
single positive cells (secreting only one cytokine) and
polyfunctional (producing two or three cytokines)
CD45RA- memory T-cells. A SIV-specific positive
response was defined by reaching at least twice the
height of the HCV-response.
SIV viral load
Viral RNA was isolated from frozen plasma samples
following the MagAttract Virus Mini M48 protocol (Qia-
gen, Hilden, Germany) and total RNA from intestinal
Schultheiss et al. Retrovirology 2011, 8:24
/>Page 11 of 13
biopsies and BAL-cells was isolated using Qiagen RNeasy
Plus Mini Kit in accordance with the manufacturer’spro-
tocol. Viral RNA copies were quantified in purified SIV
RNA from plasma or in 500 ng total RNA from tissue
using TaqMan-based real-time PCR on an ABI-Prism
7500 sequence detection system (Applied Biosystems) as
described [51]. As an internal standard, the amount and
quality of total RNA from mucosal tissues was compared
to the GAPDH-house keeping gene in parallel.
For detecting SIV, proviral l oad genomic DNA was
isolated from PBMC, BAL cells and intestinal biopsies
using the QiaAmp DNA Mini Kit (Qiagen) according to
the manufacturer’ sinstructionsincludingaRNAdiges-
tion. SIV proviral copies were quantified using a total
amount of 500 ng of isolated DNA, the Gene Expression
Master Mix (Applied Biosystems) TaqMan-based real-
time PCR on an ABI-Prism 7500 sequence detection
system (Applied Biosystems) as described before [51].
Statistical analysis
Comparison between two animal groups or different
tissues was performed using two-tailed Mann-Whitney’s
U-t est in GraphPad Prism software, vers ion 5 (Graph-
Pad Software, San Diego, USA). Correlation analyses
between variables were performed by using the Spear-
man correlation (GraphPad Prism).
For correlations including the p lasma viral load, w e
used the individual viral RNA copy numbers per ml
plasma of each animal at the respective point i n time
when the assay was performed.
Additional material
Additional file 1: Table S1. MHC class I genotypes. MHC class I
background of SIV-infected rhesus monkeys used in this study. MHC
alleles were typed using allele- or group specific primers as described
[48] and genotypes associated with slow disease progression are in bold
letters. Of one MamuA1*001 negative progressor (12539) no DNA-
samples for further typing were available, so that additional data are not
presented.
Acknowledgements
We thank N. Leuchte, S. Heine and J. Hampe for their excellent technical
support and T. Eggers, M. Franz, A. Schrod and K. Raue for collecting BAL
and intestinal biopsies.
Author details
1
Unit of Infection Models, German Primate Center, Leibniz Institute for
Primate Research, Kellnerweg 4, 37077, Goettingen, Germany.
2
Cancer
Research UK Cambridge Research Institute, Li Ka Shing Centre, Robinson
Way, Cambridge CB2 0RE, UK.
Authors’ contributions
TS performed flow cytometric surface analysis of blood and mucosal cells as
well as the intracellular cytokine staining, quantified SIV RNA load in mucosal
tissue and wrote the manuscript. RS helped with all flow cytometric analyses
and wrote the manuscript. US quantified the SIV RNA load in plasma,
analyzed the MHC genotypes and reviewed the manuscript. WI performed
the SIV proviral load analyses. CSH carried out ELISA and ELIspot
experiments and reviewed the manuscript. TS, RS and CSH designed and
coordinated the study and edited the manuscript. All authors read and
approved the final manuscript.
Competing interests
The authors declare that they have no competing interests.
Received: 2 February 2011 Accepted: 11 April 2011
Published: 11 April 2011
References
1. Koup RA, Safrit JT, Cao Y, Andrews CA, McLeod G, Borkowsky W, Farthing C,
Ho DD: Temporal association of cellular immune responses with the
initial control of viremia in primary human immunodeficiency virus type
1 syndrome. J Virol 1994, 68:4650-4655.
2. Borrow P, Lewicki H, Hahn BH, Shaw GM, Oldstone MB: Virus-specific CD8+
cytotoxic T-lymphocyte activity associated with control of viremia in
primary human immunodeficiency virus type 1 infection. J Virol 1994,
68:6103-6110.
3. Dyer WB, Zaunders JJ, Yuan FF, Wang B, Learmont JC, Geczy AF, Saksena NK,
McPhee DA, Gorry PR, Sullivan JS: Mechanisms of HIV non-progression;
robust and sustained CD4+ T-cell proliferative responses to p24 antigen
correlate with control of viraemia and lack of disease progression after
long-term transfusion-acquired HIV-1 infection. Retrovirology 2008, 5:112.
4. Voeller B: AIDS and heterosexual anal intercourse. Arch Sex Behav 1991,
20:233-276.
5. Wilkinson J, Cunningham AL: Mucosal transmission of HIV-1: first stop
dendritic cells. Curr Drug Targets 2006, 7:1563-1569.
6. Chui DW, Owen RL: AIDS and the gut. J Gastroenterol Hepatol 1994, 9:291-303.
7. Rosen MJ: Pulmonary complications of HIV infection. Respirology 2008,
13:181-190.
8. Wallace JM: HIV and the lung. Curr Opin Pulm Med 1998, 4:135-141.
9. Mehandru S, Poles MA, Tenner-Racz K, Manuelli V, Jean-Pierre P, Lopez P,
Shet A, Low A, Mohri H, Boden D, et al: Mechanisms of gastrointestinal
CD4+ T-cell depletion during acute and early human immunodeficiency
virus type 1 infection. J Virol 2007, 81:599-612.
10. Guadalupe M, Reay E, Sankaran S, Prindiville T, Flamm J, McNeil A,
Dandekar S: Severe CD4+ T-cell depletion in gut lymphoid tissue during
primary human immunodeficiency virus type 1 infection and substantial
delay in restoration following highly active antiretroviral therapy. J Virol
2003, 77:11708-11717.
11. Schneider T, Jahn HU, Schmidt W, Riecken EO, Zeitz M, Ullrich R: Loss of
CD4 T lymphocytes in patients infected with human immunodeficiency
virus type 1 is more pronounced in the duodenal mucosa than in the
peripheral blood. Berlin Diarrhea/Wasting Syndrome Study Group. Gut
1995, 37:524-529.
12. Brenchley JM, Schacker TW, Ruff LE, Price DA, Taylor JH, Beilman GJ,
Nguyen PL, Khoruts A, Larson M, Haase AT, Douek DC: CD4+ T cell
depletion during all stages of HIV disease occurs predominantly in the
gastrointestinal tract. J Exp Med 2004, 200:749-759.
13. Chiasson MA, Ellerbrock TV, Bush TJ, Sun XW, Wright TC Jr: Increased
prevalence of vulvovaginal condyloma and vulvar intraepithelial
neoplasia in women infected with the human immunodeficiency virus.
Obstet Gynecol 1997, 89:690-694.
14. Dandekar S: Pathogenesis of HIV in the gastrointestinal tract. Curr HIV/
AIDS Rep
2007, 4:10-15.
15.
Murray JF: Pulmonary complications of HIV infection. Annu Rev Med 1996,
47:117-126.
16. Ullrich R, Zeitz M, Heise W, L’Age M, Ziegler K, Bergs C, Riecken EO:
Mucosal atrophy is associated with loss of activated T cells in the
duodenal mucosa of human immunodeficiency virus (HIV)-infected
patients. Digestion 1990, 46(Suppl 2):302-307.
17. Modigliani R, Bories C, Le Charpentier Y, Salmeron M, Messing B, Galian A,
Rambaud JC, Lavergne A, Cochand-Priollet B, Desportes I: Diarrhoea and
malabsorption in acquired immune deficiency syndrome: a study of four
cases with special emphasis on opportunistic protozoan infestations. Gut
1985, 26:179-187.
18. Riecken EO, Zeitz M, Ullrich R: Non-opportunistic causes of diarrhoea in
HIV infection. Baillieres Clin Gastroenterol 1990, 4:385-403.
Schultheiss et al. Retrovirology 2011, 8:24
/>Page 12 of 13
19. O’Connor DH, Mothe BR, Weinfurter JT, Fuenger S, Rehrauer WM, Jing P,
Rudersdorf RR, Liebl ME, Krebs K, Vasquez J, et al: Major histocompatibility
complex class I alleles associated with slow simian immunodeficiency virus
disease progression bind epitopes recognized by dominant acute-phase
cytotoxic-T-lymphocyte responses. JVirol2003, 77:9029-9040.
20. Buchbinder S, Vittinghoff E: HIV-infected long-term nonprogressors:
epidemiology, mechanisms of delayed progression, and clinical and
research implications. Microbes Infect 1999, 1:1113-1120.
21. Buchbinder SP, Katz MH, Hessol NA, O’Malley PM, Holmberg SD: Long-term
HIV-1 infection without immunologic progression. AIDS 1994,
8:1123-1128.
22. Mattapallil JJ, Douek DC, Hill B, Nishimura Y, Martin M, Roederer M: Massive
infection and loss of memory CD4+ T cells in multiple tissues during
acute SIV infection. Nature 2005, 434:1093-1097.
23. Veazey RS, Marx PA, Lackner AA: Vaginal CD4+ T cells express high levels
of CCR5 and are rapidly depleted in simian immunodeficiency virus
infection. J Infect Dis 2003, 187:769-776.
24. Veazey RS, Mansfield KG, Tham IC, Carville AC, Shvetz DE, Forand AE,
Lackner AA: Dynamics of CCR5 expression by CD4(+) T cells in lymphoid
tissues during simian immunodeficiency virus infection. J Virol 2000,
74:11001-11007.
25. Veazey RS, DeMaria M, Chalifoux LV, Shvetz DE, Pauley DR, Knight HL,
Rosenzweig M, Johnson RP, Desrosiers RC, Lackner AA: Gastrointestinal
tract as a major site of CD4+ T cell depletion and viral replication in SIV
infection. Science 1998, 280:427-431.
26. Mehandru S, Poles MA, Tenner-Racz K, Horowitz A, Hurley A, Hogan C,
Boden D, Racz P, Markowitz M: Primary HIV-1 infection is associated with
preferential depletion of CD4+ T lymphocytes from effector sites in the
gastrointestinal tract. J Exp Med 2004, 200:761-770.
27. Hazenberg MD, Otto SA, van Benthem BH, Roos MT, Coutinho RA,
Lange JM, Hamann D, Prins M, Miedema F: Persistent immune activation
in HIV-1 infection is associated with progression to AIDS. AIDS 2003,
17:1881-1888.
28. Orendi JM, Bloem AC, Borleffs JC, Wijnholds FJ, de Vos NM, Nottet HS,
Visser MR, Snippe H, Verhoef J, Boucher CA: Activation and cell cycle
antigens in CD4+ and CD8+ T cells correlate with plasma human
immunodeficiency virus (HIV-1) RNA level in HIV-1 infection. J Infect Dis
1998, 178:1279-1287.
29. Muhl T, Krawczak M, Ten Haaft P, Hunsmann G, Sauermann U: MHC class I
alleles influence set-point viral load and survival time in simian
immunodeficiency virus-infected rhesus monkeys. J Immunol 2002,
169:3438-3446.
30. Letvin NL, Schmitz JE, Jordan HL, Seth A, Hirsch VM, Reimann KA,
Kuroda MJ: Cytotoxic T lymphocytes specific for the simian
immunodeficiency virus. Immunol Rev 1999, 170:127-134.
31. Fahey JL, Taylor JM, Manna B, Nishanian P, Aziz N, Giorgi JV, Detels R:
Prognostic significance of plasma markers of immune activation, HIV
viral load and CD4 T-cell measurements. AIDS
1998, 12:1581-1590.
32. Sousa AE, Carneiro J, Meier-Schellersheim M, Grossman Z, Victorino RM:
CD4 T cell depletion is linked directly to immune activation in the
pathogenesis of HIV-1 and HIV-2 but only indirectly to the viral load.
J Immunol 2002, 169:3400-3406.
33. Almeida JR, Price DA, Papagno L, Arkoub ZA, Sauce D, Bornstein E,
Asher TE, Samri A, Schnuriger A, Theodorou I, et al: Superior control of
HIV-1 replication by CD8+ T cells is reflected by their avidity,
polyfunctionality, and clonal turnover. J Exp Med 2007, 204:2473-2485.
34. Betts MR, Nason MC, West SM, De Rosa SC, Migueles SA, Abraham J,
Lederman MM, Benito JM, Goepfert PA, Connors M, et al: HIV
nonprogressors preferentially maintain highly functional HIV-specific
CD8+ T cells. Blood 2006, 107:4781-4789.
35. Boaz MJ, Waters A, Murad S, Easterbrook PJ, Vyakarnam A: Presence of HIV-
1 Gag-specific IFN-gamma+IL-2+ and CD28+IL-2+ CD4 T cell responses
is associated with nonprogression in HIV-1 infection. J Immunol 2002,
169:6376-6385.
36. Betts MR, Casazza JP, Koup RA: Monitoring HIV-specific CD8+ T cell
responses by intracellular cytokine production. Immunol Lett 2001,
79:117-125.
37. Schmitz JE, Kuroda MJ, Santra S, Sasseville VG, Simon MA, Lifton MA, Racz P,
Tenner-Racz K, Dalesandro M, Scallon BJ, et al: Control of viremia in simian
immunodeficiency virus infection by CD8+ lymphocytes. Science 1999,
283:857-860.
38. Friedrich TC, Valentine LE, Yant LJ, Rakasz EG, Piaskowski SM, Furlott JR,
Weisgrau KL, Burwitz B, May GE, Leon EJ, et al: Subdominant CD8+ T-cell
responses are involved in durable control of AIDS virus replication.
J Virol 2007, 81:3465-3476.
39. Finzi D, Blankson J, Siliciano JD, Margolick JB, Chadwick K, Pierson T,
Smith K, Lisziewicz J, Lori F, Flexner C, et al: Latent infection of CD4+ T
cells provides a mechanism for lifelong persistence of HIV-1, even in
patients on effective combination therapy. Nat Med 1999, 5:512-517.
40. Ling B, Veazey RS, Hart M, Lackner AA, Kuroda M, Pahar B, Marx PA: Early
restoration of mucosal CD4 memory CCR5 T cells in the gut of SIV-infected
rhesus predicts long term non-progression. AIDS 2007, 21:2377-2385.
41. Nishimura Y, Igarashi T, Buckler-White A, Buckler C, Imamichi H, Goeken RM,
Lee WR, Lafont BA, Byrum R, Lane HC, et al: Loss of naive cells
accompanies memory CD4+ T-cell depletion during long-term
progression to AIDS in Simian immunodeficiency virus-infected
macaques. J Virol 2007, 81:893-902.
42. Giorgi JV, Hultin LE, McKeating JA, Johnson TD, Owens B, Jacobson LP,
Shih R, Lewis J, Wiley DJ, Phair JP, et al: Shorter survival in advanced
human immunodeficiency virus type 1 infection is more closely
associated with T lymphocyte activation than with plasma virus burden
or virus chemokine coreceptor usage. J Infect Dis 1999, 179:859-870.
43. Schultheiss T, Stolte-Leeb N, Sopper S, Stahl-Hennig C:
Flow cytometric
characterization of the lymphocyte composition in a variety of mucosal
tissues in healthy rhesus macaques. J Med Primatol 2010.
44. De Rosa SC, Lu FX, Yu J, Perfetto SP, Falloon J, Moser S, Evans TG, Koup R,
Miller CJ, Roederer M: Vaccination in humans generates broad T cell
cytokine responses. J Immunol 2004, 173:5372-5380.
45. Ferre AL, Hunt PW, Critchfield JW, Young DH, Morris MM, Garcia JC,
Pollard RB, Yee HF Jr, Martin JN, Deeks SG, Shacklett BL: Mucosal immune
responses to HIV-1 in elite controllers: a potential correlate of immune
control. Blood 2009, 113:3978-3989.
46. Ferre AL, Lemongello D, Hunt PW, Morris MM, Garcia JC, Pollard RB, Yee HF
Jr, Martin JN, Deeks SG, Shacklett BL: Immunodominant HIV-specific CD8+
T-cell responses are common to blood and gastrointestinal mucosa, and
Gag-specific responses dominate in rectal mucosa of HIV controllers.
J Virol 2010, 84:10354-10365.
47. Ferre AL, Hunt PW, McConnell DH, Morris MM, Garcia JC, Pollard RB, Yee HF
Jr, Martin JN, Deeks SG, Shacklett BL: HIV controllers with HLA-DRB1*13
and HLA-DQB1*06 alleles have strong, polyfunctional mucosal CD4+
T-cell responses. J Virol 2010, 84:11020-11029.
48. Sauermann U, Siddiqui R, Suh YS, Platzer M, Leuchte N, Meyer H, Matz-
Rensing K, Stoiber H, Nurnberg P, Hunsmann G, et al: Mhc class I
haplotypes associated with survival time in simian immunodeficiency
virus (SIV)-infected rhesus macaques. Genes Immun 2008, 9:69-80.
49. Suh YS, Park KS, Sauermann U, Franz M, Norley S, Wilfingseder D, Stoiber H,
Fagrouch Z, Heeney J, Hunsmann G, et al: Reduction of viral loads by
multigenic DNA priming and adenovirus boosting in the SIVmac-
macaque model. Vaccine 2006, 24:1811-1820.
50. Kuate S, Stahl-Hennig C, Stoiber H, Nchinda G, Floto A, Franz M,
Sauermann U, Bredl S, Deml L, Ignatius R, et al: Immunogenicity and
efficacy of immunodeficiency virus-like particles pseudotyped with the
G protein of vesicular stomatitis virus. Virology 2006, 351:133-144.
51. Negri DR, Baroncelli S, Catone S, Comini A, Michelini Z, Maggiorella MT,
Sernicola L, Crostarosa F, Belli R, Mancini MG, et al: Protective efficacy of a
multicomponent vector vaccine in cynomolgus monkeys after intrarectal
simian immunodeficiency virus challenge. J Gen Virol 2004, 85:1191-1201.
doi:10.1186/1742-4690-8-24
Cite this article as: Schultheiss et al.: Strong mucosal immune responses
in SIV infected macaques contribute to viral control and preserved CD4
+ T-cell levels in blood and mucosal tissues. Retrovirology 2011 8:24.
Schultheiss et al. Retrovirology 2011, 8:24
/>Page 13 of 13