Environmental Soil Chemistry - Chapter 8 doc
Bạn đang xem bản rút gọn của tài liệu. Xem và tải ngay bản đầy đủ của tài liệu tại đây (301.78 KB, 22 trang )
245
8
Redox Chemistry
of Soils
Oxidation–Reduction Reactions and Potentials
S
oil chemical reactions involve some combination of proton and
electron transfer. Oxidation occurs if there is a loss of electrons in the
transfer process while reduction occurs if there is a gain of electrons.
The oxidized component or oxidant is the electron acceptor and the reduced
component or reductant is the electron donor. Table 8.1 lists oxidants
and reductants found in natural environments. The electrons are not free in
the soil solution; thus the oxidant must be in close contact with the
reductant. Both oxidation and reduction must be considered to completely
describe oxidation–reduction (redox) reactions (Bartlett and James, 1993;
Patrick et al., 1996).
To determine if a particular reaction will occur (i.e., the Gibbs free
energy for the reaction, ΔG
r
<0), one can write reduction and oxidation half-
reactions (a half-reaction or half-cell reaction can be referred to as a redox
couple) and calculate equilibrium constants for the half-reactions. Redox
reactions of soil oxidants can be defined conventionally by the general half-
reduction reaction (Patrick et al., 1996)
Ox + mH
+
+ ne
–
→ Red, (8.1)
where Ox is the oxidized component or the electron acceptor, Red is the
reduced component or electron donor, m is the number of hydrogen ions
participating in the reaction, and n is the number of electrons involved in the
reaction. The electrons in Eq. (8.1) must be supplied by an accompanying
oxidation half-reaction. For example, in soils, soil organic matter is the
primary source of electrons. Thus, to completely describe a redox reaction,
an oxidation reaction must balance the reduction reaction.
Let us illustrate these concepts for the redox reaction of Fe(OH)
3
reduction (Patrick et al., 1996):
4Fe(OH)
3
+ 12H
+
+ 4e
–
→ 4 Fe
2+
+ 12H
2
O (reduction) (8.2)
CH
2
O + H
2
O → CO
2
+ 4H
+
+ 4e
–
(oxidation) (8.3)
4 Fe(OH)
3
+ CH
2
O + 8H
+
→ 4 Fe
2+
+ CO
2
+ 11H
2
O (net reaction), (8.4)
where CH
2
O is soil organic matter. Equation (8.2) represents the reduction
half-reaction and Eq. (8.3) represents the oxidation half-reaction.
The reduction (Eq. (8.2)) reaction can also be described by calculating ΔG
r
,
the Gibbs free energy for the reaction,
ΔG
r
= ΔG
r
o
+ RT ln (Red)/(Ox)(H
+
)
m
, (8.5)
where ΔG
r
o
is the standard free energy change for the reaction. The Nernst
equation can be employed to express the reduction reaction in terms of
electrochemical energy (millivolts) using the expression ΔG
r
= –nFE such
that (Patrick et al., 1996)
Eh = E° – RT/nF ln(Red)/(Ox) + mRT/nF ln H
+
, (8.6)
where Eh is the electrode potential, or in the case of the reduction half-
reaction in Eq. (8.2), a reduction potential, E° is the standard half-reaction
reduction potential (with each half-reaction, for example, Eqs. (8.2) and
(8.3), there is a standard potential; the standard potential means the activities
of all reactants and products are unity), F is the Faraday constant, n is the
number of electrons exchanged in the half-cell reaction, m is the number of
protons exchanged, and the activities of the oxidized and reduced species are
in parentheses. Determination of Eh will provide quantitative information
on electron availability and can be either an oxidation or reduction potential
depending on how the reaction is written (see Eqs. (8.2)–(8.3)). Oxidation
potentials are more often used in chemistry, while in soil chemistry reduction
potentials are more frequently used to describe soil and other natural systems
(Patrick et al., 1996). It should also be pointed out that the Nernst equation
is valid for predicting the activity of oxidized and reduced species only if the
system is at equilibrium, which is seldom the case for soils and sediments.
As noted in Chapter 7, the heterogeneity of soils which promotes transport
processes causes many soil chemical reactions to be very slow. Thus, it is
difficult to use Eh values to quantitatively measure the activities of oxidized
and reduced species for such heterogeneous systems (Bohn, 1968).
246 8 Redox Chemistry of Soils
Oxidation–Reduction Reactions and Potentials 247
TABLE 8.1. Selected Reduction Half-Reactions Pertinent to Soil, Natural Water, Plant, and
Microbial Systems
a
pe
c
Half-reaction log K °
b
pH 5 pH 7
Nitrogen species
1/2N
2
O + e
–
+ H
+
= 1/2N
2
+ 1/2H
2
O 29.8 22.9 20.9
NO + e
–
+ H
+
= 1/2N
2
O + 1/2H
2
O 26.8 19.8 17.8
1/2NO
2
–
+ e
–
+ 3/2H
+
= 1/4N
2
O + 3/4H
2
O 23.6 15.1 12.1
1/5 NO
3
–
+ e
–
+ 6/5H
+
= 1/10N
2
+ 3/5H
2
O 21.1 14.3 11.9
NO
2
–
+ e
–
+ 2H
+
= NO + H
2
O 19.8 9.8 5.8
1/4NO
3
–
+ e
–
+ 5/4H
+
= 1/8N
2
O + 5/8H
2
O 18.9 12.1 9.6
1/6NO
2
–
+ e
–
+ 4/3H
+
= 1/6NH
4
+
+ 1/3H
2
O 15.1 8.4 5.7
1/8NO
3
–
+ e
–
+ 5/4H
+
= 1/8NH
4
+
+ 3/8H
2
O 14.9 8.6 6.1
1/2NO
3
–
+ e
–
+ H
+
= 1/2NO
2
–
+ 1/2H
2
O 14.1 9.1 7.1
1/6NO
3
–
+ e
–
+ 7/6H
+
= 1/6NH
2
OH + 1/3H
2
O 11.3 5.4 3.1
1/6N
2
+ e
–
+ 4/3H
+
= 1/3NH
4
+
4.6 –0.7 –3.3
Oxygen species
1/2O
3
+ e
–
+ H
+
= 1/2O
2
+ 1/2H
2
O 35.1 28.4 26.4
OH· + e
–
= OH
–
33.6 33.6 33.6
O
2
–
+ e
–
+ 2H
+
= H
2
O
2
32.6 22.6 18.6
1/2H
2
O
2
+ e
–
+ H
+
= H
2
O 30.0 23.0 21.0
1/4O
2
+ e
–
+ H
+
= 1/2H
2
O 20.8 15.6 13.6
1/2O
2
+ e
–
+ H
+
= 1/2H
2
O
2
11.6 8.2 6.2
O
2
+ e
–
= O
2
–
–9.5 –6.2 –6.2
Sulfur species
1/8SO
4
2–
+ e
–
+ 5/4H
+
= 1/8H
2
S + 1/2H
2
O 5.2 –1.0 –3.5
1/2SO
4
2–
+ e
–
+ 2H
+
= 1/2SO
2
+ H
2
O 2.9 –7.1 –11.1
Iron and manganese compounds
1/2Mn
3
O
4
+ e
–
+ 4H
+
= 3/2Mn
2+
+ 2H
2
O 30.7 16.7 8.7
1/2Mn
2
O
3
+ e
–
+ 3H
+
= Mn
2+
+ 3/2H
2
O 25.7 14.7 8.7
Mn
3+
+ e
–
= Mn
2+
25.5 25.5 25.5
γMnOOH + e
–
+ 3H
+
= Mn
2+
+ 2H
2
O 25.4 14.4 8.4
0.62MnO
1.8
+ e
–
+ 2.2H
+
= 0.62Mn
2+
+ 1.1H
2
O 22.1 13.4 8.9
1/2Fe
3
(OH)
8
+ e
–
+ 4H
+
= 3/2Fe
2+
+ 4H
2
O 21.9 7.9 –0.1
1/2MnO
2
+ e
–
+ 2H
+
= 1/2Mn
2+
+ H
2
O 20.8 12.8 8.8
[Mn
3+
(PO
4
)
2
]
3–
+ e
–
= [Mn
2+
(PO
4
)
2
]
4–
20.7 20.7 20.7
Fe(OH)
2
+
+ e
–
+ 2H
+
= Fe
2+
+ 2H
2
O 20.2 10.2 6.2
1/2Fe
3
O
4
+ e
–
+ 4H
+
= 3/2Fe
2+
+ 2H
2
O 17.8 3.9 –4.1
MnO
2
+ e
–
+ 4H
+
= Mn
3+
+ 2H
2
O 16.5 0.54 –7.5
Fe(OH)
3
+ e
–
+ 3H
+
= Fe
2+
+ 3H
2
O 15.8 4.8 –1.2
Fe(OH)
2+
+ e
–
+ H
+
= Fe
2+
+ H
2
O 15.2 10.2 8.2
1/2Fe
2
O
3
+ e
–
+ 3H
+
= Fe
2+
+ 3/2H
2
O 13.4 2.4 –3.6
FeOOH + e
–
+ 3H
+
= Fe
2+
+ 2H
2
O 13.0 2.0 –4.0
Fe
3+
+ e
–
= Fe
2+
phenanthroline 18.0 —
d
—
Fe
3+
+ e
–
= Fe
2+
13.0 13.0 13.0
Fe
3+
+ e
–
= Fe
2+
acetate — 5.8 —
Fe
3+
+ e
–
= Fe
2+
malonate — 4.4 (pH 4) —
Fe
3+
+ e
–
= Fe
2+
salicylate — 4.4 (pH 4) —
Fe
3+
+ e
–
= Fe
2+
hemoglobin — — 2.4
Fe
3+
+ e
–
= Fe
2+
cyt b
3
(plants) — — 0.68
Fe
3+
+ e
–
= Fe
2+
oxalate — — 0.034
Fe
3+
+ e
–
= Fe
2+
pyrophosphate –2.4 — —
Fe
3+
+ e
–
= Fe
2+
peroxidase — — –4.6
Fe
3+
+ e
–
= Fe
2+
ferredoxin (spinach) — — –7.3
1/3KFe
3
(SO
4
)
2
(OH)
6
+ e
–
+ 2H
+
= Fe
2+
+ 2H
2
O + 2/3SO
4
2–
+ 1/3K
+
8.9 6.9 2.9
[Fe(CN)
6
]
3–
+ e
–
= [Fe(CN)
6
]
4–
— — 6.1
248 8 Redox Chemistry of Soils
TABLE 8.1. Selected Reduction Half-Reactions Pertinent to Soil, Natural Water, Plant, and
Microbial Systems
a
(contd)
pe
c
Half-reaction log K °
b
pH 5 pH 7
Carbon species
1/2CH
3
OH + e
–
+ H
+
= 1/2CH
4
+ 1/2H
2
O 9.9 4.9 2.9
1/2o-quinone + e
–
+ H
+
= 1/2diphenol — — 5.9
1/2p-quinone + e
–
+ H
+
= 1/2hydroquinone — — 4.7
1/12C
6
H
12
O
6
+ e
–
+ H
+
= 1/4C
2
H
5
OH + 1/4H
2
O 4.4 0.1 –1.9
Pyruvate + e
–
+ H
+
= lactate — — –3.1
1/8CO
2
+ e
–
+ H
+
= 1/8CH
4
+ 1/4H
2
O 2.9 –2.1 –4.1
1/2CH
2
O + e
–
+ H
+
= 1/2CH
3
OH 2.1 –2.9 –4.9
1/2HCOOH + e
–
+ H
+
= 1/2CH
2
O + 1/2H
2
O 1.5 –3.5 –5.5
1/4CO
2
+ e
–
+ H
+
= 1/24C
6
H
12
O
6
+ 1/4H
2
O –0.21 –5.9 –7.9
1/2deasc + e
–
+ H
+
= 1/2asc 1.0 –3.5 –5.5
1/4CO
2
+ e
–
+ H
+
= 1/4CH
2
O + 1/4H
2
O –1.2 –6.1 –8.1
1/2CO
2
+ e
–
+ H
+
= 1/2HCOOH –1.9 –6.7 –8.7
Pollutant/nutrient group
Co
3+
+ e
–
= Co
2+
30.6 30.6 30.6
1/2NiO
2
+ e
–
+ 2H
+
= 1/2Ni
2+
+ H
2
O 29.8 21.8 17.8
PuO
2
+
+ e
–
= PuO
2
26.0 22.0 22.0
1/2PbO
2
+ e
–
+ 2H
–
= 1/2Pb
2+
+ H
2
O 24.8 16.8 12.8
PuO
2
+ e
–
+ 4H
+
= Pu
3+
+ 2H
2
O 9.9 –6.1 –14.1
1/3HCrO
4
–
+ e
–
+ 4/3H
+
= 1/3Cr(OH)
3
+ 1/3H
2
O 18.9 10.9 8.2
1/2AsO
4
3–
+ e
–
+ 2H
+
= 1/2AsO
2
–
+ H
2
O 16.5 6.5 2.5
Hg
2+
+ e
–
= 1/2Hg
2
2+
15.4 13.4 13.4
1/2MoO
4
2–
+ e
–
+ 2H
+
= 1/2MoO
2
+ H
2
O 15.0 3.0 –1.0
1/2SeO
4
2–
+ e
–
+ H
+
= 1/2SeO
3
2–
+ 1/2H
2
O 14.9 9.9 7.9
1/4SeO
3
2–
+ e
–
+ 3/2H
+
= 1/4Se + 3/4H
2
O 14.8 6.3 3.3
1/6SeO
3
2–
+ 4/3H
+
= 1/6H
2
Se + 1/2H
2
O 7.62 1.0 –1.7
1/2VO
2
+
+ e
–
+ 1/2 H
3
O
+
= 1/2 V (OH)
3
6.9 2.4 1.4
Cu
2+
+ e
–
= Cu
+
2.6 2.6 2.6
PuO
2
+ e
–
+ 3H
+
= PuOH
2+
+ H
2
O 2.9 –8.1 –14.1
Analytical couples
CeO
2
+ e
–
+ 4H
+
= Ce
3+
+ 2H
2
O 47.6 31.6 23.6
1/2ClO
–
+ e
–
+ H
+
= 1/2Cl
–
+ 1/2H
2
O 29.0 24.0 22.0
HClO + e
–
= 1/2Cl
2
+ H
2
O 27.6 20.6 18.6
1/2Cl
2
+ e
–
= Cl
–
23.0 25.0 25.0
1/6IO
3
–
+ e
–
+ H
+
= 1/6I
–
+ 1/2H
2
O 18.6 13.6 11.6
1/2Pt(OH)
2
+ e
–
+ H
+
= 1/2Pt + H
2
O 16.6 11.6 9.6
1/2I
2
+ e
–
= I
–
9.1 11.1 11.1
1/2Hg
2
Cl
2
+ e
–
= Hg + Cl
–
4.5 3.9 3.9
e
–
+ H
+
= 1/2H
2
0 –5.0 –7
1/2PtS + e
–
+ H
+
= 1/2Pt + 1/2H
2
S –5.0 –10.0 –12.0
a
From Bartlett and James (1993), with permission.
b
Calculated for reaction as written according to Eq. (8.14). Free energy of formation data were taken from Lindsay (1979) as a primary source,
and when not available from that source, from Garrels and Christ (1965) and Loach (1976).
c
Calculated using tabulated log K
°
values, reductant and oxidant = 10
–4
M soluble ions and molecules, and activities of solid phases = 1;
partial pressures for gases that are pertinent to soils: 1.01 × 10
–4
MPa for trace gases, 2.12 × 10
–2
MPa for O
2
, 7.78 × 10
–2
MPa for N
2
, and
3.23 × 10
–5
MPa for CO
2
.
d
Values not listed by Loach (1976).
Using the values of 8.31 J K
–1
mol
–1
for R, 9.65 × 10
4
C mol
–1
for F, and
298 K for T and the relationship ln(x) = 2.303 log(x), Eq. (8.6) becomes
Eh(mV) = E° – 59/n log (Red)/(Ox) – 59 m/n pH. (8.7)
It is obvious from Eqs. (8.6)–(8.7) that Eh increases as the activity of the
oxidized species increases, decreases with increases in the activity of the
reduced species, and increases as H
+
activity increases or pH decreases. If the
ratio of protons to electrons is 1 (i.e., m/n = 1), one would predict that Eh
would change by 59 mV for every unit change in pH. Thus, one could
predict the Eh at various pH values by using the 59-mV factor. However,
this relationship assumes that redox controls the pH of the system. This
assumption is valid for solutions, but in soils pH buffering is affected by soil
components such as silicates, carbonates, and oxides, which are not involved
in redox reactions. Thus, it may be inappropriate to apply the 59-mV factor
(Patrick et al., 1996).
Eh is positive and high in strongly oxidizing systems while it is negative
and low in strongly reducing systems. (There is not a neutral point, as one
observes with pH.) Eh, like pH, is an intensity factor. The oxygen–nitrogen
range has been defined by Eh values of +250 to +100 mV, the iron range as
+100 to 0.0 mV, the sulfate range as 0.0 to –200 mV, and the methane–
hydrogen range as <200 mV (Liu and Narasimhan, 1989).
Eh vs pH and pe vs pH Diagrams
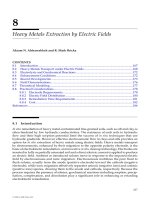
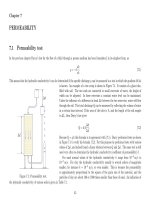
Diagrams of the activities of Eh vs pH can be very useful in delineating the
redox status of a system. Figure 8.1 shows such a diagram for soils. The pH
range was narrower in reduced soils (negative Eh) than in oxidized soils
(positive Eh). Based on these results, Baas Becking et al. (1960) divided the
soils into three categories: normal (oxidized), wet (seasonally saturated),
and waterlogged (semipermanently saturated) (Fig. 8.1).
The reduction half-reaction given in Eq. (8.1) can also be expressed in
terms of an equilibrium constant K° (Patrick et al., 1996).
K° = (Red)/(Ox)(e
–
)
n
(H
+
)
m
. (8.8)
Expressed in log form Eq. (8.8) becomes
log K° = log(Red) – log(Ox) – nlog (e
–
) – mlog (H
+
). (8.9)
The –log (e
–
) term in Eq. (8.9) is defined as pe in a similar way as pH is
expressed as –log (H
+
). The pe is an intensity factor as it is an index of the
electron free energy level per mole of electrons (Ponnamperuma, 1972).
Thus, pe and pH are master variables of a soil and must be known to
completely understand the equilibrium state of a soil. Moreover, to fully
determine the redox status of a soil, pe and pH cannot be separated (Bartlett
and James, 1993). In strongly oxidizing systems the e
–
activity is low and pe
is large and positive. In reducing systems pe is small and negative. Sposito
(1989) proposed “oxic” (oxidized) soils as those with pe >7, “suboxic” soils in
Oxidation–Reduction Reactions and Potentials 249
the pe range between +2 and +7, and “anoxic” (reduced) soils with pe <+2,
all at pH 7. These ranges are consistent with redox control by oxygen–
nitrogen, manganese–iron, and sulfur couples (James and Bartlett, 2000).
The pe range of most soils is –6 to +12 (Lindsay, 1979). Rearranging
Eq. (8.9) one arrives at an expression that relates pe to pH,
pe = [(log K° – log (Red) + log (Ox))/n] – m/n pH, (8.10)
which represents a straight line with a slope of m/n and an intercept given in
brackets. The intercept is a function of log K° for the half-reaction and the
activities of the oxidized and reduced species. When there is a one-electron
transfer (i.e., n = 1) and consumption of one proton (i.e., m = 1), and when
(Red) = (Ox), Eq. (8.10) is simplified to
pe + pH = log K°. (8.11)
At pH = 0,
pe = log K°. (8.12)
One can relate log K° to ΔG
r
o
using the equation
ΔG
r
o
= – RT ln K°. (8.13)
At 298 K and converting to log,
–ΔG
r
o
/5.71 = log K°, (8.14)
where 5.71 is derived from the product of (RT)(2.303), R is (0.008314 kJ mol
–1
K
–1
), and T = 298.15 K. Therefore, log K° could be estimated by knowing
the free energies of formation (ΔG
f
o
) of H
2
O and the Red and Ox species
since those for H
+
and e
–
are zero by convention (Bartlett and James, 1993).
Information in Box 8.1 shows how one would calculate log K° and pe
for a reduction half-reaction at pH 5 and 7 using Eqs. (8.11)–(8.14).
The values of log K° can be used to predict whether a reduction and
oxidation reaction will combine to effect the transfer of electrons from
reductant to oxidant. Table 8.1 lists a number of reduction half-reactions
important in natural systems. The log K° values are given in descending order
and are pe values at pH 0, when the activities of oxidant and reductant are 1,
and are standard reference pe values for the reactions. The larger the values
250 8 Redox Chemistry of Soils
FIGURE 8.1. Eh–pH characteristics of soils.
From Baas Becking et al. (1960),
with permission from the University of Chicago Press.
Oxidation–Reduction Reactions and Potentials 251
of log K° or pe, the greater the tendency for an oxidant (left side of the half-
reaction equation) to be reduced (converted to the right side of the half-
reaction equation). Therefore, an oxidant in a given reduction half-reaction
can oxidize the reductant in another half-reaction with a lower pe, at a
particular pH. As an example, Mn(III,IV) oxides could oxidize Cr(III) to
Cr(VI) at pH 5 because the range of pe values for reduction of Mn
(12.8–16.7) is higher than that for Cr(VI) reduction (10.9) (Bartlett and
James, 1993). In field moist soils over a pH range of 4–7 it has indeed been
observed that Mn(III,IV) oxides can oxidize Cr(III) to Cr(VI) (Bartlett and
James, 1979; James and Bartlett, 1983).
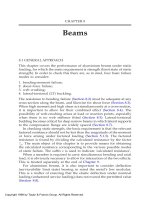
The pe–pH relationship expressed in Eq. (8.10) can be used to
determine whether an oxidation–reduction reaction can occur spontaneously,
i.e., ΔG
r
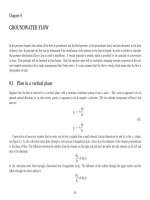
< 0. Figure 8.2 shows pe vs pH stability lines between oxidized and
reduced species for several redox couples. If thermodynamic equilibrium is
present, the oxidized form of the couple would be preferred if the pe and pH
region was above a given line and the reduced form would be favored below
a given line (Bartlett, 1986). The line for Fe is often considered the dividing
point between an aerobic (oxidized) and an anaerobic (reduced) soil.
In aerobic soils oxidized species stay oxidized even though the
thermodynamic tendency is toward reduction, as indicated by the high pe.
Below the iron line, reduced species are prevalent, even though the
thermodynamic tendency is toward oxidation. Sulfide is easily oxidized and
nitrite is easily reduced (Bartlett and James, 1993).
BOX 8.1 Calculation of log K° and pe
The reduction half-reaction below (see Table 8.1) shows the reduction of
Fe
3+
to Fe
2+
,
Fe(OH)
2+
+ e
–
+ H
+
= Fe
2+
+ H
2
O. (8.1a)
In this reaction there is one electron transfer, i.e., n in Eq. (8.8) is 1,
there is consumption of one proton, i.e., m = 1, and (Fe
3+
) = (Fe
2+
) is an
imposed condition. Thus Eq. (8.10) reduces to Eq. (8.11) and at pH 0,
Eq. (8.12) results. Relating ln K° to ΔG
r
o
, one can employ Eq. (8.13),
ΔG
r
o
= – RT ln K°.
We know from Eq. (4.7) that
ΔG
r
o
= ΣΔG
f
o
products – ΣΔG
f
o
reactants.
Solving ΔG
r
o
for Eq. (8.1a) above,
ΔG
rr
o
= [(–91.342 kJ mol
–1
) + (–237.52 kJ mol
–1
)]
– [(–241.85 kJ mol
–1
) + (0)] (8.1b)
= [–328.86 kJ mol
–1
+ 241.85 kJ mol
–1
]
= –87.01 kJ mol
–1
.
252 8 Redox Chemistry of Soils
25
20
15
10
5
0
-5
4567
8
pe
pH
Mn
3+
,Mn
4+
Mn
2+
N
2
O
(
4
.0
x
1
0
-7
M
P
a
)
N
2
(0.8 atm.)
O
2
(10
-
6
M)
H
2
O
-
O
2
-
H
2
O
2
O
2
(2.0x10
-2
M
Pa)
H
2
O
NO
2
N
2
O
MnO
2
Mn
3
O
4
Mn
2
+
(10
-
4
M)
H
C
rO
4
C
r
3
+
N
O
3
(2x10
-4
M)
-
N
O
2
(4x10
-6
M)
-
C
H
=CH
CH
2
=C
H
2
–
F
e
(O
H
)
3
F
e
2
+
(1
0
-
4
M
)
C
r
O
2
C
rO
4
–
2
-
–
C
u
+
C
u
2
+
N
2
(8.1x10
-2
M
Pa)
C
H
4
M
o
O
4
(
1
0
-
6
M
)
M
oO
2
NH
4
(10
-4
M)
+
SO
4
S
2-
O
2
O
2
–
.
MnO
2
Mn
3+
(10
-4
M)
C
H
2
=C
H
2
C
O
2
(2.0x10
-3
M
Pa)
glucose (.01M
)
.
.
2
-
2
-
-
Using Eq. (8.14),
log K° =
87.01
= 15.2. (8.1c)
5.71
This value for log K° is the one shown in Table 8.1 for the reaction in
Eq. (8.1a).
To calculate pe at pH 5 and pH 7, one would use Eq. (8.11). For
pH 5 and substituting in the value of 15.2 for log K°,
pe = log K° – pH
pe = 15.2 – 5 = 10.2.
For pH 7,
pe = 15.2 – 7 = 8.2.
These are the pe values shown in Table 8.1 for the reduction half-reaction
in Eq. (8.1a).
FIGURE 8.2. Stability lines between oxidized and reduced species for several redox
couples. Solid phases of Mn and Fe are at unit activity and the activities of other species are
designated if not equal within a couple. Reprinted with permission from Bartlett (1986).
Copyright CRC Press, Boca Raton, FL.
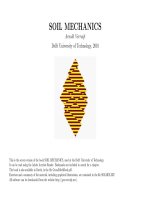
Figure 8.3 illustrates a pe–pH diagram for several Mn species. One sees
that Mn oxides can oxidize Pu(III) to Pu(IV), V(III) to V(V), As(III) to
As(V), Se(IV) to Se(VI), and Cr(III) to Cr(VI), because the pe for each of
these couples is below the pe for Mn oxides. It has been shown that Mn
oxides in soils can indeed effect oxidation of Pu(III), As(III), Se(IV), and, as
noted earlier, Cr(III) (Bartlett and James, 1979; Bartlett, 1981; Amacher and
Baker, 1982; Moore et al., 1990). The environmental aspects of some of these
oxidation processes are discussed later in this chapter.
Another term often used in studying redox chemistry of soils is poise.
The poise of a redox system is the resistance to change in redox potential with
the addition of small amounts of oxidant or reductant. Poise increases with
the total concentration of oxidant plus reductant, and for a fixed total
concentration it reaches a maximum when the ratio of oxidant to reductant
is 1 (Ponnamperuma, 1955).
Measurement and Use of Redox Potentials
Measurement of redox potentials in soils is usually done with a platinum
electrode. This electrode will transfer electrons to or from the medium, but
it should not react with the medium. Once the platinum electrode is
combined with a half-cell of known potential, reducing systems will transfer
electrons to the electrode while oxidizing systems will remove electrons from
the electrode. When experimental redox potential measurements are done,
there is no electron flow and the potential between the half-cell composed of
the platinum in contact with the medium and the known potential of the
reference electrode half-cell is determined with a meter that reacts to the
electromotive force or potential (Patrick et al., 1996). A number of investigators
have noted that measurement of redox potentials in aerated soils is questionable
due to the lack of poising of reduction–oxidation systems that are well aerated
and have plentiful quantities of oxygen (Ponnamperuma, 1955). Soil atmospheric
oxygen measurements are preferred to characterize well-aerated soils. Thus,
redox measurements are most reliable for flooded soils and sediments.
Measurement and Use of Redox Potentials 253
35
25
15
5
-5
-15
01 2345678910
Co(III,II)
Cr(VI,III)
Pu(IV,III)
Mn
2+
Mn
3+
MnO
2
H
2
O
O
2
Mn
3
O
4
MnO
2
Mn
3+
Mn
2+
H
2
O
H
2
pe
pH
Se(VI,IV)
As(V,III)
V(V,III)
FIGURE 8.3. A pe–pH diagram for Mn
3+
, MnO
2
, and Mn
3
O
4
;
as compared with reduction between pH 5 and 7 for Co, Cr, Se, As,
V, and Pu. Activity for ionic species is 10
–4
M. From Bartlett and
James (1993), with permission.
254 8 Redox Chemistry of Soils
Redox potentials can be very useful in characterizing the oxidation–
reduction status of a soil. Oxidized soils have redox potentials of +400 to
+700 mV. Seasonally saturated soils have redox potentials of +400 to +700
mV (oxidized) to highly reduced (–250 to –300 mV) (Patrick et al., 1996).
Redox potentials can help one predict when reducing conditions will begin
due to depletion of oxidants such as oxygen and nitrate, and the initiation of
oxidizing conditions when oxygen is reintroduced in the soil. Redox
potentials can also provide information on conditions that are favorable for
increased bioavailability of heavy metals (Gambrell et al., 1977; Reddy and
Patrick, 1977), changes in plant metabolism (Mendelssohn et al., 1981),
distribution of plant species (Josselyn et al., 1990), and location of wetlands
(Faulkner et al., 1989).
If redox potential data are combined with other information such as
depth to the water table and oxygen content of the soil, even more accurate
information can be gleaned about the wetness of an environment. In nonwetland
environments the Eh and oxygen content do not change much during the
year. Transitional areas may be either oxidized or reduced as the water table
rises and falls. The redox potentials are low until after the water is drained
and oxygen moves through the soil. Wetland sites that have low redox have
had long periods of flooding and soil saturation (Patrick et al., 1996).
Redox data are also useful in understanding the morphology and genesis
of the soil. The color of a soil and the degree of mottling (spots or blotches
of different colors or shades of color interspersed with the dominant color;
Glossary of Soil Science Terms, 1997) can reveal much about the soil’s
moisture status. Both color and mottling depend on the redox chemistry of
Fe in the soil. When the soil is saturated for long times Fe oxides are reduced
under low redox potentials, and the soil will exhibit a gray color. Soils that
undergo alternate oxidation and reduction cycles are usually mottled (Patrick
et al., 1996).
Submerged Soils
Submerged soils are reduced and they have a low oxidation–reduction
potential (Ponnamperuma, 1972). When an aerobic soil is submerged, the
Eh decreases for the first few days and reaches a minimum; then it increases,
reaches a maximum, and then decreases again to a value characteristic of the
soil, usually after 8–12 weeks of submergence (Ponnamperuma, 1955,
1965). The magnitude and rate of the Eh decrease depend on the kind and
amount of soil organic matter (SOM), the nature and content of e
–
acceptors, temperature, and period of submergence. Native or added SOM
enhances the first Eh minimum, while nitrate causes the minimum to
disappear. Temperatures above and below 298 K slow the Eh decrease but the
retardation varies with the soil. It is greatest in acid soils and not observable
in neutral soils with high SOM.
Redox Reactions Involving Inorganic and Organic Pollutants 255
Ponnamperuma and Castro (1964) and Ponnamperuma (1965) have
listed the effects of soil properties on Eh changes in submerged soils as follows:
soils high in nitrate, with more than 275 mg kg
–1
NO
3
–
, exhibit positive
potentials for several weeks after submergence; soils low in SOM (<1.5%) or
high in Mn (>0.2%) have positive potentials even 6 months after submergence;
soils low in active Mn and Fe (sandy soils) with more than 3% SOM reach
Eh values of –0.2 to –0.3 V within 2 weeks of submergence; and stable
potentials of 0.2 to –0.3 V are attained after several weeks of submergence.
Redox Reactions Involving Inorganic and Organic
Pollutants
As noted in Chapter 2, metal oxides/hydroxides, e.g., Fe(III) and
Mn(III/IV), are quite common in soils and sediments as suspended particles
and as coatings on clay mineral surfaces. Manganese(III/IV), Fe(III), Co(III),
and Pb(IV) oxides/hydroxides are thermodynamically stable in oxygenated
systems at neutral pH. However, under anoxic conditions, reductive
dissolution of oxides/hydroxides by reducing agents occurs as shown below
for MnOOH and MnO
2
(Stone, 1991):
Mn(III)OOH(s) + 3H
+
+ e
–
= Mn
2+
+ 2H
2
O E° = + 1.50 V (8.15)
Mn(IV)O
2
(s) + 4H
+
+ 2e
–
= Mn
2+
+ 2H
2
O E° = + 1.23 V. (8.16)
Changes in the oxidation state of the metals associated with the oxides above
can greatly affect their solubility and mobility in soil and aqueous
environments. The reductants can be either inorganic or organic.
There are a number of natural and xenobiotic organic functional groups
that are good reducers of oxides and hydroxides. These include carboxyl,
carbonyl, phenolic, and alcoholic functional groups of SOM. Microorganisms
in soils and sediments are also examples of organic reductants. Stone (1987a)
showed that oxalate and pyruvate, two microbial metabolites, could reduce
and dissolve Mn(III/IV) oxide particles. Inorganic reductants include As(III),
Cr(III), and Pu(III).
Table 8.2 gives standard reduction potentials (E°) for oxide/hydroxide
minerals at a metal concentration of 1.0 M and potentials (E°
′
) determined
under more normal environmental conditions of pH 7 and a metal
concentration of 1 × 10
–6
M. Oxidant strength decreases in the order
Mn(III,IV) oxides > Co(III) oxides > Fe(III) oxides. The Fe oxides are more
difficult to reduce than Mn(III,IV) oxides. Thus Fe(II) is easier to oxidize
than Mn(II). Reduction potentials for oxidation of some important organic
half-reduction reactions are provided in Table 8.3.
If the potential of the oxidant half-reaction is higher than the reductant
half-reaction potential, then the overall reaction is thermodynamically
favored. Thus, comparing E°
′
values in Tables 8.2 and 8.3, one observes that
256 8 Redox Chemistry of Soils
Mn(III/IV) oxides can oxidize hydroquinone, ascorbate, bisulfide, and
oxalate under the specified conditions. Goethite and hematite could only
oxidize oxalate; they are not strong enough oxidants to oxidize hydrogen
sulfide, ascorbate, or hydroquinone. At pH 4 the Fe(III) oxides can oxidize
all of the reductants listed in Table 8.3 (Stone, 1991). Manganese (III/IV)
oxides can react with many organic compounds over a wide pH range
while reactions with Fe(III) oxides are not thermodynamically stable at
neutral and alkaline pH’s and with organic compounds that are slightly
reduced (Stone, 1991).
TABLE 8.2. Reduction Half-Reactions Along with Standard Reduction Potentials (E°) and
Reduction Potentials Calculated under More Realistic Environmental Conditions (E°′) for Mineral
Phases Containing Mn(IV), Mn(III), Fe(III), and Co(III)
a
E°
b
(V) E°′
c
(V)
Vernadite (Bricker, 1965)
1/2 Mn(IV) O
2
(s) + 2H
+
+ e
–
= 1/2Mn
2+
+ H
2
O +1.29 +0.64
Manganite (Bricker, 1965)
Mn(III) OOH(s) + 3H
+
+ e
–
= Mn
2+
+ 2H
2
O +1.50 +0.61
Goethite (Robie et al., 1978)
Fe(III) OOH(s) + 3H
+
+ e
–
= Fe
2+
+ 2H
2
O +0.67 –0.22
Hematite (Robie et al., 1978)
1/2Fe(III) O
3
(s) + 3H
+
+ e
–
= Fe
2+
+ 3/2H
2
O +0.66 –0.23
Magnetite (Robie et al., 1978)
1/2Fe
2
(III) Fe(II) O
4
(s) + 4H
+
+ e
–
= 3/2 Fe
2+
+ 2H
2
O +0.90 –0.23
Cobalt hydroxide oxide (crystalline) (Hem et al., 1985)
Co(III) OOH(s) + 3H
+
+ e
–
= Co
2+
+ 2H
2
O +1.48 +0.23
a
From Stone (1991), with permission.
b
E° = standard reduction potential ([I] = 1.0 M).
c
E°′ = Reduction potential under the following conditions: [H
+
] = 1.0 × 10
–7
M; [M
2+
] = 1.0 × 10
–6
M.
TABLE 8.3. Reduction Half-Reactions Along with Standard Reduction Potentials (E°) and
Reduction Potentials Calculated under More Realistic Environmental Conditions (E°´) for Several
Organic Compounds
a,b
E°
c
(V) E°′
d
(V)
Hydroquinone
p-Benzoquinone + 2H
+
+ 2e
–
= hydroquinone 0.699 0.196
Ascorbate
Dehydroascorbate + 2H
+
+ 2e
–
= ascorbate 0.40 –0.103
Hydrogen sulfide
S°(s) + H
+
+ e
–
= HS
–
–0.062 –0.17
Oxalate
2HCO
3
–
+ 2H
+
+ 2e
–
= –OOC–COO
–
+ 2H
2
O –0.18 –0.69
a
From Stone (1991), with permission.
b
Using thermodynamic data compiled in Latimer (1952) and Stone and Morgan (1984b).
c
E° = standard reduction potential ([I] = 1.0 M).
d
E°′ = Reduction potential under the following conditions: [H
+
] = 1.0 × 10
–7
M; reductant concentration = 1.0 × 10
–3
M; oxidant
concentration = 1.0 × 10
–6
M; C
T
(total dissolved carbonate) = 1.0 × 10
–3
M.
Redox Reactions Involving Inorganic and Organic Pollutants 257
Mechanisms for Reductive Dissolution of Metal
Oxides/Hydroxides
The reductive dissolution of metal oxides/hydroxides occurs in the following
sequential steps (Stone, 1986, 1991): (1) diffusion of the reductant
molecules to the oxide surface, (2) surface chemical reaction, and (3) release
of reaction products and diffusion away from the oxide surface. Steps (1) and
(3) are transport steps. The rate-controlling step in reductive dissolution of
oxides appears to be surface chemical reaction control. Reductive dissolution
can be described by both inner- and outer-sphere complex mechanisms that
involve (A) precursor complex formation, (B) electron transfer, and (C)
breakdown of the successor complex (Fig. 8.4). Inner- and outer-sphere
precursor complex formations are adsorption reactions that increase the
density of reductant molecules at the oxide surface, which promotes electron
transfer (Stone, 1991). In the inner-sphere mechanism, the reductant enters
the inner coordination sphere via ligand exchange and bonds directly to
the metal center prior to electron transfer. With the outer-sphere complex,
the inner coordination sphere is left intact and electron transfer is enhanced
by an outer-sphere precursor complex (Stone, 1986). Kinetic studies
have shown that high rates of reductive dissolution are favored by high
rates of precursor complex formation, i.e., large k
1
and k
–1
values, high
electron transfer rates, i.e., large k
2
, and high rates of product release, i.e.,
high k
3
(Fig. 8.4).
Specifically adsorbed cations and anions may reduce reductive
dissolution rates by blocking oxide surface sites or by preventing release of
Mn(II) into solution. Stone and Morgan (1984a) showed that PO
4
3–
inhibited the reductive dissolution of Mn(III/IV) oxides by hydroquinone.
Addition of 10
–2
M PO
4
3–
at pH 7.68 caused the dissolution rate to be only
25% of the rate when PO
4
3–
was not present. Phosphate had a greater effect
than Ca
2+
.
(A) Precursor
Complex
Formation
(B) Electron
Transfer
(C) Breakdown
of Successor
Complex
M
III
(H
2
O)
6
3+
+ HA
k
1
k
-1
M
III
(A) (H
2
O)
5
2+
+ H
3
O
+
Inner-Sphere Outer-Sphere
M
III
(H
2
O)
6
3+
+ HA
k
1
k
-1
M
III
(H
2
O)
6
3+
, HA
M
III
(A) (H
2
O)
5
2+
k
2
k
-2
M
II
(•A) (H
2
O)
5
2+
M
III
(H
2
O)
6
3+
, HA
k
-2
M
II
(H
2
O)
6
2+
, A• + H
+
k
2
M
II
(•A) (H
2
O)
5
2+
+H
2
O
k
3
k
-3
M
II
(H
2
O)
6
2+
+ A• M
II
(H
2
O)
6
2+
, A•
k
3
k
-3
M
II
(H
2
O)
6
2+
+ A•
FIGURE 8.4. Reduction of M(H
2
O)
6
3+
by phenol (HA) in homogeneous solution. Reprinted from Stone
(1986). Copyright 1986 American Chemical Society.
258 8 Redox Chemistry of Soils
Oxidation of Inorganic Pollutants
As mentioned earlier, Mn oxides can oxidize a number of environmentally
important ions that can be toxic to humans and animals. Chromium and
plutonium are similar in their chemical behavior in aqueous settings (Rai and
Serne, 1977; Bartlett and James, 1979). They can exist in multiple oxidation
states and as both cationic and anionic species. Chromium (III) is quite
stable and innocuous, and occurs as Cr
3+
and its hydrolysis products or as
CrO
2
–
. Chromium(III) can be oxidized to Cr(VI) by Mn(III/IV) oxides
(Bartlett and James, 1979; Fendorf and Zasoski, 1992). Chromium(VI)
is mobile in the soil environment and is a suspected carcinogen. It occurs
as the dichromate, Cr
2
O
7
2–
, or chromate, HCrO
4
–
and CrO
4
2–
, anions
(Huang, 1991).
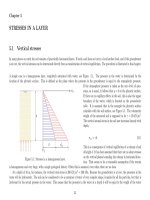
Figure 8.5 shows the oxidation kinetics of Cr(III) to Cr(VI) in a soil.
Most of the oxidation occurred during the first hour. At higher temperatures,
there was a rapid oxidation rate, followed by a slower rate. The decrease in
the rate of Cr(III) oxidation has been ascribed to a number of factors
including the formation of a surface precipitate that effectively inhibits
further oxidation (Fendorf et al., 1992).
Plutonium can exist in the III to VI oxidation states as Pu
3+
, Pu
4+
, PuO
2
+
,
and PuO
2
2+
in strongly acid solutions (Huang, 1991). Plutonium(VI), which
can result from oxidation of Pu(III/IV) by Mn(III/IV) oxides (Amacher and
Baker, 1982), is very toxic and mobile in soils and waters.
Arsenic (As) can exist in several oxidation states and forms in soils and
waters. In waters, As can exist in the +5, +3, 0, and –3 oxidation states.
Arsenite, As(III), and arsine (AsH
3
, where the oxidation state of As is –3) are
much more toxic to humans than arsenate, As(V). Manganese(III/IV) oxides
can oxidize As(III) to As(V) as shown below where As(III) as HAsO
2
is added
to MnO
2
to produce As(V) as H
3
AsO
4
(Oscarson et al., 1983):
HAsO
2
+ MnO
2
=(MnO
2
) · HAsO
2
(8.17)
(MnO
2
) · HAsO
2
+ H
2
O=H
3
AsO
4
+ MnO (8.18)
H
3
AsO
4
=H
2
AsO
4
–
+ H
+
(8.19)
H
2
AsO
4
–
= HAsO
4
2–
+ H
+
(8.20)
(MnO
2
) · HAsO
2
+ 2H
+
=H
3
AsO
4
+ Mn
2+
. (8.21)
Equation (8.18) involves the formation of an adsorbed layer. Oxygen
transfer occurs and HAsO
2
is oxidized to H
3
AsO
4
(Eq. (8.18)). At pH ≤ 7,
the predominant As(III) species is arsenious acid (HAsO
2
), but the oxidation
product, H
3
AsO
4
, will dissociate and form the same quantities of H
2
AsO
4
–
and HAsO
4
2–
with little H
3
AsO
4
present at equilibrium (Eqs. (8.19) and
(8.20)). Each mole of As(III) oxidized releases about 1.5 mol H
+
. The H
+
produced after H
3
AsO
4
dissociation reacts with the adsorbed HAsO
2
on
MnO
2
, forming H
3
AsO
4
, and leads to the reduction and dissolution of
Mn(IV) (Eq. (8.21)). Thus, every mole of As(III) oxidized to As(V) results
Redox Reactions Involving Inorganic and Organic Pollutants 259
5.0
4.0
3.0
2.0
1.0
10 20 30 40
301K
296K
323K
275K
[soil] = 12.5g L
-1
[Cr (III)]
0
= 192μmol L
-1
pH = 5.5
Time, min
Cr (VI) Formed, μmol L
-1
FIGURE 8.5. Effect of temperature on the kinetics of Cr(III)
oxidation in moist Hagerstown silt loam soil. From Amacher and
Baker (1982).
in 1 mol of Mn(IV) in the solid phase being reduced to Mn(II) and partially
dissolved in solution (Oscarson et al., 1981).
Oscarson et al. (1980) studied the oxidation of As(III) to As(V) in
sediments from five lakes in Saskatchewan, Canada. Oxidation of As(III) to
As(V) occurred within 48 hr. In general, > 90% of the added As was sorbed
on the sediments within 72 hr.
Manganese oxides and hydroxides, e.g., Mn
3
O
4
and MnOOH, may also
catalyze the oxidation of other trace metals such as Co
2+
, Co
3+
, Cu
2+
, Ni
2+
,
Ni
3+
, Pb
2+
, and Se
4+
by disproportionation to Mn
2+
and MnO
2
(Hem, 1978;
Scott and Morgan, 1996). The disproportionation results in vacancies in the
Mn oxide structure. Since the Mn
2+
and Mn
3+
in the oxides have physical
sizes similar to those of Co
2+
, Co
3+
, Cu
2+
, Ni
2+
, Ni
3+
, and Pb
2+
, these metals
can occupy the vacancies in the Mn oxide and become part of the structure.
With disproportionation or with other redox processes involving the Mn
oxides the solubility of the metals can be affected. For example, if during the
disproportionation process Co
3
O
4
, the oxidized form of the metal, forms
from Co
2+
, the reaction can be expressed as (Hem, 1978)
2Mn
3
O
4
(s) + 3Co
2+
+ 4H
+
→
MnO
2
(s) + Co
3
O
4
(s) + 5Mn
2+
+ 2H
2
O, (8.22)
and the equilibrium constant (K°) is (Hem, 1978)
(Mn
2+
)
5
/(Co
2+
)
3
(H
+
)
4
= 10
18.73
. (8.23)
Thus, the oxidation of Co(II) to Co(III) reduces its solubility and mobility
in the environment. Using X-ray photoelectron spectroscopic analyses
(Murray and Dillard, 1979), this reaction has been shown to occur.
Scott and Morgan (1996) studied the oxidation of Se(IV) by synthetic
birnessite. Se(IV) was oxidized to Se(VI) with Se(VI) first appearing in the
aqueous suspension after 12 hr and was produced at a constant rate over the
duration of the experiment (28 days). The following oxidation mechanism
was suggested: (1) birnessite directly oxidized Se(IV) through a surface
complex mechanism; (2) the rate-limiting step in the production of Se(VI)
was the electron transfer step involving a transfer of two electrons from the
260 8 Redox Chemistry of Soils
anion to the metal ion, breaking of two Mn–O bonds, and addition of an O
from water to Se(VI); and (3) the reaction products Se(VI) and Mn(II) were
released from the surface by different steps.
Scott and Morgan (1996) compared their results to those of Eary and
Rai (1987), who studied Cr(III) oxidation by pyrolusite (β-MnO
2
) between
pH 3.0 and 4.7, and Scott and Morgan (1995), who studied As(III)
oxidation by birnessite (δ-MnO
2
) at pH values between 4.0 and 8.2
(Table 8.4). The Cr(III) redox transformation on pyrolusite was slowest,
which was attributed to unfavorable adsorption on both a positively charged
surface and aqueous species and the small thermodynamic driving force.
Also, the transfer of three electrons from Cr(III) to Mn(IV) requires the
involvement of more than one Mn(IV) atom per Cr(III) atom.
Manganese oxides also appear to play an important role in ligand-
facilitated metal transport. Using soil columns that consisted of fractured
saprolite coated with amorphous Fe
–
and Mn oxides, Jardine et al. (1993)
studied the transport of Co(II) EDTA
2–
, a mixture of Co(II) EDTA
2–
and
Co(III) EDTA
–
and Sr EDTA
2–
. The Mn oxides oxidized Co(II) EDTA
2–
into Co(III) EDTA
–
, a very stable complex (log K° value of 41.4, Xue
and Traina, 1996). The formation of this complex resulted in enhanced
transport of Co.
Xue and Traina (1996) found that an aerobic goethite suspension
catalyzed oxidation of Co(II) EDTA
2–
to Co(III) EDTA
–
by dissolved O
2
.
The kinetics were described using a pseudo-first-order rate constant, k
1
, of
0.0078 ± 0.0002 h
–1
at pH 5 and a goethite concentration of 3.09 g liter
–1
.
Reductive Dissolution of Mn Oxides by Organic Pollutants
A number of investigators have studied the reductive dissolution of Mn
oxides by organic pollutants such as hydroquinone (Stone and Morgan,
1984a), substituted phenols (Stone, 1987b), and other organic compounds
(Stone and Morgan, 1984b). With substituted phenols the rate of dissolution
TABLE 8.4. Inorganic Redox Reactions with Manganese Dioxides
a
System Time to oxidize 50% Driving force at Source
pH 4 Δe
o
(V)
b
δ-MnO
2
:As(III) → As(V)
pH 4, 298 K, 14 m
2
liter
–1
10 min +0.529 Scott and Morgan (1995)
δ-MnO
2
: Se(IV) → Se(VI)
pH 4, 308 K, 14 m
2
liter
–1
10 days
pH 4, 298 K, 28 m
2
liter
–1
16 days +0.092
pH 4, 298 K, 14 m
2
liter
–1
30 days
β-MnO
2
: Cr(III) → Cr(VI)
pH 4, 298 K, 71 m
2
liter
–1
95 days +0.011 Eary and Rai (1987)
a
From Scott and Morgan (1996), with permission. Copyright 1996 American Chemical Society.
b
The activity ratio for each oxidant/reductant pair is taken as unity.
Redox Reactions Involving Inorganic and Organic Pollutants 261
was proportional to substituted phenol concentration and the rate increased
as pH decreased (Stone, 1987b). Phenols containing alkyl, alkoxy, or other
electron-donating substituents were more slowly degraded; para-nitrophenol
reacted slowly with Mn(III/IV) oxides. The increased rate of reductive
dissolution at lower pH may be due to more protonation reactions that
enhance the creation of precursor complexes or increases in the protonation
level of the surface precursor complexes that increase electron transfer rates
(Stone, 1987b).
Reduction of Contaminants by Iron and Microbes
Iron(II)-containing oxides such as magnetite [Fe
2+
Fe
2
3+
]O
4
and ilmenite
[Fe
2+
Ti]O
3
, and microbes (microbially mediated processes) can play a
significant role in the reduction of inorganic and organic contaminants.
Chemical reduction of Cr
2
O
7
2–
[Cr(VI)] to Cr(III)] by a generic Fe
2+
oxide is
shown below (White and Peterson, 1998):
9[Fe
2+
]
oxide
+ Cr
2
O
7
2–
+ 14 H
+
→ 6 [Fe
3+
]
oxide
+ 3 Fe
2+
+ 2 Cr
3+
+ 7 H
2
O.
(8.24)
Figure 8.6 shows changes that occur in the aqueous concentrations of Fe,
Cr, and V species with time after reaction with ilmenite at pH 3. As time
increases there is a linear increase in the transformation of the oxidized
species to the reduced species. That is, Fe(III) is reduced to Fe(II), Cr(VI) is
reduced to Cr(III), and V(V) is reduced to V(IV).
However, under field conditions and at longer times, the effectiveness of
Fe(II)-containing oxides on reduction of contaminants is affected by the
reductive capacity of the oxide minerals, the impact of surface passivation
(surface layer that forms, which is different from the bulk oxide structure),
and competition effects and poisoning by other aqueous species.
Several classes of organic pollutants can also undergo abiotic reduction
in anoxic aqueous environments when ferrous iron and Fe oxides are present
(Haderlein and Pecher, 1998). Figure 8.7a shows the reduction of 4-chloro
nitrobenzene (4-Cl-NB) with time when both magnetite and Fe(II) in
solution were present and when only magnetite or solution Fe(II) was
included. Only when both magnetite and solution Fe(II) were present did
rapid reduction in 4-Cl-NB occur (Fig. 8.7a). This suggests that continued
reduction of the organic contaminant is dependent on the continual
replacement of Fe(II) on the mineral surface that has been consumed by
oxidation of the organic pollutant as shown in Fig. 8.7b. During the entire
period of 4-Cl-NB reduction, the number of electrons transferred to the
4-Cl-NB was similar to the consumption of aqueous Fe(II).
While chemical reduction, for example Cr(VI) reduction by Fe(II) or
S(-II), is a major pathway for reduction of contaminants in anaerobic
environments, the presence of reductant pools of Fe(II) and S(-II) is
dependent on microbial activity (Wielinga et al., 2001). Fe(III) and SO
4
2–
reduction occurs predominantly through dissimilatory reduction pathways
262 8 Redox Chemistry of Soils
by dissimilatory metal-reducing bacteria (DMRB) (Lovely, 1991). DMRB
can reduce solid phase Fe(III) oxides and oxyhydroxides such as ferrihydrite,
goethite, hematite, and magnetite (Kostka and Nealson, 1995).
For example, one sees in the following two-step biotic–abiotic reaction
the role of DMRB on the reduction of Fe(III) oxide and subsequent
reduction of Cr(VI) (Wielinga et al., 2001):
3
/
4
C
3
H
5
O
3
–
+ 3 Fe(OH)
3
→
3
/
4
C
2
H
3
O
2
–
+ 3 Fe
2+
+
3
/
4
HCO
3
–
+ 2 H
2
O + 5
1
/
4
OH
–
(8.25)
3 Fe
2+
+ H CrO
4
–
+ 8 H
2
O → 3 Fe(OH)
3
+ Cr(OH)
3
+ 5 H
+
. (8.26)
FIGURE 8.6. Time trends showing the rates of ferric
(A), chromate (B), and vanadate (C) reduction in
ilmenite suspensions at pH 3 at 298 K. Rates of ferric
reduction increase with increasing suspended ilmenite
(g liter
–1
). Solid lines are linear regression fits to data.
Dashed lines are initial solution concentrations. Adapted
from White and Peterson (1996), with permission.
Copyright 1996 American Chemical Society.
Redox Reactions Involving Inorganic and Organic Pollutants 263
Ferrous iron produced in Eq. (8.25) is cycled back to Fe(III) in
Eq. (8.26), thus serving as an electron shuttle between the bacteria and Cr.
Figure 8.8 shows microbially induced, ferrous iron-mediated reduction
of Cr(VI). Shewanella alga strain BrY was the model dissimilatory iron-
reducing bacterium (DIRB). BrY is a facultative anaerobic bacterium that
can couple the oxidation of organic acids and H
2
to the reduction of Fe(III),
Mn(IV), and U(VI) under anaerobic conditions (Caccaro et al., 1992). In Fig.
8.8 one sees the ability of BrY to reduce Cr(VI) via Fe(II) production during
iron respiration. When Cr(VI) is introduced, the concentration of Fe(II)
(aq)
decreases dramatically. Without the bacterium, little Fe
2+
is produced.
FIGURE 8.7. (a) Reduction of 50 μM 4-chloro nitrobenzene (4-Cl-NB) in the presence
of 17 m
2
liter
–1
magnetite and an initial concentration of 2.3 mM Fe(II) at pH 7.0 and
298 K (). The rate law deviates from pseudo-first-order behavior for longer observation
times. 4-Cl-NB was not reduced significantly in suspensions of magnetite without
dissolved Fe(II) (∇) or in solutions of Fe(II) without magnetite (Δ) (adapted from
Klausen, 1995). (b) Electron balance (x) for the reduction of 4-Cl-NB repeatedly added at
times t = 0, 6, 17 min to a suspension containing 11.2 m
2
liter
–1
magnetite and an initial
concentration of dissolved Fe(II) of 1.6 mM at pH 7.75 and T = 298 K. Adapted from
Klausen (1995), with permission. Copyright 1995 American Chemical Society.
264 8 Redox Chemistry of Soils
FIGURE 8.8. Temporal changes in Fe(II)
(aq)
concentration
detected in flow-reactor effluent for goethite. Conditions: 30 mM
HEPES buffered medium, pH 7, 10 mM lactate added as
electron donor. From Wielinga et al. (2001), with permission.
Copyright 2001 American Chemical Society.
Suggested Reading
Baas Becking, L. G. M., Kaplan, I. R., and Moore, D. (1960). Limits of the
natural environment in terms of plant and oxidation–reduction
potentials. J. Geo. Phys. 68, 243–284.
Bartlett, R. J. (1986). Soil redox behavior. In “Soil Physical Chemistry”
(D.L. Sparks, Ed.), pp. 179–207, CRC Press, Boca Raton, FL.
Bartlett, R. J., and James, B. R. (1993). Redox chemistry of soils.
Adv. Agron. 50, 151–208.
Haderlein, S. B., and Pecher, K. (1998). Pollutant reduction in heterogeneous
Fe(II)–Fe(III) systems. In “Mineral–Water Interfacial Reactions” (D. L.
Sparks and T. J. Grundl, Eds.), ACS Symp. Ser. 715, pp. 342–357. Am.
Chem. Soc., Washington, DC.
Huang, P. M. 1991. Kinetics of redox reactions on manganese oxides and its
impact on environmental quality. In “Rates of Soil Chemical Processes”
(D. L. Sparks and D. L. Suarez, Eds.), SSSA Spec. Publ. 27, pp.
191–230. Soil Sci. Soc. Am., Madison, WI.
James, B. R., and Bartlett, R. J. (2000). Redox phenomena. In “Handbook
of Soil Science” (M. E. Sumner, Ed.), pp. B169–B194, CRC Press, Boca
Raton, FL.
Patrick, W. H., Jr., Gambrell, R. P., and Faulkner, S. P. (1996). Redox
measurements of soils. In “Methods of Soil Analysis: Part 3—Chemical
Methods” (D. L. Sparks, Ed.), Soil Sci. Soc. Am. Book Ser. 5,
pp. 1255–1273. Soil Sci. Soc. Am., Madison, WI.
Redox Reactions Involving Inorganic and Organic Pollutants 265
Ponnamperuma, F. N. (1972). The chemistry of submerged soils. Adv.
Agron. 24, 29–96.
Stone, A. T. (1986). Adsorption of organic reductants and subsequent
electron transfer on metal oxide surfaces. In “Rates of Soil Chemical
Processes” (D. L. Sparks and D. L. Suarez, eds.), SSSA Spec. Publ. 27,
pp. 231–254. Soil Sci. Soc. Am., Madison, WI.
Stumm, W., and Morgan, J. J. (1981). “Aquatic Chemistry.” Wiley,
New York.
White, A. F., and Peterson, M. L. (1998). The reduction of aqueous metal
species on the surfaces of Fe(II)-containing oxides: The role of surface
passivation. In “Mineral–Water Interfacial Reactions” (D. L. Sparks and
T. J. Grundl, Eds.), ACS Symp. Ser. 715, pp. 323—341. Am. Chem.
Soc., Washington, DC.
This Page Intentionally Left Blank