Báo cáo khoa học: "Use of dynamic microsimulation to predict disease progression in patients with pneumonia-related sepsis" docx
Bạn đang xem bản rút gọn của tài liệu. Xem và tải ngay bản đầy đủ của tài liệu tại đây (694.58 KB, 11 trang )
Open Access
Available online />Page 1 of 11
(page number not for citation purposes)
Vol 11 No 3
Research
Use of dynamic microsimulation to predict disease progression in
patients with pneumonia-related sepsis
Görkem Saka
1
, Jennifer E Kreke
1
, Andrew J Schaefer
1,2
, Chung-Chou H Chang
2
,
Mark S Roberts
1,2
, Derek C Angus
3
for the GenIMS Investigators
1
Department of Industrial Engineering, University of Pittsburgh, 3700 OHara St., 3700 Benedum Hall, Pittsburgh, PA 15261, USA
2
Section of Decision Sciences and Clinical Systems Modeling, Department of Medicine, Division of General Internal Medicine, University of
Pittsburgh, 200 Meyran Ave., Suite 200, Pittsburgh, PA 15213, USA
3
The Clinical Research, Investigation, and Systems Modeling of Acute Illness (CRISMA) Laboratory, Department of Critical Care Medicine, University
of Pittsburgh, 3550 Terrace St., 600 Scaife Hall, Pittsburgh, PA 15261, USA
Corresponding author: Mark S Roberts,
Received: 18 Dec 2006 Revisions requested: 29 Jan 2007 Revisions received: 20 Apr 2007 Accepted: 14 Jun 2007 Published: 14 Jun 2007
Critical Care 2007, 11:R65 (doi:10.1186/cc5942)
This article is online at: />© 2007 Saka et al.; licensee BioMed Central Ltd.
This is an open access article distributed under the terms of the Creative Commons Attribution License ( />),
which permits unrestricted use, distribution, and reproduction in any medium, provided the original work is properly cited.
For a list of the GenIMS Investigators, see Additional file 1
Abstract
Introduction Sepsis is the leading cause of death in critically ill
patients and often affects individuals with community-acquired
pneumonia. To overcome the limitations of earlier mathematical
models used to describe sepsis and predict outcomes, we
designed an empirically based Monte Carlo model that
simulates the progression of sepsis in hospitalized patients over
a 30-day period.
Methods The model simulates changing health over time, as
represented by the Sepsis-related Organ Failure Assessment
(SOFA) score, as a function of a patient's previous health state
and length of hospital stay. We used data from patients enrolled
in the GenIMS (Genetic and Inflammatory Markers of Sepsis)
study to calibrate the model, and tested the model's ability to
predict deaths, discharges, and daily SOFA scores over time
using different algorithms to estimate the natural history of
sepsis. We evaluated the stability of the methods using
bootstrap sampling techniques.
Results Of the 1,888 patients originally enrolled, most were
elderly (mean age 67.77 years) and white (80.72%). About half
(47.98%) were female. Most were relatively ill, with a mean
Acute Physiology and Chronic Health Evaluation III score of 56
and Pneumonia Severity Index score of 73.5. The model's
estimates of the daily pattern of deaths, discharges, and SOFA
scores over time were not statistically different from the actual
pattern when information about how long patients had been ill
was included in the model (P = 0.91 to 0.98 for discharges; P
= 0.26 to 0.68 for deaths). However, model estimates of these
patterns were different from the actual pattern when the model
did not include data on the duration of illness (P < 0.001 for
discharges; P = 0.001 to 0.040 for deaths). Model results were
stable to bootstrap validation.
Conclusion An empiric simulation model of sepsis can predict
complex longitudinal patterns in the progression of sepsis, most
accurately by models that contain data representing both organ-
system levels of and duration of illness. This work supports the
incorporation into mathematical models of disease of the clinical
intuition that the history of disease in an individual matters, and
represents an advance over several prior simulation models that
assume a constant rate of disease progression.
Introduction
Each year in the USA 750,000 people develop severe sepsis,
a systemic inflammatory response with acute organ dysfunc-
tion that occurs secondary to infection [1]. About one-third of
patients die, making sepsis a major cause of mortality [2].
Because care for patients with sepsis is complex and many
questions concerning the clinical course and treatment cannot
be explored via randomized controlled trials, several
investigators have applied mathematical modeling to examine
the relationships between patient characteristics, disease pro-
gression, and outcomes. For example, Bauerle and coworkers
[3] developed a stationary Markov model with three states
CAP = community-acquired pneumonia; ICU = intensive care unit; SOFA = Sepsis-related Organ Failure Assessment.
Critical Care Vol 11 No 3 Saka et al.
Page 2 of 11
(page number not for citation purposes)
(well, septic, and dead) to describe the course of disease in
critically ill patients, to produce risk profiles of various patient
groups, and to estimate age-specific and sex-specific survival
rates. In this model, the transitions were independent of time
and did not incorporate information regarding the patient's
duration of disease. Using a similar structure, Rangel-Frausto
and colleagues [4] modeled the stages of sepsis (sepsis,
severe sepsis, septic shock, and death), calibrated from a sin-
gle center prospective cohort study. More recently, Clermont
and coworkers [5] developed a microsimulation model that
characterized patients admitted to the intensive care unit (ICU)
in terms of their scores on the Sepsis-related Organ Failure
Assessment (SOFA) [6]. The Clermont model first predicts
the changes in component SOFA and total SOFA scores over
time, and then it uses these data to predict death, transfer out
of the ICU, or continued presence in the ICU. Although the
model recognizes the nonconstant nature of transition proba-
bilities, it does not include data concerning the clinical course
of patients before they enter the ICU.
We describe the construction of a simulation model that uses
a more detailed description of illness (represented by changes
in both the total and component SOFA scores) and allows the
progression of disease to depend upon the duration of illness
and the recent history, namely whether the patient is improv-
ing, becoming worse, or remaining stable. The potential use of
such a simulation model is broad, and it is more flexible than a
standard statistical prediction rule. A standard prediction rule
typically estimates the outcome as a function of initial varia-
bles, such as the likelihood of death given age, sex, level of ill-
ness, and so on. However, it is not capable of predicting an
individual's actual course of disease. In contrast, a simulation
model produces a virtual representation of each individual,
their specific course through their disease, and eventual out-
come, which can be used to investigate the potential effects
of process of care or therapeutic interventions across the
entire course of disease.
The purpose of this investigation is to provide a 'proof-of-con-
cept' that the simulation technique can model individual
patients whose aggregated disease course reproduces the
rate of change of severity of illness, and the actual outcomes
of a multicenter cohort of patients at risk for severe sepsis.
Materials and methods
Sources and types of data used
The data that we used to calibrate our model were derived
from patients who were enrolled in the GenIMS (Genetic and
Inflammatory Markers of Sepsis) study, which is a multicenter
cohort study of patients with community-acquired pneumonia
(CAP) who are at risk for severe sepsis. The research per-
formed in the original study and subsequent model develop-
ment was approved by the institutional review boards of the
University of Pittsburgh and other participating universities
and hospitals.
The GenIMS Study enrolled patients from 28 academic and
community hospitals in southwestern Pennsylvania, Connecti-
cut, southern Michigan, and western Tennessee. Patients
were eligible for inclusion if they were older than 18 years and
had a clinical and radiological diagnosis of pneumonia, follow-
ing the criteria proposed by Fine and coworkers [7] They were
subsequently excluded if they met any of the following criteria:
transfer from another hospital, discharge from a hospital within
the prior 10 days, occurrence of an episode of pneumonia
within the prior 30 days, long-term use of mechanical ventila-
tion, presence of cystic fibrosis or active pulmonary tuberculo-
sis, admission for palliative care, previous enrollment in the
study, incarceration, and pregnancy.
We used data describing each patient's demographic charac-
teristics (age, sex, and race/ethnicity) and hospital stay (dates
of admission, movement to or from a hospital ward, movement
to or from an ICU, discharge, or death). The clinical detail con-
tained in the GenIMS data also allowed us to estimate the pro-
gression of disease over time in terms of both the level of
illness (as represented by the daily SOFA score) and the
direction of progression (direction of change in SOFA score
over time). The SOFA scores describe in quantitative terms
the degree of organ dysfunction or failure, as defined by the
Working Group on Sepsis-related Problems of the European
Society of Intensive Care Medicine [6]. In the GenIMS study
patients were considered to have severe sepsis if their SOFA
score for any organ system was 3 or a 4, provided that the
level of dysfunction in that organ system was not as severely
impaired in the patient's pre-morbid state. When organ dys-
function data were missing (for instance, serum bilirubin),
scores were imputed using an algorithm (Table 1) based on
methods from previous sepsis studies [5,8].
Development of the model
The purpose of the model is to simulate a cohort of patients
whose disease progression represents the collective experi-
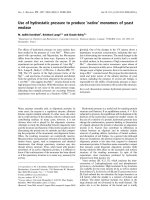
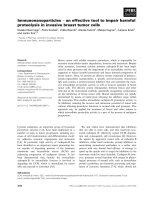
ence of the actual patients in the GenIMS cohort. Figure 1
describes the basic structure of the simulation. A patient is ini-
tially admitted to a hospital location (ward or ICU) and can
either remain there or move from one hospital location to
another until death or discharge, or until 30 days have elapsed.
To create clinical progressions (called 'trajectories') in these
simulated patients, the model has methods for generating
patients and updating their health over time.
Using a modification of methods described in detail by Alagoz
and coworkers [9], the model takes an actual patient's SOFA
score history and decomposes it into a sequential series of
overlapping three-day scores (hereafter called 'triplets') [9].
The purpose of the triplets is to represent successive days of
illness by decomposing each patient's experiences into multi-
ple, overlapping three-day examples of yesterday's SOFA
score, today's SOFA score, and tomorrow's SOFA score. For
example, assuming a real patient remained in the hospital for
Available online />Page 3 of 11
(page number not for citation purposes)
five days, the first triplet would consist of the patient's scores
for the first, second, and third days; the second would consist
of scores for the second, third, and fourth days; and the final
triplet would consist of scores for the third, fourth, and fifth
days.
To utilize as much of the GenIMS dataset as possible, we
developed special cases for those patients who remained in
the hospital for less than three days. If the patient stayed for
only two days, then the triplet is made by duplicating the
scores for the first day and assuming that the patient was sta-
ble the day before they came into the hospital. If a patient
stayed in the hospital for only one day, then the triplet is made
by replicating those data twice, reflecting the fact that we have
no information regarding the direction of illness progression.
Initial patient generation
To generate a cohort of patients that resembles at baseline the
actual study cohort, the model generates a set of virtual
patients by randomly selecting triplets from the set of triplets
whose first day happened to be day one for an actual patient.
Each virtual patient is then assigned the demographic data
(age, sex, and ethnicity) associated with that first triplet.
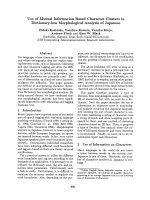
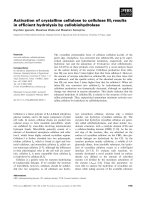
Disease progression
The method used to determine the progression of disease and
future health status of the generated patients is illustrated in
Figure 2. The figure describes a simulated 46-year-old white
male with a current total SOFA score of 12 (composed of the
component scores shown) who was slightly less sick the
previous day, with a total SOFA score of only 10. The algo-
rithm searches the set of all triplets derived from patients who
are clinically 'similar' (defined below) to the generated patient,
and randomly picks one of them. The model then uses that
chosen patient's next day SOFA scores (labeled t + 1 in the
figure) to fill in the generated patient's SOFA scores for the
next day. The model advances time by one day, and the gener-
ated patient's t + 1 values become the current day values, and
the process repeats itself. In addition to the SOFA scores, sev-
eral other events are carried forward with each triplet, includ-
ing the patient's location in the hospital (ward, ICU, or
discharged) and whether the person is alive or dead. For
example, if the patient represented by the chosen triplet died
during the next time period, then the generated patient is con-
sidered to have died that next day as well. If the patient repre-
sented by the chosen triplet was transferred from the ICU to
the ward or was discharged from the hospital, then the same
event is recorded for the simulated patient.
Table 1
Handling of missing SOFA scores in the total sample, calibration sample, and validation sample
Type of missing SOFA data Interpolation and extrapolation rules used to fill in missing data
Data have never been measured Use the baseline SOFA value for every day
Data are missing between two known values Linearly interpolate between the values
Data are missing before the first observation Use the baseline SOFA value for every day until the first observation
Data are missing after the last observation and the patient died Assign the highest SOFA score (4) to the last day. Linearly interpolate
between the last observation value and the last day value
Data are missing after the last observation and the patient was
discharged
Assign the baseline SOFA value to the last day. Linearly interpolate
between the last observation value and the last day value
Data are missing after the last observation and the patient was still in
the hospital at day 30
Carry the last observation forward
The total sample included 1,888 patients from the GenIMS (Genetic and Inflammatory Markers of Sepsis) Study. SOFA, Sepsis-related Organ
Failure Assessment.
Figure 1
Basic structure of the simulation modelBasic structure of the simulation model. In the model, a patient with
static and dynamic characteristics enters the hospital ward or intensive
care unit (ICU). The patient could remain in the same location, move
between the ward and ICU, die, or be discharged from the hospital.
CNS, central nervous system; SOFA, Sepsis-related Organ Failure
Assessment.
Critical Care Vol 11 No 3 Saka et al.
Page 4 of 11
(page number not for citation purposes)
Determining clinical similarity
One of the major goals of this model development was to
determine what level of clinical similarity is necessary in match-
ing patients (which means choosing a triplet that is similar to
the generated patient) to reproduce the events and longitudi-
nal disease progression observed in the actual cohort. Several
characteristics were assumed to be important by the GenIMS
investigators. When searching the database of triplets, the
model only searches among triplets that are derived from
patients who are in the same age category (< 65 years, 65 to
80 years, and > 80 years), the same racial/ethnic category
(white and African American), and the same location in the
hospital (ward or ICU).
Several different methods were used to match patients based
on the severity and duration of illness. The different methods
were tested to assess which characteristics were most impor-
tant in creating a set of generated clinical histories that most
closely matched the real clinical histories. The model uses the
SOFA score to represent severity of illness, and the model can
match on either the total score (in which case the score must
match exactly) or on the components of the score, which are
central nervous system, respiratory, circulatory scores and the
maximum of liver, renal, and coagulation scores. The compo-
nent SOFA scores were aggregated into categories of 0, 1 to
2, and 3 to 4. Component scores were considered similar if
they were in the same three-level category.
Whether the model matches on total or component SOFA, it
can also match on whether the patient's health is improving,
worsening, or staying the same by comparing whether the
SOFA scores are declining, rising, or remaining stable com-
pared with the prior day's score. Finally, the model can match
on the duration of illness, as measured by length of stay
aggregated into five categories (day 1, day 2, day 3, days 4 to
7, and day 8 and thereafter). In summary, the model can match
on three different clinical characteristics: the severity of illness,
measured by total or component SOFA score; the direction of
illness progression, represented by whether the SOFA score
is rising, declining, or remaining stable; and the duration of ill-
ness, represented by categories of length of stay in the hospi-
tal. The use of these three matching criteria produces eight
possible algorithms for matching generated patients to real
patient three-day segments (triplets): severity of illness (total
Figure 2
Empiric method for updating the patient's healthEmpiric method for updating the patient's health. To update a model-generated patient's SOFA scores from one time to the next (from t - 0 to t + 1),
the model searches for a patient with similar characteristics at t - 0. The model finds the 'similar' patient's t + 1 scores and uses them to represent
the generated patient's t + 1 scores. CNS, central nervous system; SOFA, Sepsis-related Organ Failure Assessment.
Available online />Page 5 of 11
(page number not for citation purposes)
or component SOFA), direction of illness progression
(required or not), and duration of illness (required or not).
Finally, the model does not allow the triplet that produced the
most recent data to be matched to a triplet from the same
patient to determine the next day's SOFA scores. This ensures
that the model does not simply replicate the actual history of
the patients in GenIMS, but rather each simulated history will
be a combination of the histories of individuals who are gener-
ally similar.
There are criteria to handle certain special cases. If the model
cannot find a triplet that is similar to the generated patient,
then it expands the similarity criteria and allows the generated
patient to be matched either to a triplet whose total SOFA
score is 1 point lower or higher or to a triplet whose compo-
nent SOFA score is 1 class lower or higher. If the generated
patient cannot be matched to a triplet meeting either of these
expanded criteria, then the model finds the next day values of
the prior triplet that the generated patient matched and uses
those. If the model does not find a match after using the
expanded criteria and after trying to match to the last triplet's
next day values, it removes the generated patient from the
model.
Generated patients leave the simulation model if they die, if
they are discharged, if their hospital stay exceeds 30 days, or
if the model cannot predict their next day health status. The
simulation model was created in C programming language.
Statistical analysis
We used the model to predict three outcomes in patients hos-
pitalized for up to 30 days: the number of discharges, number
of deaths, and total SOFA scores of the patients in hospital.
We used two methods to assess model performance. To com-
pare these outcomes of simulations with those of the actual
GenIMS dataset of patients, we used the Cressie-Read good-
ness-of-fit test, which is a special case (λ = 2/3) of a family of
multinomial tests used to evaluate how well the observed fre-
quencies fit with the expected frequencies [10]. This test
determines whether the pattern of discharges and deaths over
time in the simulated cohort is statistically different from the
actual observed pattern. Second, to ensure that the model
results are not representative of an idiosyncratic characteristic
of the particular GenIMS database, we used standard boot-
strapping techniques to assess the stability of the model
results to variations in the input data. This is a robust extension
of the 'split-halves' technique of a derivation and validation
dataset. We simulated 100 different patient datasets, where
each dataset is created by randomly picking 1,888 patients
from the original patient data with replacement. Patients can
be picked more than once and some patients may not be rep-
resented in each replicated dataset. The entire model runs of
50 replications are evaluated for each of the 100 datasets. We
then computed the 95% confidence intervals on the mean of
the 100 replications of the simulation. Stata version 9.0 (Stata-
Corp, College Station, TX, USA) was used for the statistical
calculations.
Results
Demographic and clinical characteristics
Of the 2,320 patients included in the GenIMS Study, 1,888
were eligible for inclusion in the model. The remainder were
excluded because they were not hospitalized (291 patients),
because the clinical team ruled out the presence of CAP (134
patients), or because the requisite data were missing (seven
patients). Table 2 describes the baseline demographic and
clinical characteristics of the 1,888 patients in the GenIMS
dataset. Of these, most were elderly (mean age 67.7 years)
and white (80.7%), and about half were women (48%). Most
were relatively ill, as indicated by the following average scores
at baseline: Charlson score of 1.9, Acute Physiology and
Chronic Health Evaluation III score of 56, Pneumonia Severity
Index score of 73, and SOFA score of 2.3. The specific etiol-
ogy of pneumonia was available in 375 (16%) patients, and
Gram-positive infections accounted for the majority of cases
of pneumonia (n = 251). Almost 16% required intensive care,
and 6.5% died within 30 days. Patients developing severe
sepsis amounted to 31.2%, and of those 26.91% died within
90 days. Out of a total 13,820 patient-days, the algorithm
used to fill in missing SOFA scores was used to impute 3,788
(27.41%) respiratory, 5,896 (42.66%) coagulation, 11,820
(85.53%) liver, 55 (0.40%) central nervous system, 3,959
(28.64%) renal, and 193 (1.40%) cardiac scores.
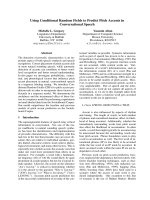
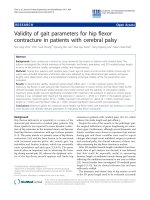
Predictions of outcomes
Figure 3 shows the model's ability to predict discharges and
deaths using eight different algorithms matching patients
according to level of component or total SOFA score, direc-
tion of change in SOFA score, and duration of illness. When
the model was required to match on all of these criteria, the
model closely predicted the pattern and number of discharges
and deaths that occurred within 30 days. The GenIMS study
recorded 1,787 actual discharges; the model predicted
between 1,779 and 1,804 discharges, depending upon the
algorithm used to match similar patients. There were 85 actual
deaths, and the model predicted between 62 and 84, again
depending upon the algorithm. In addition to predicting the
number of events, a simulation model can predict the pattern
of events over time.
As Figure 3 demonstrates, the model's ability to predict when
deaths and discharges occur over time varies. In general, the
more restrictive the criteria, the more closely does the model
predict actual experience, although inclusion of duration of ill-
ness in the model had a greater impact than did inclusion of
direction of illness progression. For example, when the algo-
rithm does not include information on the duration of illness or
the direction of progression (top left panel of Figure 3), the
predicted pattern of discharges is statistically significantly dif-
ferent from the observed pattern (P < 0.001). When the algo-
Critical Care Vol 11 No 3 Saka et al.
Page 6 of 11
(page number not for citation purposes)
Table 2
Baseline demographic and clinical characteristics of the GenIMS cohort
Characteristic Full GenIMS cohort
(n = 2,320)
Simulation model cohort
(n = 1,888)
a
Age (years; mean ± SD) 65.6 ± 18.1 67.77 ± 16.80
Sex (% female) 47.70 47.98
Race (Caucasian/black [%]) 79.20/16.30 80.72/15.73
Etiology (n [%])
Bacterial pneumonia
Gram positive only 251 (10.80) 237 (12.55)
Gram negative only 58 (2.50) 54 (2.86)
Mixed Gram positive and negative 22 (1.00) 21 (1.11)
Chlamydia or Legionella cultures 6 (0.30) 6 (0.32)
Other 38 (1.60) 37 (1.96)
Unknown 1,945 (83.80) 1,533 (81.20)
Charlson score (mean ± SD [% score = 0]) 1.78 ± 2.16 (31.64) 1.93 ± 2.21 (27.54)
Admitted to hospital (n [%]) 2,029 (87.50) 1,888 (100)
Admitted to hospital and pneumonia confirmed (n [%]) 1,895 (81.70) 1,888 (100)
LOS (days; mean ± SD [median]) 6.55 ± 5.10 (5) 7.26 ± 5.02 (6)
Admitted to ICU (%) 14.70 15.94
LOS in ICU (days; mean ± SD [median]) 5.37 ± 5.04 (4) 5.53 ± 5.22 (4)
APACHE score day 1 (mean ± SD) 53.07 ± 20.30 56.23 ± 17.90
PSI time 0 (mean ± SD) 83.25 ± 34.25 73.53 ± 43.68
PSI I and II (≤70; %) 37.70 42.74
PSI III (71 to 90; %) 22.37 20.55
PSI IV (91 to 130; %) 30.14 27.60
PSI V (>130; %) 9.79 9.11
PSI day 1 (mean ± SD) 95.11 ± 40.41 100.16 ± 38.06
PSI I and II (≤70; %) 29.01 22.14
PSI III (71 to 90; %) 19.18 20.87
PSI IV (91 to 130; %) 33.79 37.34
PSI V (>130; %) 18.02 19.65
SOFA score day 1 (mean ± SD [% score = 0]) 2.3 ± 1.92 (10.78) 2.33 ± 1.91 (12.50)
CNS organ failure, defined by the SOFA score (%) 5.22 5.93
Respiratory organ failure, defined by the SOFA score (%) 15.73 17.32
Liver organ failure, defined by the SOFA score (%) 0.52 0.64
Renal organ failure, defined by the SOFA score (%) 15.39 17.43
Circulatory organ failure, defined by the SOFA score (%) 3.58 3.97
Coagulation organ failure, defined by the SOFA score (%) 1.21 1.22
Discharged alive (%) 95.86 94.65
Severe sepsis subset mortality by day 90 (%) 25.51 26.91
In-hospital (%) 25.43 26.64
Mortality (%)
30 day 6.12 6.46
60 day 8.35 9.16
90 day 10.36 11.28
a
See section on demographic and clinical characteristics for explanation of patient exclusions from overall GenIMS database. APACHE, Acute
Physiology Age and Chronic Health Evaluation; CNS, central nervous system; ICU, intensive care unit; LOS, length of stay; PSI, Pneumonia
Severity Index; SD, standard deviation;
Available online />Page 7 of 11
(page number not for citation purposes)
rithm incorporates information on the duration of illness and
the direction of progression (bottom left panel in Figure 3) the
pattern of predicted discharges is virtually indistinguishable
from the actual (P = 0.91 to 0.95). The model was better able
to predict death (but not discharge) when it used component
SOFA scores than when it used total SOFA scores. Signifi-
cance tests showed that the model's predicted distributions of
discharges and deaths over time differed significantly from the
actual distributions when no time stratification was used in the
model, but they did not differ significantly when time stratifica-
tion was used in the model. This indicates that the transitions
that characterize sepsis are time dependent.
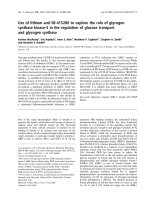
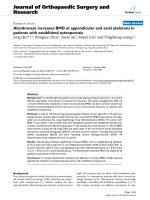
Figure 4 shows the model's ability to predict daily average total
SOFA scores of patients who remained in the hospital. As was
the case with the model's predictions of discharges and
deaths, the model's predictions of scores most closely
matched the actual scores when the model matched patients
with respect to the length of time in the hospital, the level of
illness (as measured by total or component SOFA scores),
Figure 3
Predicted and actual (observed) numbers of discharges and deaths per day during hospitalizationPredicted and actual (observed) numbers of discharges and deaths per day during hospitalization. The similarity criteria used for the predictions are
least restrictive at the top of the figure (not matching on both duration in the hospital and direction of illness progression) and most restrictive at the
bottom (matching on duration in the hospital and direction of illness progression). Simulated values are the average of 100 replications of the simu-
lation. SOFA, Sepsis-related Organ Failure Assessment.
Critical Care Vol 11 No 3 Saka et al.
Page 8 of 11
(page number not for citation purposes)
and the direction of illness. Although the inclusion of a meas-
ure of length of time in the hospital generally improved the pre-
diction of the average SOFA scores of the surviving patients,
the inclusion of a measure of whether the patients' health was
improving or worsening (matching on the most recent direc-
tion of change in SOFA score) improved the prediction of the
general level of illness to a greater degree than it improved the
prediction of death or discharge.
The results of the bootstrap validations for the prediction of
deaths and discharges are presented in Figure 5. When the
model is calibrated from repetitive random samples of the orig-
inal GenIMS data, and using only the component SOFA
scores for simplicity of presentation, the number of simulated
deaths and discharges on any given day varies within the 95%
confidence limits shown. The figure demonstrates that the
model is relatively stable to random fluctuations in the data
used to calibrate it, although it is difficult to recreate accurately
small numbers of events such as three or four deaths out of
thousands of people. Hence, there are relatively wider confi-
dence limits surrounding the model prediction of deaths than
of discharges. The bootstrap validations also confirm the basic
finding that the accurate prediction of the clinical course
requires information regarding how long the patient has been
ill. For example, when the model excluded information on the
duration of illness and direction of progression of illness, the
actual number of discharges were contained within the 95%
confidence limits of the model prediction for only 13 out of 30
days (43.3%; upper left panel of Figure 5), but when informa-
tion on both of these parameters was included the actual
number of discharges were contained within the 95% confi-
dence limits of the model prediction on 24 of 30 days (80%;
lower left panel of Figure 5). Furthermore, all of the days in
which the actual number of discharges was not contained
within the confidence limits of the model occurred after 15
days of hospitalization, when the number of discharges was
very low.
Discussion
We used data from a large, multicenter trial to develop and
evaluate an empiric simulation model that represents the time
course of individual patients who are admitted to the hospital
with CAP and are at risk for sepsis and multisystem organ fail-
ure. Our model expands on previous models in several ways.
Like the Clermont model [5], our model represents individual
patients and their SOFA scores over time and thereby adds a
degree of clinical detail that is not seen in state-based Markov
models [4]. In addition, our model simulates the longitudinal
progression of component SOFA scores dependently, main-
taining the inherent statistical associations found in the pro-
gression of sepsis across organ systems. The model
incorporates data from each patient's disease history and rep-
resents the patient's changing health over time, not only as it
relates to the patient's previous health state but also as it
relates to the patient's length of stay in the hospital. Thus, it
mitigates the 'lack of memory' assumptions inherent in stand-
ard stationary Markov models.
Two of our findings are of particular interest. The first is that
when the model uses the level of illness as measured by SOFA
scores to predict the course of hospitalized patients with CAP,
the predictions are better if information is added regarding
how long each patient has been in the hospital than if informa-
tion is added regarding the acute (previous day) determination
Figure 4
Predicted and actual (observed) daily average total SOFA score of patients in the hospitalPredicted and actual (observed) daily average total SOFA score of
patients in the hospital. The similarity criteria used for the predictions
are least restrictive at the top of the figure (not matching on both dura-
tion in the hospital and direction of illness progression) and most
restrictive at the bottom (matching on duration in the hospital and direc-
tion of illness progression). Simulated values are the average of 100
replications of the simulation. SOFA, Sepsis-related Organ Failure
Assessment.
Available online />Page 9 of 11
(page number not for citation purposes)
of whether the patient is improving or deteriorating. This obser-
vation reinforces a clinical intuition that a patient with a given
level of organ dysfunction on day 3 is very different from a
patient with that same level of organ dysfunction on day 15.
The second is the finding that the predictive ability of the
component and total SOFA scores is not equivalent. Of the
two types of SOFA scores, the component scores appear to
be better predictors of progression in the absence of informa-
tion regarding how long the patient has been in the hospital,
whereas the total scores appear to be better predictors in the
presence of this information.
Our modeling technique has several limitations. The most
important is that it is highly data intensive, and the division of
the dataset into groups of patients who are 'similar' in terms of
a series of criteria rapidly renders the membership in the indi-
vidual groups small. Subgrouping by age, race/ethnicity, ICU
status, duration in hospital, and SOFA score produced 240
groups with an average group size of about 50 triplets,
although some specific combinations occurred much more
frequently than others. Further investigations that use newer
statistical techniques to predict multiple correlated data over
time will be undertaken to address this data limitation. The eti-
Figure 5
Bootstrap validation of the model resultsBootstrap validation of the model results. The model was re-evaluated on 100 bootstrapped samples of 50 replications under each of the similarity
criteria shown in Figure 3. Only results of the simulations using component SOFA scores are shown. Empiric 95% confidence limits around the pre-
dicted number of discharges or deaths each day are constructed from the distribution of simulated discharges or deaths on each day of the simula-
tion. The results indicate that the model results are relatively stable to random fluctuations in the data that were used to calibrate it, and confirm the
finding that duration of disease is more important in predicting overall outcome than the instantaneous direction of progression of disease.
Critical Care Vol 11 No 3 Saka et al.
Page 10 of 11
(page number not for citation purposes)
ology of pneumonia was determined in 16% of GenIMS
patients, and it is possible that specific etiologies may predict
outcome. However, these results are similar to previous clini-
cal trials [11] and multicenter observational studies. For
example, an etiology was confirmed in only 5.7% of cases in
the PORT (Pneumonia Patient Outcomes Research Team)
study conducted by Fine and coworkers [12]. Similarly, in a
recent study by Metersky and colleagues [13] (n = 13,043) an
etiology was confirmed in only 7% of patients. We acknowl-
edge that the frequency of obtaining a microbiologic diagnosis
is lower in our cohort than that in previous epidemiologic stud-
ies designed to assess the etiology of CAP [14]. The reasons
for these differences are as follows: sputum studies were not
obtained routinely in all patients and were collected in only
one-third of our cohort; and serology studies for atypical infec-
tions and viruses were conducted in fewer than 5% of patients
in our cohort. However, these practices are consistent with
recommendations for diagnostic work up for CAP in the recent
CAP guidelines [15].
The model developed here demonstrates that, for the pur-
poses of simulating a cohort of individual patients with CAP
over the course of their illness, a purely empiric strategy based
entirely on the data available can reproduce the cohort-level
characteristics of the data, yet provide direct and continuous
information on the clinical condition of each individual pro-
gressing through the model. Such an approach can enhance
the ability of investigators to develop clinically detailed and
realistic simulation models for trial design, protocol
development, and cost-effectiveness analysis. For example,
one could use the model to predict the potential mortality and
length of stay effect (and therefore effect size for a sample size
calculation) of therapies designed to improve the function of
various organs by simulating the effect of a discontinuous
improvement in some component of the SOFA score. Simula-
tion models have been commonly used in cost-effectiveness
analysis, and the ability to recreate individual patient histories
allows more detailed analysis of the source of costs in such
models. Most of the examples of the use of individual
simulation models are from other diseases [16,17], but we are
building a platform to conduct such analyses in patients with
sepsis. Furthermore, we and others have used these specific
empiric techniques to address transplantation policy ques-
tions [18,19].
In future work we will extend the clinical description of patients
to include more complex combinations of laboratory tests,
physiologic state variables (blood pressure, pulse, among oth-
ers), and genetic predispositions (presence or absence of cer-
tain polymorphisms) to represent more faithfully the clinical
richness and complexity of patients with sepsis and organ
failure.
Conclusion
We used data from a large, multicenter study to develop a
dynamic microsimulation model to predict disease progres-
sion in patients with pneumonia-related sepsis. The model is
able to predict hospital discharges, in-hospital deaths, and
serial SOFA scores of patients with sepsis, and it supports the
assertion that the duration of disease is a critical factor in pre-
dicting the outcomes of sepsis.
Competing interests
The authors declare that they have no competing interests.
Authors' contributions
GS conducted the majority of the programming and data anal-
ysis. JEK initiated the development of the simulation model and
was responsible for the initial programming and development
of the natural history component. AJS supervised GS and JEK
and was responsible for ensuring the analytic accuracy of the
model. CHC conducted the statistical significance tests in
which the model's predictions were compared with the actual
results. MSR provided intellectual oversight and development
of the modeling components of this analysis, and completed
much of the writing and editing. DCA provided critical care
clinical oversight, access to the GenIMS database, and overall
intellectual leadership of the clinical components of this work.
All authors read and approved the final manuscript.
Additional files
Acknowledgements
The GenIMS Study was funded by NIGMS R01 GM61992 with addi-
tional support from GlaxoSmithKline for enrollment and clinical data col-
lection. For a list of the GenIMS Investigators, see Additional file 1. The
funding organizations did not play any role in the study design, execu-
tion, and analyses. Jennifer E Kreke is supported by the AT&T Labs Fel-
Key messages
• An empirically based simulation model can represent
the clinical course and outcomes in sepsis, and repro-
duce severity of illness over time.
• The duration of illness is more important than the imme-
diate acute change in illness in predicting future
outcomes.
The following Additional files are available online:
Additional File 1
A Word document listing individuals and institutions
participating in the GenIMS study, and adding further
acknowledgements.
See />supplementary/cc5942-S1.doc
Available online />Page 11 of 11
(page number not for citation purposes)
lowship Program. We appreciate the editorial comments of Sharon
Maddox.
Participants or their proxies provided written consent.
The work was performed at the University of Pittsburgh.
References
1. Angus DC, Linde-Zwirble WT, Lidicker J, Clermont G, Carcillo J,
Pinsky MR: Epidemiology of severe sepsis in the United
States: analysis of incidence, outcome, and associated costs
of care. Crit Care Med 2001, 29:1303-1310.
2. Anderson RN: Deaths: leading causes for 2000. Natl Vital Stat
Rep 2002, 50:1-86.
3. Bauerle R, Rucker A, Schmandra TC, Holzer K, Encke A, Hanisch
E: Markov cohort simulation study reveals evidence for sex-
based risk differences in intensive care unit patients. Am J
Surg 2000, 179:207-211.
4. Rangel-Frausto MS, Pittet D, Hwang T, Woolson RF, Wenzel RP:
The dynamics of disease progression in sepsis: Markov mod-
eling describing the natural history and the likely impact of
effective antisepsis agents. Clin Infect Dis 1998, 27:185-190.
5. Clermont G, Kaplan V, Moreno R, Vincent JL, Linde-Zwirble WT,
Hout BV, Angus DC: Dynamic microsimulation to model multi-
ple outcomes in cohorts of critically ill patients. Intensive Care
Med 2004, 30:2237-2244.
6. Vincent JL, Moreno R, Takala J, Willatts S, De Mendonça A, Bruin-
ing H, Reinhart CK, Suter PM, Thijs LG: The SOFA (Sepsis-
related Organ Failure Assessment) score to describe organ
dysfunction/failure. On behalf of the Working Group on Sep-
sis-Related Problems of the European Society of Intensive
Care Medicine. Intensive Care Med 1996, 22:707-710.
7. Fine MJ, Orloff JJ, Arisumi D, Fang GD, Arena VC, Hanusa BH, Yu
VL, Singer DE, Kapoor WN: Prognosis of patients hospitalized
with community-acquired pneumonia. Am J Med 1990,
88:1N-8N.
8. Milbrandt EB, Angus DC: Modeling reality: new methods to bet-
ter mimic biologic processes and improve outcome prediction
in critical illness. Curr Opin Crit Care 2004, 10:375-377.
9. Alagoz O, Bryce CL, Shechter SM, Schaefer AJ, Chang CCH,
Angus DC, Roberts MS: Incorporating biological natural history
in simulation models: empirical estimates of the progression
of end-stage liver disease. Med Decis Making 2005,
25:620-632.
10. Cressie N, Read TRC: Multinomial goodness of fit tests. J R
Stat Soc B 1984, 46:440-464.
11. Christ-Crain M, Stolz D, Bingisser R, Müller C, Miedinger D, Huber
PR, Zimmerli W, Harbarth S, Tamm M, Beat Müller B: Procalci-
tonin guidance of antibiotic therapy in community-acquired
pneumonia: a randomized trial. Am J Respir Crit Care Med
2006, 174:84-93.
12. Fine MJ, Stone RA, Singer DE, Coley CM, Marrie TJ, Lave JR,
Hough LJ, Obrosky DS, Schulz R, Ricci EM, et al.: Processes and
outcomes of care for patients with community-acquired pneu-
monia: results from the Pneumonia Patient Outcomes
Research Team (PORT) cohort study. Arch Intern Med 1999,
159:970-980.
13. Metersky ML, Ma A, Bratzler DW, Houck PM: Predicting bactere-
mia in patients with community-acquired pneumonia. Am J
Respir Crit Care Med 2004, 169:342-347.
14. Luna CM, Famiglietti A, Absi R, Videla AJ, Nogueira FJ, Fuenzalida
AD, Gene RJ: Community-acquired pneumonia: etiology, epi-
demiology, and outcome at a teaching hospital in Argentina.
Chest 2000, 118:1344-1354.
15. Mandell LA, Wunderink RG, Anzueto A, Bartlett JG, Campbell GD,
Dean NC, Dowell SF, File TM, Musher DM, Niederman MS, et al.:
Infectious Diseases Society of America/American Thoracic
Society consensus guidelines on the management of commu-
nity-acquired pneumonia in adults. Infectious Diseases Soci-
ety of America; American Thoracic Society. Clin Infect Dis
2007, 44 Suppl 2:S27-72.
16. Freedberg KA, Losina E, Weinstein MC, Paltiel AD, Cohen CJ,
Seage GR, Craven DE, Zhang H, Kimmel AD, Goldie SJ: The cost
effectiveness of combination antiretroviral therapy for HIV
disease. N Engl J Med 2001, 344:824-831.
17. Matchar DB, Samsa GP, Matthews JR, Ancukiewicz M, Parmigiani
G, Hasselblad V, Wolf PA, D'Agostino RB, Lipscomb J: The
Stroke Prevention Policy Model: linking evidence and clinical
decisions. Ann Intern Med 1997, 127:704-711.
18. Shechter SM, Bryce CL, Alagoz O, Kreke JE, Stahl JE, Schaefer
AJ, Angus DC, Roberts MS: A clinically based discrete-event
simulation of end-stage liver disease and the organ allocation
process. Med Decis Making 2005, 25:199-209.
19. Sung RS, Guidinger MK, Lake CD, McBride MA, Greenstein SM,
Delmonico FL, Port FK, Merion RM, Leichtman AB: Impact of the
expanded criteria donor allocation system on the use of
expanded criteria donor kidneys. Transplantation 2005,
79:1257-1261.