Kinetics of Materials - R. Balluff_ S. Allen_ W. Carter (Wiley_ 2005) Episode 10 ppt
Bạn đang xem bản rút gọn của tài liệu. Xem và tải ngay bản đầy đủ của tài liệu tại đây (3.49 MB, 45 trang )
390
CHAPTER
16
MORPHOLOGICAL EVOLUTION: DIFFUSIONAL CREEP, AND SlNTERlNG
Figure
16.2:
Force-balance
diagram
for
a
body with
capillary
forces
and
applied
load
Fapp.
The
plane
cuts the
body
normal.to
the
applied
force.
There
are
two
contributions
from
the
body
itself.
One
is
the
projection
of
the
surface
capillary
force
per
unit
length
(rS)
onto
the
normal direction
and
integrated
over
the
bounding
curve.
The
second
is
the
normal
stress
onn
integrated
over
the cross-sectional
area-in
the
case
of
fluids
bounded
by
a
surface
of
uniform
curvature
K’,
onn
=
ySnS
[4].
The constant
A
is
determined from the force balance in
Eq.
16.5,
(16.8)
Using Young‘s force-balance equation
(Eq.
14.18),
(16.9)
at
the grain boundary/surface intersection and the elongation rate
(Eq.
16.2) be-
comes
(
16.10)
When the grain boundaries are not spaced too closely, the quantity
Tbamboo
is
generally negative because
Rbn
%
1
is
less than 2J1
-
[yB/(2rS)I2
and yB/(2yS)
M
1/6 for metals.
T,
the
capillary shrinkage force,
arises from
a
balance between
reductions of surface and grain-boundary area.
If
Fapp
is
adjusted
so
that the
elongation rate goes to zero,
Fapp
=
-rbamboo,
and this provides an experimental
method to determine
yB/yS,
and thus
y”
if
+
is measured. This is known
as
the
Udin-Schaler-Wulff
zero-creep
method
[6].
Scaling arguments can be used to estimate elongation behavior. Because
K
and
1/Rb
will scale with
Jm
and the grain volume,
V,
is constant,
Eq.
16.10 implies
that
dL
-
dt
cc
L2
(
Fapp
-
ys@)
(16.11)
16.1.
MORPHOLOGICAL EVOLUTION FOR SIMPLE GEOMETRIES
391
where
?“bamboo
M
irySRb
is replaced by a term that depends on
L
alone. Elonga-
tion proceeds according to5
16.1.2
For the boundary of width 2w in Fig. 16.1, Eq. 16.4 becomes
Evolution
of
a Bundle
of
Parallel Wires via Grain-Boundary Diffusion
ann(Z
=
*W)
=
-7
S
K
(16.13)
where
K
is evaluated at the pore surface/grain boundary intersection.
Eq. 16.3 subject to Eq. 16.13 and the symmetry condition
(da,,/dz)l,=o
=
0,
Solving
a,,(x)
=
-(x
A2
-
w2)
-
7%
(16.14)
2
where the grain-boundary center is located at
x
=
0.
The constant A can be
determined from Eq. 16.5,
S
-
27
KW
-
fapp
(16.15)
The shrinkage rate, Eq.
16.2,
becomes
dL RAG*D~A 3R.46*DB
dt
kT
2w3kT (16.16)
(fapp
+
rwires)
- -
_-
-
-
$
rwires
=
2y’(~w
-
sin
-)
2
If surface diffusion or vapor transport is rapid enough, the pores will maintain their
quasi-static equilibrium shape, illustrated in Fig. 16.1 in the form of four cylindrical
sections of radius
R.6
The dihedral angle at the four intersections with grain
boundaries,
$,
will obey Young’s equation.
$
is related to
8
by sin($/2)
=
cos
8.
An exact expression can be calculated for the quasi-static capillary force,
Ywires,
as a function of the time-dependent length L(t). Young’s equation places a geomet-
ric constraint among
L(t), the cylinder’s radius of curvature
R(t),
and boundary
width
w(t); conservation of material volume provides the second necessary equa-
tion.
With
Twire(L) and w(L), Eq. 16.16 can be integrated. This model could
be extended to general two-dimensional loads by applying different forces onto the
horizontal and vertical grain boundaries in Fig. 16.1. The three-dimensional case,
with sections of spheres and a triaxial load, could also be derived exactly.
5An
exact quasi-static [e.g., surfaces
of
uniform curvature
(Eq.
14.29)] derivation exists
for
this
model [4].
6The Rayleigh instability (Section 14.1.2) of the pore channel is neglected. Pores attached to
grain boundaries have increased critical Rayleigh instability wavelengths [7].
392
CHAPTER
16:
MORPHOLOGICAL EVOLUTION: DIFFUSIONAL CREEP, AND SlNTERlNG
16.1.3
Morphological evolution and elongation can also occur by mass flux (and its associ-
ated volume) from the grain boundary through the bulk to the surface as illustrated
in Fig. 3.10~. For elongation of
a
crystalline material, vacancies could be created at
the grain boundary and diffuse through the grain to the surface, where they would
be removed. The quasi-steady-state rate of elongation can be determined by solv-
ing the boundary-value problem described in Section 3.5.3 involving the solution to
Laplace’s equation
V2@~
=
0
within each grain of the idealized bamboo structure.
For isotropic surfaces and grain boundaries,
@A
is given by Eqs. 3.76 and 3.84. The
expression for bulk mass flux is given by Eq. 13.3, and using the coordinate system
shown in Fig. 3.10, symmetry requires that
Evolution
of
Bamboo Wire by Bulk Diffusion
(16.17)
If the grain boundary remains planar, the flux into the boundary must be uniform,
=
C
=
constant
(%)
z=o
Laplace’s equation in cylindrical coordinates is
(16.18)
(16.19)
Assuming that the solution to
Eq.
16.19 is the product of functions of
z
and
r
and
using the separation-of-variables method (Section 5.2.4),
@A
=
[c1 sinh(kz)
+
cz
cosh(kz)][c~J0(kr)
+
c4Yo(kr)]
(16.20)
where clrc2,c3,c4, and
k
are constants to be determined, and
Jo
and
Yo
are the
zeroth-order Bessel functions of the first and second kinds. Because
@A(?-
=
0)
must be bounded,
c4
=
0.
Introducing a new variable
p(r,
z)
that will necessarily
vanish on the free surface,
(16.21)
The general solution to Eq. 16.19 is the superposition of the homogeneous solutions,
p(r,
z)
=
Jo(k,r)
[b,
sinh(k,z)
+
c, cosh(k,z)] (16.22)
n
The bamboo segment can be approximated
as
a cylinder of average radius
Re,
where
L
nRZL
=
1
nR2(z)
dz
The boundary condition
(Eq.
3.76) is then approximated by
@A=po+-
or, equivalently,
p(r
=
R,,
z)
=
o
Re
(16.23)
(16.24)
16.1:
MORPHOLOGICAL EVOLUTION
FOR
SIMPLE GEOMETRIES
393
The knR, quantities are the roots of the zeroth-order Bessel function of the first
kind,
Jo
(kRc)
=
0
(16.25)
The symmetry condition Eq. 16.17 is satisfied
if
b,
cosh(k,l/2)
+
c, sinh(knl/2)
=
0,
and therefore,
~(r,
2)
=
C
bnJo(knr) sinh(k,z)
-
coth
(
y)
cosh(k,r)]
(16.26)
n
The planar grain-boundary condition given by Eq. 16.18 is satisfied if
The coefficients,
b,kn,
of
Jo
in this Bessel function series can be determined [8]:
(16.28)
The constant
C
can be determined by substituting Eqs. 16.26 and 16.28 into the
force-balance condition (Eq. 16.5),
where
(16.29)
The total atom current into the boundary is
IA
=
-27rRz
JA;
therefore,
(16.31)
coth(k,l/2)
Bz
[T
k2R2
B
M
12
for L/Rc
M
2
[9].
The elongation-rate expressions for grain-boundary diffusion (Eq. 16.10) and
bulk diffusion (Eq. 16.31) for a bamboo wire are similar except for a length scale.
The approximate capillary shrinkage force
'Yapprox
cy~
reduces to the exact force
rbamboo
as the segment shapes become cylindrical, Rb
%
R,
%
l/&.
However,
because the grain-boundary diffusion elongation rate is proportional to *DB/R;f,
while the bulk diffusion rate is proportional to *DXL/R2, grain-boundary transport
will dominate at low temperatures and small wire radii.
394
CHAPTER
16
MORPHOLOGICAL EVOLUTION DIFFUSIONAL CREEP, AND SlNTERlNG
16.1.4
Figure
16.3
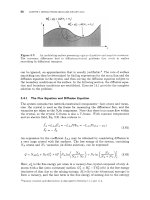
illustrates neck growth between two particles by surface diffusion. Sur-
face flux is driven toward the neck region by gradients in curvature. Neck growth
(and particle bonding) occurs
as
a result of mass deposition in that region of small-
est curvature. Because no mass is transported from the region between the particle
centers, the two spheres maintain their spacing at
2R
as the neck grows through
rearrangement of surface atoms. This is surface evolution toward a uniform po-
tential for which governing equations were derived in Section
14.1.1.
However, the
small-slope approximation that was used to obtain
Eq.
14.10
does not apply for the
sphere-sphere geometry. Approximate models, such as those used in the following
treatment of Coblenz et al., can be used and verified experimentally
[lo].
Neck Growth between Two Spherical Particles via Surface Diffusion
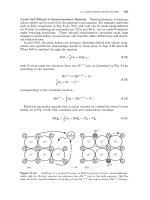
Overcut
/-
volume
I
Figure
16.3:
(a)
Model for formation
of
a
neck between two spherical particles due to
surface diffusion.
(b)
Approxiniation in which the surface diffusion zone within the saddle-
shaped neck regioii of
(a)
is
mapped
onto
a
riglit circular cylinder of radius
2.
t
is
the distance
parameter in the diffusion direction. Arrows parallel
to
the surface indicate surface-diffusion
directions in hoth (a) and (11).
From
Coblenz
et
al.
[lo].
Because of the proximity effect of surface diffusion, the flux from the regions
adjacent to the neck leaves an
undercut
region in the neck ~icinity.~ Diffusion
along the uniformly curved spherical surfaces is small because curvature gradients
are small and therefore the undercut neck region fills in slowly. This undercutting
is illustrated in Fig.
16.3~.
Because mass is conserved, the undercut volume is equal
to
the
overcut
volume. Conservation of volume provides an approximate relation
between the radius
of
curvature,
p,
and the neck radius,
x:
1/3
p
=
0.26~
(G)
(16.32)
This surface-diffusion problem can be mapped to a one-dimensional problem by
approximating the neck region as a cylinder of radius
x
as
shown in Fig.
16.3b.
The fluxes along the surface in the actual specimen (indicated by the arrows in
Fig.
16.3~)
are mapped to a corresponding cylindrical surface (indicated by the
arrows in Fig.
16.3b).
The zone extends between
z
=
12~~13.
The flux equation
has the same form
as
Eq.
14.4,
so
that'
JS
x
*Dsys
dr;
kT
dz
(16.33)
7The proxiniity effect
is
reflected in the strong wavelength dependence
of
surface smoothing (i.e.,
l/X4
in
Eq.
14.12).
sEquation
16.33
ignores the relatively small effect of the increase
in
energy due to the growing
grain boundary.
16
2:
DIFFUSIONAL
CREEP
395
The curvature has the value 2/R at
z
=
f2rrp/3 and approximately
-l/p
at
z
=
0
(neglecting terms of order
p/R).
The average curvature gradient -3/(2.irp2) can be
inserted into Eq. 16.33 for an approximation to the total accumulation at the neck
(per neck circumference),
3
6
*Dsys
.irkTp2
Is
M
26Js
M
(16.34)
The corresponding neck surface area is approximately
p
(per neck circumference),
and therefore the neck growth rate is approximately
dx
36*DSySR~
dt
.irkTp3
_N
N
(16.35)
Putting Eq. 16.32 into Eq. 16.35 and integrating yields the neck growth law,
(16.36)
Equation 16.36 predicts that
x(t)
K
t1I5
and that the neck growth rate will
therefore fall off rapidly with time. The time to produce a neck size that is a given
particle-size fraction is a strong function of initial particle size-it increases
as
R4.
Equation 16.36 agrees with the results of a numerical treatment by Nichols and
Mullins
[
111
.’
16.2
DIFFUSIONAL
CREEP
Mass diffusion between grain boundaries in a polycrystal can be driven by an ap-
plied shear stress. The result of the mass transfer is a high-temperature permanent
(plastic) deformation called
diffusional creep.
If the mass flux between grain bound-
aries occurs via the crystalline matrix (as in Section 16.1.3), the process is called
Nabarro-Herring creep.
If the mass flux is along the grain boundaries themselves
via triple and quadjunctions (as in Sections 16.1.1 and 16.1.2), the process is called
Coble creep.
Grain boundaries serve as both sources and sinks in polycrystalline materials-
those grain boundaries with larger normal tensile loads are sinks for atoms trans-
ported from grain boundaries under lower tensile loads and from those under com-
pressive loads. The diffusional creep in polycrystalline microstructure is geomet-
rically complex and difficult to analyze. Again, simple representative models are
amenable to rigorous treatment and lead to an approximate treatment
of
creep in
general.
16.2.1
A
representative model is a two-dimensional polycrystal composed of equiaxed
hexagonal grains. In a dense polycrystal, diffusion is complicated by the necessity
Diffusional Creep
of
Two-Dimensional Polycrystals
gDifferent growth-law exponents are obtained
for
other dominant transport mechanisms. Coblenz
et al. present corresponding neck-growth laws
for
the vapor transport, grain-boundary diffusion,
and crystal-diffusion mechanisms
[lo].
396
CHAPTER
16
MORPHOLOGICAL EVOLUTION DIFFUSIONAL CREEP, AND SlNTERlNG
of
simultaneous grain-boundary sliding-a thermally activated shearing process by
which abutting grains slide past one another-to maintain compatibility between
the grains. In the absence of sliding, gaps or pores will develop. Sliding is confined
to the grain-boundary region and occurs by complex mechanisms that are not yet
completely understood
[12].
The need for such sliding can be demonstrated by analyzing the diffusional creep
of the idealized polycrystal illustrated in Fig.
16.4
[12-151.
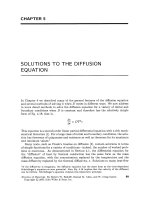
The specimen is sub-
jected to the applied tensile stress,
u,
which motivates diffusion currents between
the boundaries at differing inclinations and causes the specimen to elongate along
the applied stress axis. Figure
16.4
shows the currents associated with Nabarro-
Herring creep. Currents along the boundaries can occur simultaneously, and if
these dominate the dimensional changes, produce Coble creep. For the equiaxed
microstructure in Fig.
16.4,
there are only three different boundary inclinations
with respect to a general loading direction; these are exhibited by the boundaries
between grains
A,
B,
and
C
indicated in Fig.
16.4.
Mass transport between these
boundaries will cause displacement of the centers of their adjoining grains. The
normal displacements are indicated by
LA,
LB,
and
Lc
in Fig.
16.4
and the shear
displacements by
SA,
SB,
and
Sc.
These combined grain-center displacements
produce an equivalent net shape change of the polycrystal.
Compatibility relationships between the displacements must exist
if
the grain
boundaries remain intact. Along the
1
axis, the displacement
of
grain
C
relative to
grain
B
must be consistent with the difference between the displacement
of
grain
C
with respect to grain
A
and with that of grain
B
with respect to grain
A.
This
requirement is met
if
LA
+
LB
-
2LC
=
v5sA
-
d3sB
Similarly, along the
2
axis,
Also, the volume must remain constant. Therefore,
El1
+
E22
=
0
2
t
(16.37)
(
16.38)
(16.39)
Figure
16.4:
subjected
to
uniaxial applied stress,
g,
giving rise to an axial strain rate
t.
From Beer6
[14].
Two-dimensional polycrystal consisting
of
identical hexagonal grains
16.2:
DIFFUSIONAL
CREEP
397
where
~11
and
~22
are the normal strains of the overall network connecting the
centers of the grains in the
(1,2)
coordinate system in Fig. 16.4.
These strains are related to the displacements through
~11
=
dul/dzl,
~22
=
duz/dzz, and
~12
=
(1/2)(dul/dz2 $duz/dzl), where the
ui
are the displacements
produced throughout the network of grain centers. For the representative unit cell
PQRS
in Fig. 16.4,
AC1- AB1
d
El1
=
(16.40)
where
d
is the width of a hexagonal grain, and ABi and
ACi
are the components of
the displacements of the centers of the grains
B
and
C
relative to
A
and are given
bY
2AB1=
asB
-
LB
2AB2
=
-SB
+
&
LB
2AC2
=
SA
+
&LA
(16.41)
2ac1
=
-&sA
+
L~
Therefore.
8
(SB
-
SA)
LA
+
LB
2d
-k
2d
El1
=
Substituting Eqs. 16.42 into Eq. 16.39 yields
Combining Eqs. 16.38, 16.37, and 16.43,
and
L~
+
L~
+
L~
=
o
(16.42)
(16.43)
(16.44)
(16.45)
which is equivalent to the constant-volume condition.
To show that boundary sliding must participate in the diffusional creep to main-
tain compatibility, suppose that all
of
the
SA, SB,
and
Sc
sliding displacements are
zero. Equations 16.44 require that the
LA, LB,
and
Lc
must also vanish. There-
fore, nonzero
Si
's
(sliding) are required
to
produce nonzero grain-center normal
displacements.
398
CHAPTER
16
MORPHOLOGICAL EVOLUTION DIFFUSIONAL CREEP AND SlNTERlNG
This result can be demonstrated similarly by solving for the strain,
E,
along the
applied tensile stress axis shown in Fig. 16.4 in terms of only the
Lz’s
or only the
9’s:
E
=
cos
2
eEll
+
sin2
e~~~
+
2
sin
e
cos
e~~~
(16.46)
or, using Eq. 16.40-16.44,
1
LA
-
LB
v5
2
sin
8
cos
0
(L~
+
L~)(I
-
2cos2e)
+
d
(16.47)
]
(16.48)
2
sin
0
cos
0
2sc
-
SA
-
SB
1
SA-SB
dv5
3
&=-[
(1
-
2
COS~
e)
+
Equation 16.47 indicates that the creep strain may be regarded as diffusional trans-
port accommodated by boundary sliding, and Eq. 16.48 indicates that it may
equally well be regarded as boundary sliding accommodated by diffusional trans-
port.l0 The creep rate,
t,
can be obtained by taking time derivatives of
E
in
Eqs. 16.47 and 16.48. The applied tensile stress,
0,
shown in Fig. 16.4 will generate
stresses throughout the polycrystal, and each boundary segment will, in general,
be subjected to a shear stress (parallel to the boundary) and a normal stress (per-
pendicular to the boundary). The shear stresses will promote the grain-boundary
sliding displacements,
SA, SB,
and Sc, while the normal stresses will promote
the diffusion currents responsible for the
LA, LB,
and
Lc
displacements.
A
de-
tailed analysis of the shear and normal stresses at the various boundary segments
is available (see also Exercise 16.2) [12-141.
16.2.2
The analysis can be extended to a three-dimensional polycrystal with an equiaxed
grain microstructure.
As
in two-dimensional creep, grain-boundary sliding must
accompany the diffusional creep, and because these processes are interdependent,
either sliding or diffusion may be rate limiting. In most observed cases, the rate
is controlled by the diffusional transport [14, 15, 18, 191. Exact solutions for cor-
responding tensile strain rates are unknown, but approximate expressions for the
Coble and Nabarro-Herring creep rates under diffusion-controlled conditions where
the boundaries act as perfect sources may be obtained from the solutions for the
bamboo-structured wire in Section 16.1.1. The equiaxed polycrystal can be approx-
imated as an array of bonded bamboo-structured wires with their lengths running
parallel to the stress axis and with the lengths of their grains (designated by
L
in
Fig. 3.10) equal to the wire diameter, 2R. This produces a polycrystal with an
approximate equiaxed grain size
d
=
L
=
2R. The Coble and Nabarro-Herring
creep rates of this structure can be approximated by those given for the creep rates
of the bamboo-structured wire by Eqs. 16.10 and 16.31 with
L
=
2R
=
d
and the
sintering potential set to zero. In this approximation, the effects of internal normal
stresses generated along the vertical boundaries (between the bonded wires) may
be neglected because these stresses are zero on average. Using this approximation,
for diffusion-controlled Coble creep,
Diffusional Creep
of
Three-Dimensional Polycrystals
(16.49)
‘OThis duality has been recognized (e.g., Landau and Lifshitz
[16]
and Raj and
Ashby
[17]).
16.2:
DIFFUSIONAL
CREEP
399
0.0
9
-2.0.
*
4.0-
5
3
-
-6.0-
-8.0
with
A1
=
32, and for diffusion-controlled Nabarro-Herring creep,
Theoretical shear stress
Dislocation glide
Dislocation creep
.
Elastic
(16.50)
with
A2
=
12." Because the Coble creep rate is proportional to
*DB/d3
and the
Nabarro-Herring rate to
*DXL/d2,
Coble creep will be favored as the temperature
and grain size are reduced.
Figure 16.5 shows a
deformation
map
for polycrystalline Ag possessing a grain
size of
32
pm strained
at
a rate of 10-8s-1 [20]. Each region delineated on the
map indicates a region of applied stress and temperature where
a
particular ki-
netic mechanism dominates. Experimental data and approximate models are used
to produce such deformation maps. The mechanisms include elastic deformation
at low temperatures and low stresses, dislocation glide at relatively high stresses,
dislocation creep at somewhat lower stresses and high temperatures, and Nabarro-
Herring and Coble diffusional creep at high temperatures and low stresses. Coble
creep supplants Nabarro-Herring creep as the temperature is reduced. An analysis
of diffusional creep when the boundaries do not act as perfect sources and sinks has
been given by Arzt et al. [19] and is explored in Exercise 16.1.
The creep rate when boundary sliding
is
rate-limiting has been treated and
discussed by Beer6
[13,
141.
If
a viscous constitutive relation is used for grain-
boundary sliding (i.e., the sliding rate is proportional to the shear stress across the
boundary), the macroscopic creep rate is proportional to the applied stress, and
the bulk polycrystalline specimen behaves as a viscous material. An analysis of
the sliding-controlled creep rate of the idealized model in Fig. 16.4 is taken up in
Exercise 16.2.
Variable boundary behavior complicates the results derived from the uniform
equiaxed model presented above. Nonuniform boundary sliding rates may cause
cases by factors aslarge
as
three. See Ashby
[20],
Burton
[18],
Arzt
et
al.
[19],
and Pilling and
Ridley
[15].
400
CHAPTER
16:
MORPHOLOGICAL EVOLUTION: DIFFUSIONAL CREEP, AND SlNTERlNG
individual grains to rotate. Also, grain-boundary migration and the formation of
new grains by recrystallization will affect both microstructure and creep rate.12
Finally, mechanisms besides diffusional transport of mass between internal in-
terfaces can contribute to diffusional creep. For instance, single crystals containing
dislocations exhibit limited creep
if
the dislocations act as sources and sinks, de-
pending on their orientation with respect to an applied stress (see Exercise
16.3).
16.3
SlNTERlNG
Sintering is
a
kinetic process that converts
a
compacted particle mass (or powder)
or fragile porous body into one with more structural integrity. Increased mechan-
ical integrity stems from both
neck
growth
(due to mass transport that increases
the particle/particle “necks”) and densification (due to mass transport that reduces
porosity). The fundamental sintering driving force-capillarity-derives from re-
duction
of
total surface energy and
is
often augmented by applied pressure.
The kinetic transport mechanisms that permit sintering are solid-state processes,
and therefore sintering is an important forming process that does not require melt-
ing. Materials with high melting temperatures, such as ceramics, can be molded
into
a
complex shape from
a
powder and subsequently sintered into
a
solid body.I3
16.3.1 Sintering Mechanisms
Neck growth can occur by any mass transport mechanism. However, processes that
permit shrinkage by pore removal must transport mass from the interior of the
particles to the pore surfaces-these mechanisms include grain-boundary diffusion,
volume diffusion, and viscous flow. Other mechanisms simply rearrange volume at
the pore surfaces and contribute to particle/particle neck growth without reduction
in porosity and shrinkage-t hese mechanisms include surface diffusion and vapor
transport. Particle compacts and porous bodies have complex geometries, but
models for sintering and shrinkage can be developed for simpler geometries such as
the one captured in Fig.
16.6.14
These models can be used to infer behaviors of
-Time-
Figure
16.6:
h’Iodel
sint,rririg
cxpcriiricrit
drrrioristratirig
neck
growth during sint,ering
by
viscous
flow
of
iiiitially splierical
3
imri
diameter
glass
beads
at
1000°C
over
30
iriiiiutes.
Courtesy
of
Hans-Eckart
Exner.
I2These phenomena, and their effects on the creep rate, are described in more detail by Sutton
and Balluffi
[12],
Beer6
[13, 141;
and Pilling and Ridley
[15].
13General reviews
of
sintering appear in introductory ceramics texts
[21, 221,
and
a
more complete
exposition is given in German’s book on sintering
[23].
14Further details about such models can be found in Reviews in Powder Metallurgy and Physical
Ceramics
or
in Physical Metallurgy
[24, 251.
163
SlNTERlNG
401
complex systems of which these simpler geometries are component parts.
Figure 16.7 summarizes the atom-transport paths that can contribute to neck
growth and also, in some cases, densification. If the particles are crystalline, a grain
boundary will generally form at the contact region (the neck). A dihedral angle
y
will form at the neck/surface junction, and for the isotropic case, conform to Young’s
equation,
yB
=
27’
cos($/2). The seven different transport paths in Fig. 16.7 are
listed in Table 16.1 with their kinetic mechanisms. Atoms generally flow to the neck
region, where the surface has a large negative principal curvature and therefore a low
diffusion potential compared to neighboring regions. Densification will accompany
neck growth
if
the centers
of
the abutting spheres move toward one another. For
example. with mechanism
BS.B,
atoms are removed from the boundary region
causing such motion.
The dominant mechanism and transport path-or combinations thereof-depend
upon material properties such as the diffusivity spectrum, surface tension, temper-
ature, chemistry, and atmosphere. The dominant mechanism may also change as
the microstructure evolves from one sintering stage to another.
Sintering
maps
that indicate dominant kinetic mechanisms for different microstructural scales and
environmental conditions are discussed in Section 16.3.5.
Figure
16.7:
(a)
Sintering
of
two abutting single-crystal spherical particles of differing
crystal orientations.
A
grain boundary has formed across the neck region.
(b)
Detail
of
neck
perimeter. Seven possible sintering mechanisms
for
the growth
of
the neck are illustrated
(see the text and Table
16.1).
16.3.2
Sintering Microstructures
Powder compressed into a desired shape at room temperature provides an initial
microstructure for a typical sintering process. Such a microstructure may be com-
posed of equiaxed particles or the particles may vary in size and shape. Particle
packing may be regular and nearly ‘krystalline,” highly irregular, or mixtures of
both. Sintering microstructures are generally complex, but some aspects
of
their mi-
crostructural evolution can be understood by investigating primary process models
such as those described in Section 16.1 and the simple neck-growth models presented
in Section 16.1.4. However, some microstructural evolution processes are not eas-
ily captured by simple models. Additional modeling difficulties arise for irregular
packings, variability in particle size and shape, and inhomogeneous chemistry.
402
CHAPTER
16.
MORPHOLOGICAL EVOLUTION. DIFFUSIONAL CREEP, AND SlNTERlNG
Table
16.1:
Mass Transport Mechanisms for Sintering
Transport Densifying
or
Mechanism Source Sink Mechanism Nondensifying
SS.XL
Surface Surface Crystal diffusion Nondensifying
Atoms diffuse through the crystal from larger-curvature surface regions to lower-
curvature regions.
BS.XL
Boundary Surface Crystal diffusion Densifying
Atoms diffuse through the crystal from the grain boundary to low-curvature sur-
face regions.
~~ ~
BS.B
Boundary Surface Boundary diffusion Densifying
Atoms diffuse along the boundary to the surface; subsequently, they are trans-
ported along the surface by one
or
more of the
SS.XL,
SS.S,
or
SS.V
paths.
DS.XL
Dislocation Surface Crystal diffusion Either
Atoms diffuse through the crystal from climbing dislocations. Equivalently,
va-
cancies diffuse from the surface.
~~~~~ ~~
ss.s
Surface Surface Surface diffusion Nondensifying
Atoms diffuse along the surface from larger-curvature surface regions to lower-
curvature surface regions.
ss.v
Surface Surface Vapor transport Nondensifying
Atoms are transported through the vapor phase from larger-curvature surface
regions to lower-curvature surface regions.
VF
- -
Viscous
flow
Either
Atoms are transported by viscous
flow
by differences in the capillary pressure at
nonuniformly curved surfaces.
Nevertheless, there are parallel stages in any powder sintering process that can
be used to catalog behavior. Each powder sintering process begins with parti-
cle/particle neck formation and a porous phase between the weakly attached par-
ticles.
As
these necks grow, the particle/pore interface becomes more uniformly
curved but remains interconnected throughout the compact. Before the porous
phase is removed, it becomes disconnected and isolated at pockets where four grain
boundaries intersect.
Initial, Intermediate, and Final Stages
of
Powder Sintering.
Following Coble’s pio-
neering work, the microstructural evolution of a densifying compact is separated
into an
initial stage,
an
intermediate stage,
and a
final stage
of sintering
[26].
Fig-
ure
16.8
illustrates some of the microstructural features
of
each stage.
The initial stage comprises neck growth along the grain boundary between abut-
ting particles. The intermediate stage occurs during the period when the necks
between the particles are no longer small compared to the particle radii and the
porosity is mainly in the form
of
tubular pores along the three-grain junctions in
the compact. The geometries of both the initial and intermediate stages therefore
have intergranular porosity percolating through the compact.
16.3
SlNTERlNG
403
Initial powder Initial stage Intermediate stage Final stage Dense polycrystal-
compact
of
sintering
of
sintering
of
sintering line compact
Figure
16.8:
Stages
of
powder
sinterin
.
Initial
stage
involves
neck
growth. Intermediate
state
is marked
by
continuous porosity
jong
three-grain junctions. Final stage
involves
removal
of
isolated
pores
at
four-grain
junctions. Figure
calculated
using
Surface Evolver
[27]
;
figure
concept
by
Coble
[26].
Courtesy
of
Ellen
J.
Siem.
The transition from the intermediate to the final stage occurs when the intercon-
nected tubular porosity along the grain junctions (edges) breaks up because of the
Rayleigh instability (see Section 14.1.2) and leaves isolated pores of equiaxed shape
at the grain corners
[7].
The final stage occurs when the porosity is isolated and
located at multiple-grain junctions. Final pore elimination occurs by mass transfer
from the grain boundaries to the pores attached to the grain boundaries. similar to
the transport in the wire-bundle model treated in Section 16.1.2. If grain growth
occurs during any stage, the pores may break away from the grain boundaries. In
such cases, the pores will be isolated from the grain boundaries in the final stage.
and further densification will be limited by the rate of crystal diffusion of atoms
from dislocation sources by the mechanism
DS.XL
illustrated in Fig. 16.7. Failure
to reach full density is often caused by such pore breakaway.
16.3.3 Model Sintering Experiments
Experiments have been designed to reveal details of the sintering mechanisms indi-
cated by Fig. 16.7 and the sintering stages illustrated by Fig. 16.8. Such sintering
experiments include sphere-sphere model experiments similar to that depicted in
Fig. 16.6
[28],
sintering of rows of spheres [29], sintering of spheres and wires to flat
plates
[30],
and sintering of bundles of wires such as that depicted in Fig. 16.9
[31].
With their simple geometry, these model experiments reveal fundamental pro-
cesses during the various stages of sintering. Initial-stage processes are illuminated
by the sphere-sphere experiments, and transitions between the intermediate and
final stages are captured in the wire-bundle experiments. Figure 16.9d, in par-
ticular, demonstrates the important role of grain-boundary attachment for pore
removal-essentially all of the grain-boundary segments trapped between the pores
have broken free and left the specimen. However, one boundary remains and con-
tinues to feed atoms
to
the pores to which it is connected.
16.3.4 Scaling
Laws
for Sintering
Because the surface energy per volume is larger for small particles and because
the fundamental driving force for sintering is surface-energy reduction, compacts
composed of smaller powders will typically sinter more rapidly. Smaller powders
are more difficult to produce and handle; therefore, predictions of sintering rate
dependence on size are used to make choices of initial particle size. Herring’s
404
CHAPTER
16
MORPHOLOGICAL EVOLUTION DIFFUSIONAL CREEP, AND SINTERING
(c)
Figure
16.9:
at
900°C:
(a)
50
11.
(b)
100
h,
(c)
300
h;
and
at
1075°C:
(d)
408
h.
Balluffi
[31]
Cross
section
of
bundle
of
parallel
128
pn
diameter
Cu
wires after sintering
From
Alexander
and
scaling
laws
provide
a
straightforward method
to
predict sintering rate dependence
on length scale
[32].
Suppose that two sintering systems,
S
and
B.
are identical in all aspects ex-
cept their size.15 Each length dimension of system
B
is
X
times
as
large as the
corresponding dimension
of
system
S.
Under identical conditions and provided
that the same sintering mechanism is operative. the ratio
of
sintering rates can be
determined from the relative sizes of the specimens.
In general, a sintering rate is proportional to the mass-transport current,
I,
due
to sintering driving forces and is inversely proportional to the transported material
volume,
AV.
required to produce
a
given shape change (e.g., the volume associated
with neck growth). The current
I
is the vector product of the atoniic
flux
:and
the area
A’
through which the current flows during sintering. Therefore, the rates
at
which bodies
S
and
B
undergo geometrically similar changes will be in the ratio
(16.51)
rateB
IB
AVs
rates
AVB
IS
The current,
I,
is
proportional to the diffusion potential gradient,
V@*
and
to
the
cross-sectional
area.
A,
through which this flux flows. Therefore,
-=
(16.52)
Suppose that the plane
A’
is
the bisector between the source
of
atoms and their
sink (i.e the sources and sinks listed in Table 16.1). The component
of
diffusion
I5The systems may be similar powder compacts
of
the same powder material
but
differing particle
sizes, or they may be model systems such as those illustrated in Figs.
16.6
arid
16.9
but with all
corresponding length dimensions scaled similarly.
163
SlNTERlNG
405
potential gradient normal to the plane
A’
(the component projected onto the normal
A
of
A)
is proportional to the difference in diffusion potential between the source and
the sink,
A@,
divided by the distance
A1
between the source and sink. Therefore,
Combining these relationships with Eq.
16.51,
rate’
A@’
Als
AB
AVs
rates
A@s
A~B
As
AV’
(16.53)
(16.54)
For free sintering, the diffusion potential is proportional to curvature;
A@’/A@s
will scale as
1/X.
The ratio
Als/AlB
also scales as
1/X.
For surface diffusion, one of the cross-sectional area’s dimensions is
6,
the thick-
ness of the high-diffusivity surface layer, independent of system size. The remain-
ing cross-sectional area length scales as
A,
and therefore
AB/As
must scale as
A.
AVSIAVB
scales as
l/X3.
Therefore, substituting into Eq.
16.54,
rateB
1
1
1
rates
X
X
A3
(16.55)
-
-
x
-
x
X
x
-
=
(surface diffusion)
If sintering occurs by diffusion through the bulk crystal (mechanism
BS.XL),
all the ratios will be the same as for surface diffusion except for the cross-sectional
area
AB/A~,
which will scale
as
X2.
Therefore,
rateB
1
1
1
-
-
x
-
x
X2
x
-
=
rates
X
X
X3
(16.56)
(crystal diffusion)
If sintering occurs by grain-boundary diffusion, the ratio of rates will be the same
as for the surface-diffusion case, A
X-’
scaling law can be derived for viscous
flow and a
To show that the rate of two-particle neck growth by surface diffusion in Sec-
tion
16.1.4
is consistent with the
XP4
scaling law, Eq.
16.36
can be written in terms
of its fundamental length scales and differentiated:
law applies for vapor transport
[32].
1
dx
R
x
dt
x5
0;-
(16.57)
Therefore,
A
similar result may be obtained (Exercise
16.6)
using the result derived in Eq.
16.16
for the neck growth for
a
bundle of parallel wires by grain-boundary diffusion.
16.3.5
Sintering Mechanisms Maps
Any of the various mechanisms for sintering identified in Table
16.1
may contribute
to the sintering rate. Which of the mechanisms contributes most to sintering de-
pends on, among other things, particle size and temperature. Sometimes certain
406
CHAPTER
16:
MORPHOLOGICAL EVOLUTION: DIFFUSIONAL CREEP, AND SlNTERlNG
mechanisms can be ruled out immediately. For example, viscous
flow
(VF)
cannot
contribute for crystalline materials, and the nondensifying mechanisms (e.g.,
SS.S
and
SS.V)
cannot contribute to pore removal in the final stages of sintering.
Processing decisions depend on the particular mechanism, or combination of
mechanisms, that contribute to sintering. Sintering maps such as Fig. 16.10 pro-
vide information for such decisions. These plots can be created by employing ap-
proximate models for the sintering rates for specific systems by the various mecha-
nisms. These models, combined with experimental data, can be used to plot regimes
for which a particular mechanism makes the largest contribution to the sintering
rate
[33].
Sintering maps for different systems vary considerably-even for the same mate-
rial, but having different initial particle sizes. For example, a map corresponding to
Fig. 16.10 for silver particles of a smaller radius (i.e., 10 pm) shows a considerably
reduced field for the
BSsXL
mechanism. On the other hand, a map for
10
pm
UOZ
particles shows a vapor-transport
(SSsV)
regime [33]. Scaling laws are limited to
regions of the sintering map where the dominant mechanism is unchanged (Sec-
tion 16.3.4). Although sintering mechanism maps are no better than the models
and data used to construct them, they provide useful insights.
Temperature
(“C)
400
500
600
700
800
900
Full
density reached
0.50
0.60
0.70
0.80
0.90
1.0
Homologous temperature,
T/T,
Fi
ure
16.10:
Sintering mechanism map for silver powder of radius 100 p,m plotted
wik coordinates of reduced temperature and neck radius. The assumed conditions are that
grain boundaries remain between abutting particles and that no trapped gases are
to impede isolated pore shrinkage. Each region represents the regime where the in%%::
mechanism is dominant (see Table 16.1). The dashed line indicates transitions between
initial-stage and intermediate- and final-stage sinterine. Although all possible mechanisms
were considered, the three shown were dominant in their respective regimes.
From
Ashby
[33].
Bibliography
R.B.
Heady and
J.W.
Cahn. An analysis of capillary force in liquid-phase sintering
of
spherical particles.
Metall.
Trans.,
1(1):185-189, 1970.
J.W.
Cahn and
R.B.
Heady. Analysis of capillary force in liquid-phase sintering of
jagged particles.
J.
Am.
Cerum.
SOC.,
53(7):406-409, 1970.
W.C.
Carter.
The forces and behavior of fluids constrained by solids.
Actu
Metall.,
36(8):2283-2292, 1988.
16.3:
SlNTERlNG
407
4. R.M. Cannon and W.C. Carter. Interplay of sintering microstructures, driving forces,
and mass transport mechanisms.
J.
Am. Ceram. SOC.,
72(8):1550-1555, 1989.
5.
F.
M.
Orr,
L. W. Scrivin, and
T.
Y. Chu. Mensici around plates and pins dipped in
liquid-interpretation
of
Wilhemy plate and solderability measurements.
J.
Colloid
Interf. Sci.,
60:402-405, 1977.
6. H. Udin, A. J. Shaler, and.J. Wulff. The surface tension of copper.
Trans. AIME,
7. W.C. Carter and A.M. Glaeser. The morphological stability of continuous intergran-
ular phases-thermodynamics considerations.
Am. Ceram. SOC.
Bull.,
63(8):993-993,
1984.
8.
F.B. Hildebrand.
Advanced Calculus for Engineers.
Prentice-Hall, Englewood Cliffs,
9. C. Herring. Diffusional viscosity of
a
polycrystalline solid.
J.
Appl. Phys.,
21:437-445,
10. W.S. Coblenz, J.M. Dynys, R.M. Cannon, and R.L. Coble. Initial stage solid-state
sintering models: A critical analysis and assessment. In G. C. Kuczynski, editor,
Pro-
ceedings
of
the Fijlh International Conference on Sintering and Related Phenomena,
pages 141-157, New
York,
1980. Plenum Press.
11.
F.A. Nichols and W.W. Mullins. Surface- (interface-) and volume-diffusion contribu-
tions to morphological changes driven by capillarity.
Trans. AIME,
233( 10):1840-1847,
1965.
12. A.P. Sutton and R.W. Balluffi.
Interfaces
in
Crystalline Materials.
Oxford University
13. W. Beer& Stress redistribution during Nabarro-Herring and superplastic creep.
Metal
14. W. Beer& Stresses and deformation at grain boundaries.
Phil. Trans.
Roy.
SOC.
London A,
288(1350):177-196, 1978.
15. 3. Pilling and
N.
Ridley.
Superplasticity in Crystalline Solids.
Institute of Metals,
London, 1989.
16. L.D. Landau and E.M. Lifshitz.
Statistical Physics.
Pergamon Press, New York, 1963.
17. R. Raj and M.F. Ashby.
On grain boundary sliding and diffusional creep.
Metall.
18.
B. Burton.
Diffusional Creep
of
Polycrystalline Materials.
Diffusion and Defect Mono-
19.
E.
Arzt, M.F. Ashby, and R.A. Verrall.
Interface controlled diffusional creep.
Acta
20. M.F. Ashby. A first report on deformation mechanism maps.
Acta Metall.,
20(7):887-
21. Y M. Chiang, D. Birnie,
and
W.D.
Kingery.
Physical Ceramics.
John
Wjley
&
Sons,
22. W.D. Kingery,
H.K.
Bowen, and D.R. Uhlmann.
Introduction to Ceramics.
John
23. R.M. German.
Sintering Theory and Practice.
John Wiley
&
Sons, New
York,
1996.
24. H.E. Exner. Principles of single phase sintering.
Reviews on Powder Metallurgy and
25. R.W. Cahn. Recovery and recrystallization. In R.W. Cahn and
P.
Haasen, editors,
186:186-190, 1949.
NJ, 2nd edition, 1976.
1950.
Press, Oxford, 1996.
Sci.,
10(4):133-139, 1976.
Trans.,
2:
11
13-1 127, 1971.
graph Series,
No.
5. Trans Tech Publications, Bay Village, OH, 1977.
Metall.,
31(12):1977-1989, 1983.
897, 1972.
New
York,
1996.
Wiley
&
Sons, New
York,
1976.
Physical Ceramics,
1:l-237, 1979.
Physical Metallurgy,
pages 1595-1671. North-Holland, Amsterdam, 1983.
408
CHAPTER
16:
MORPHOLOGICAL EVOLUTION: DIFFUSIONAL CREEP, AND SlNTERlNG
26.
R.L.
Coble. Sintering crystalline solids I. Intermediate and final state diffusion models.
27. K. A. Brakke. The Surface Evolver.
Exp.
Math.,
1(2):141-165, 1992. Publicly available
28.
W.
Zhang,
P.
Sachenko,
J.H.
Schneibel, and I. Gladwell. Coalescence of two particles
with different sizes by surface diffusion.
Phil. Mag.
A,
82(16):2995-3011, 2002.
29.
W.D.
Kingery and
M.
Berg. Study of the initial stages of sintering solids by viscouus
flow, evaporation-condensation, and self-diffusion.
J.
Appl.
Phys.,
26( 10):1205-1212,
1955.
30.
G.C.
Kuczynski.
Theory of solid state sintering. In
W.
Leszynski, editor,
Powder
J.
Appl.
Phys.,
32(5):787, 1961.
software.
Metallurgy,
pages 11-30, New York, 1961. Interscience Publishers.
31.
B.H. Alexander and
R.W.
Balluffi.
Mechanism of sintering
of
copper.
Acta Metall.,
32. C. Herring. Effect of change of scale
on
sintering phenomena.
J.
Appl.
Phys.,
21:301-
33. M.F. Ashby. A first report on sintering diagrams.
Acta Metall.,
22(3):275-289, 1974.
5(11):666-677, 1957.
303, 1950.
EXERCISES
16.1
An analysis of the rate of elongation of a wire possessing a bamboo-type grain
structure is given in Section 16.1.3. An essential aspect of the analysis is the
assumption that the stress-induced atomic transport producing the elongation
is diffusion-limited. Now, construct the main framework of a model for the
same system in which the atomic transport is source-limited,
as
indicated
below, and explain how the model works.
0
Assume that the grain boundaries are much poorer sources than the
wire surface and that it is the poor source action of the boundaries that
causes the process to be source-limited.
0
Use the simple rate-constant type of formulation employed in Sections
13.4.2 and
15.1.1
to analyze source-limited precipitate growth and par-
ticle coarsening, respectively.
0
Assume, as in Section 16.1.1, that the diffusion occurs via vacancies and
that the rate-limiting process is the rate of creation and destruction of
vacancies
at
the grain boundaries.
Solution.
When the process
is
diffusion-limited and the rate-constant formalism is
used, the net rate
at
which vacancies are destroyed at
a
boundary (i.e,, the rate of
destruction minus the rate of creation) is
IB
=
2
lR
KB
[c;(r)
-
CE.~~(~)]
27rr
dr
The corresponding rate at the free surface of the cell, which is of length
L,
is
Is
=
lL
KS
[c;
-
c$~~]
27rRd.z
(16.59)
(16.60)
EXERCISES
409
IB
is negative, since
cF,~~
>
c;
and vacancies are being created, whereas
Is
is positive,
since
c$
>
c$~~
and vacancies are being destroyed. The crystal diffusive current at each
interface is equal to the net destruction rate, and therefore
,I&
=
IB
and
Iiff
=
Is
(16.61)
In addition, in the quasi-steady state,
BB
S
S
I
=
Idiff
=
-I
=
Idiff
and the elongation rate,
1,
is
given by
(16.62)
(16.63)
The diffusion within the grains is relatively slow,
so
that
I&
=
IB
and
I&
=
Is
are
small compared to the vacancy creation and destruction rates in the equations above.
Therefore,
c;
2
~t'~~
and
c$
E
cZeq
and the rate is diffusion-limited,
When the rate is source-limited, the vacancy diffusion rate within the grains
is
relatively
large.
KB
<<
KS
and the relatively slow source action at the boundary has a negligible
efFect on the vacancy gradients within the grains. The vacancy concentration is then
maintained everywhere at an essentially constant level corresponding to
cZeq
as a result
of the relatively
fast
source action at the wire surface.
IB
is
then given by Eq.
16.59
with
c;
E
cZeq.
Because the stress and the concentration
cFSeq
are uniform over the
boundary, the elongation rate
is
(16.64)
The equilibrium vacancy concentration is given, in general, by Eq.
3.65,
which for present
purposes may be written in the form
(16.65)
where
Gfv(m)
is the work required to form a vacancy at a flat stress-free surface and
AGf,
is any additional work. The wire volume
is
increased when
a
vacancy is formed,
and in the present model
AGG
is negative when a vacancy is formed at the grain
boundary because of the work done by the applied tensile stress during
its
formation.
On the other hand,
AGf,
is
positive at the wire surface because of the work that must
be done to increase the surface area. Therefore,
cF'~~
>
c?~~
and
dL/dt
is positive.
16.2
Consider the diffusional creep
of
the idealized two-dimensional polycrystal
illustrated in Fig. 16.4 and discussed in Section 16.2. Each boundary will
be subjected to a normal stress,
on,
and a shear stress,
us,
as illustrated
in Fig. 16.11. Suppose that all boundaries shear relatively slowly at a rate
corresponding to
-_
dS
-
Ka,
dt
(16.66)
where
K
is a boundary shear rate constant, whereas diffusional transport
between the different boundary segments is extremely rapid. The creep will
then proceed at a rate controlled by the rate
of
the grain-boundary sliding and
not by diffusional transport through the grains or along the grain boundaries.
Using the results in Section 16.2, find an expression for the sliding-limited
creep rate
of
the specimen illustrated in Figs. 16.4 and 16.11.
410
CHAPTER
16
MORPHOLOGICAL EVOLUTION DIFFUSIONAL CREEP, AND SlNTERlNG
Figure
16.11:
subjected to uniaxial applied stress,
0.
The geometry
is
the same
as
in Fig.
16.4.
Normal stresses and shear stresses present in two-dimensional polycrystal
Determine the shear stresses acting on the three types of boundary segments
present. When diffusion is extremely rapid, all differences in the diffusion
potential will be eliminated, and all three normal stresses at the three different
types of boundary segments will be uniform along each segment and equal to
one another. Therefore,
on
A=
f-‘n
B=
on
C=
cn
(16.67)
Also, if each grain is not to rotate,
0,”
+
u,”
+a:
=
0
(16.68)
Since the stresses in each grain are the same, the normal and shear stresses
along planes
PQ
and
RS
can be found from the forces exerted on them by
the applied stress,
u,
with the results
uf
=
sinecosea
u,”
=
sin2
e
cr
4
2
1
“I
4
cos2
e
+
-
sinecose
+
-
sin2
e
u
”
(
16.69)
1
crt
=
[Icos2e+
3
-sinecose+
fl
-sin20
1
u
2
4
Next, each triangular shaded region in Fig. 16.11 must be in mechanical equi-
librium (i.e., the sum of the forces on it parallel and normal to
PQ,
or
RS,
must be zero). This leads to the conditions
0
=
-
2&u,”
-
u,B
+2&u,
+u,”
0
=2u,D
+u,B
+a,”
o=
-2u,E+u,”+a~
0
=
2&,”
+
u,”
-
2&an
-
us
c
(16.70)
These linear equations are sufficient to allow the determination of the shear
stress acting on each boundary segment.
EXERCISES
411
Solution.
Expressions for the shear stresses at the three types of boundary segments
may be obtained by the simultaneous solution of the equations given above for the
boundary stresses. The results are
a:
=
[A
cos20 -sinOcose
-
-
u
“I
2
(16.71)
UF
=
2sinecos~a
The expression for the creep rate due to boundary sliding is obtained by differentiating
Eq. 16.48,
Substituting Eqs. 16.66 and 16.71 into Eq. 16.72 then produces the surprisingly simple
result
(16.73)
.K
d
The creep rate is therefore proportional to the applied stress, and the polycrystal acts
effectively as an ideally viscous material.
E=-u
16.3
Diffusional creep can also occur by means of the stress-motivated transport
of atoms between climbing dislocations in a material. This is illustrated in a
highly idealized manner in Fig.
16.12,
where a regular array of edge disloca-
tions possessing four different Burgers vectors is present in a stressed material.
The net Burgers vector content is zero. The stress exerts climb forces on the
dislocations
so
that dislocations with Burgers vectors lying along
&x
and
&g
directions act alternately as sources and sinks. The arrows indicate the atomic
fluxes associated with the climb. Each source dislocation is surrounded by
four nearest-neighbor sink dislocations, and vice versa for the sink disloca-
Y
t
f
U
Figure
16.12:
show
stress-induced diffusion current around each climbing dislocation.
Idealized array
of
edge dislocations subjected
to
applied stress,
u.
Arrows
412
CHAPTER
16:
MORPHOLOGICAL EVOLUTION: DIFFUSIONAL CREEP, AND SlNTERlNG
tions. The climb of the dislocations in this arrangement adds atomic planes
lying perpendicular to
x
and removes an equal number of planes lying perpen-
dicular to
y,
causing the specimen to lengthen and shorten in the direction of
the applied stresses. Find an expression for the instantaneous quasi-steady-
state creep rate of this idealized structure, assuming that the dislocations act
as
perfect sources or sinks.
Surround each dislocation by a cylindrical cell in which the diffusion
to/from the dislocation is assumed to be cylindrical (see Fig.
16.12),
and
use a mean-field approximation similar to the one used in the analysis
of particle coarsening.
Solution.
The flux equation is given by Eq.
13.3,
and the diffusion equation in the
quasi-steady state is
V2@~
=
0.
The derivation of Eq.
13.4
shows that the climb force
exerted on the sink dislocations will cause the value of
@A
at their core radii,
R,,
to
have the value
@:(sinks)
=
pi
-
u
i2
(16.74)
while at the source dislocations,
@:(sources)
=
pi
+
u
R
(16.75)
At the surface
of
the cell at
r
=
L/2,
we use the mean-field boundary value
@A
(g)
=
bi
(16.76)
The general solution of the diffusion equation in cylindrical coordinates is
@A
=
a1
lnr+
az,
and using the boundary conditions above to determine the constants
a1
and
a2,
(16.77)
Using the flux equation, the diffusion current into a dislocation (per unit length) is
27r
*Du
f
kT
ln[L/(2Ro)]
I
=
kt27rrJ~
=
=k
(16.78)
and after taking account of the density
of
dislocations, the creep rate along
z
is
.
IR
7r
*DR
E=-=
2LZ fkTLz ln[L/(2Ro)]
(16.79)
The creep rate
is
therefore proportional to the stress and also closely proportional to
the dislocation density (i.e.,
L-2).
16.4
A thin-walled pure-metal pipe of inner radius
R'"
and outer radius
Rout
is
heated.
(a)
Find an expression for the quasi-steady-state rate
at
which it will shrink.
Assume that the surfaces act as perfect sources for atoms and that the
interior is free of internal sources.
(b)
An inert insoluble gas is introduced in the pipe at a pressure
P.
Find the
value of
P
that will stop the pipe from shrinking. The external pressure
is small enough so that it may be ignored.
EXERCISES
413
Solution.
(a) In the quasi-steady-state Laplace equation,
V2@(r)
=
0
holds for the diffusion
potential and Eq. 13.3 holds for the diffusion flux. The boundary conditions on
@
at the surfaces are
(16.80)
Using the solution of the Laplace equation for diffusion in cylindrical coordinates
given by Eq. 5.10, fitting
it
to the boundary conditions given by Eq. 16.80, and
employing Eq. 13.3 for the flux, the total diffusion current of atoms (per unit pipe
length) passing radially from
R'"
to
Rout
is
27r*D(@'"
-
@Out)
RkTf
In( Rout/Rin)
I=
which may be compared with Eq. 5.13. Now,
RI
-
dRout
dt 27rRoUt
(16.81)
(16.82)
and for the thin-walled pipe,
1n(Rout/Rin)
=
ln(1
+
AR/Rin)
x
AR/(R),
where
AR
=
Rout
-
Rin
and
Rout
-
-
Rin
x
(R).
Using these results and Eq. 16.81,
(16.83)
(b) The internal pressure causes the diffusion potential at
R'"
to be
@"
=
po
-
RyS/Rin
+
RP.
Equation 16.81 then becomes
(16.84)
27r*D(ain
-
@Out)
-
27r*D(P
-
2ys/(R))
RkTf
ln(Rout/Rin)
kTf
ln(Rout/Rin)
-
I=
and shrinkage will stop when
P
=
2yS/(R).
16.5
Suppose that a body made up
of
fine particles can sinter by either the crystal
diffusion mechanism
BS
.
XL
or the grain-boundary diffusion mechanism
BS
.
B
as illustrated in Fig.
16.7.
How
will the relative sintering rates due
to these two mechanisms vary as:
(a)
The particle size is decreased?
(b)
The temperature is decreased?
Solution.
(a) Let
sintering rate due to grain-boundary diffusion
sintering rate due to crystal diffusion
Ratio
=
The sintering rate due to boundary diffusion and crystal diffusion will be propor-
tional to
*DB
and
*DxL,
respectively. The scaling laws show that the sintering
rate due to boundary diffusion will decrease by the factor
A-4
when the particle
size is increased by the factor
A.
The corresponding factor for sintering by crystal
414
CHAPTER
16
MORPHOLOGICAL EVOLUTION DIFFUSIONAL CREEP, AND SlNTERlNG
difFusion
is
X3.
Therefore,
(16.85)
Sintering by boundary diffusion will become more important as the particle size
decreases.
(b) Because
*DB
increases relative to
*DxL
as the temperature decreases, sintering
by boundary diffusion will become more important as the temperature decreases.
scaling law holds for the sintering of a bundle of parallel wires
by means of grain-boundary diffusion, which was analyzed in Section 16.1.2.
Solution.
The rate of sintering is given by
Eq.
16.16. Using the formalism of Sec-
tion 16.3.4, where all dimensions in the
B
system are
X
times larger than in the
S
system,
16.6
Show that
a
rateB
(~/LB)
+
c(
[~/(LBw~)I
[japp
+
2yS(nBwi3
-
sin
91
rates
(1,'~s)
%
[~/(Lsw;)]
[japp
+
2ys(nsws
-
sin
f)]
-
(16.86)
- -
[~/(XLSX~W;)]
{japp
+
2yS[(ns/~)
xws
-
sin
f]}
=
A-4
[~/(LSW;)]
[japp
+
2yS(nsws
-
sin
f)]
16.7
Consider a grain boundary containing a uniform distribution of small pores
(as shown in Fig. 16.13) that is subjected to a normal tensile stress
0%
at
a
large distance from the boundary.
The pores will either grow or shrink by transferring atoms via grain-boundary
diffusion to or from the grain boundary acting as a sink or source, respectively,
depending upon the magnitude of the applied stress. Find an expression for
the rate of growth of the pore volume in a form proportional to the quantity
(Fapp
+
T),
where
Fapp
is the force applied to each pore cell (shown dashed
in Fig. 16.13) and
T
is the corresponding capillary force given by
(
16.87)
27rySR2
T=
R
0
Construct a cylindrical cell of radius R, centered on a single pore as
illustrated in Fig. 16.13 and solve the diffusion problem within it using
cylindrical coordinates and the same basic method employed to obtain
0:
tttfttttttttttt
I I
Grain
I
R,
I
boundary
I ?I
Ill
Ill
Ill
Ill
I I
r\
W
w,w,u
wircciwiicc
0:
Figure
16.13:
Distribution
of
pores in grain boundary subjected to tensile stress
CT,"~.